MARKET INSIGHTS
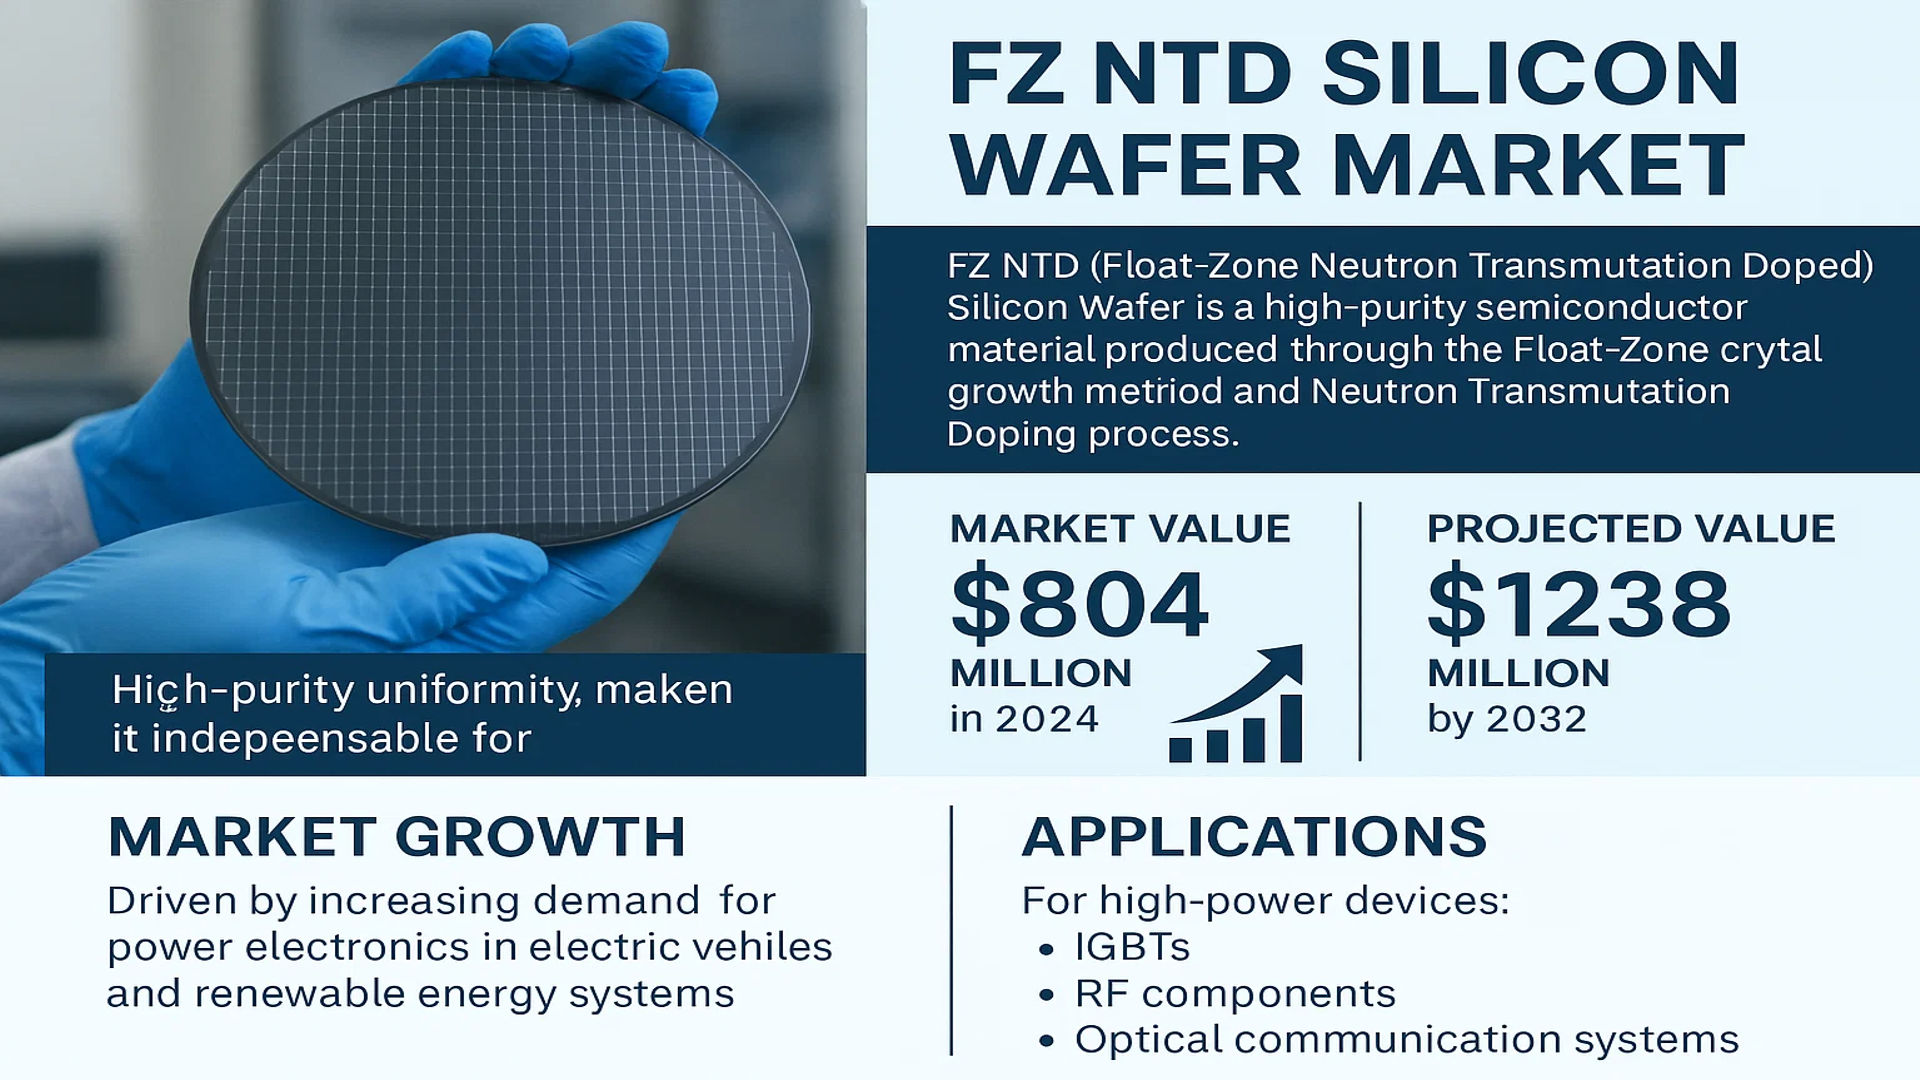
The global FZ NTD Silicon Wafer Market was valued at 804 million in 2024 and is projected to reach US$ 1238 million by 2032, at a CAGR of 6.4% during the forecast period.
FZ NTD (Float-Zone Neutron Transmutation Doped) Silicon Wafer is a high-purity semiconductor material produced through the Float-Zone crystal growth method and Neutron Transmutation Doping process. This advanced manufacturing technique ensures exceptional electrical uniformity, making it indispensable for high-power devices such as IGBTs, RF components, and optical communication systems.
The market growth is primarily driven by increasing demand for power electronics in electric vehicles and renewable energy systems, where these wafers enable superior thermal and electrical performance. Furthermore, emerging applications in quantum computing and advanced MEMS sensors are creating new opportunities. Leading manufacturers are investing heavily in production scaling, with companies like Shin-Etsu Chemical and SUMCO collectively holding over 60% of the global market share as of 2024.
MARKET DYNAMICS
MARKET DRIVERS
Rising Demand for High-Power and High-Frequency Electronic Devices Accelerates Market Growth
The global FZ NTD silicon wafer market is experiencing significant growth due to the escalating demand for high-power and high-frequency electronic devices across industries. These specialized wafers, known for their superior electrical uniformity and low defect density, are becoming indispensable in power semiconductor manufacturing. With industries increasingly requiring devices that can handle higher voltages and frequencies, the adoption of FZ NTD silicon wafers has grown by approximately 8% annually in recent years. Applications in electric vehicles, renewable energy systems, and 5G infrastructure are particularly driving this demand, as these sectors require components with excellent thermal stability and electrical performance.
Advancements in Quantum Computing Create New Demand Frontiers
The emerging quantum computing sector is presenting substantial growth opportunities for the FZ NTD silicon wafer market. Quantum computing requires ultra-pure silicon materials with minimal defects for qubit implementation, making FZ NTD wafers ideal candidates. With global investments in quantum computing research surpassing $30 billion recently, the demand for high-quality substrate materials is surging. Research institutions and tech giants are actively collaborating with wafer manufacturers to develop specialized FZ NTD silicon products tailored for quantum applications, driving innovation and market expansion in this niche segment.
Expansion of Optical Communication Networks Fuels Market Growth
The rapid expansion of global fiber optic networks and data centers is creating robust demand for FZ NTD silicon wafers in photonic integrated circuits and optical modulators. With data traffic growing at a compound annual rate of about 25%, telecommunication providers are investing heavily in next-generation optical infrastructure. FZ NTD wafers, with their low oxygen content and high purity characteristics, enable superior performance in optical devices. The market for optical communication applications has grown by approximately 12% year-over-year, with projections indicating sustained growth as 6G development gains momentum and data center expansions continue globally.
➤ The increasing deployment of silicon photonics in artificial intelligence hardware is expected to further boost demand, with FZ NTD wafers playing a crucial role in enabling photonic-electronic integration.
MARKET RESTRAINTS
High Production Costs and Complex Manufacturing Process Limit Market Expansion
While the FZ NTD silicon wafer market shows strong growth potential, it faces significant restraints due to the complex and costly manufacturing processes involved. The float-zone crystal growth method requires specialized equipment and controlled environments, resulting in production costs that are approximately 30-40% higher than conventional CZ (Czochralski) wafers. The neutron transmutation doping process further adds to the expense, requiring access to nuclear reactors and specialized handling procedures. These factors contribute to higher end-product prices, making FZ NTD wafers less competitive in price-sensitive applications and limiting their adoption in mass-market consumer electronics.
Supply Chain Complexities and Geopolitical Factors Create Market Volatility
The FZ NTD silicon wafer market faces significant challenges from global supply chain complexities and geopolitical uncertainties. The industry relies on a limited number of suppliers for critical raw materials and specialized equipment, creating bottlenecks in production. Recent geopolitical tensions have led to export controls on specialized semiconductor manufacturing technologies, affecting the availability of key components. Additionally, the neutron doping process requires access to nuclear facilities, which are subject to strict international regulations and political considerations. These constraints have caused fluctuations in lead times and pricing, with some customers reporting delivery delays of up to 6-8 months for specialized wafer products.
Competition from Alternative Technologies Presents Market Challenges
The FZ NTD silicon wafer market faces increasing competition from emerging substrate materials and alternative doping technologies. Silicon carbide (SiC) and gallium nitride (GaN) wafers are gaining traction in high-power applications, offering superior performance in certain use cases. Ion implantation techniques have also improved significantly, providing alternatives to neutron transmutation doping in some applications. While FZ NTD wafers maintain advantages in specific high-end applications, these competing technologies have captured approximately 15-20% of the potential market share in recent years, particularly in automotive and power electronics segments.
MARKET OPPORTUNITIES
Emerging Applications in Space and Defense Electronics Present Growth Potential
The FZ NTD silicon wafer market stands to benefit significantly from increasing demand in aerospace and defense applications. The exceptional radiation hardness and reliability of these wafers make them ideal for satellite components, space-grade electronics, and military systems. With global space industry investments exceeding $100 billion annually and defense budgets increasing in major economies, specialized semiconductor materials with radiation-resistant properties are seeing heightened demand. This segment has grown by approximately 18% year-over-year, with projections indicating continued expansion as space commercialization accelerates and defense systems become more sophisticated.
Advancements in Manufacturing Technologies Enable Cost Reduction Opportunities
Recent breakthroughs in production technologies are creating opportunities to reduce costs and expand market accessibility for FZ NTD silicon wafers. Innovations in crystal growth automation, process optimization, and alternative doping methods are improving yields and reducing manufacturing expenses. Some leading manufacturers have reported efficiency improvements of 15-20% through advanced process control systems and machine learning applications. These advancements are enabling price reductions of approximately 7-10% annually, making FZ NTD wafers more competitive in medium-performance applications while maintaining margins in high-end segments.
Strategic Partnerships Across Value Chain Create New Market Pathways
The FZ NTD silicon wafer market is witnessing a surge in strategic collaborations between wafer manufacturers, equipment suppliers, and end-users. Vertical integration initiatives are helping companies secure supply chains and reduce production costs, while joint development programs with research institutions are accelerating innovation. Several major players have recently announced partnerships with quantum computing firms and optical communication companies to develop application-specific wafer solutions. These collaborations are not only driving technological advancements but also creating more stable demand patterns and longer-term contracts, providing manufacturers with greater visibility and reducing market volatility.
MARKET CHALLENGES
Specialized Workforce Shortages Impact Production Capabilities
The FZ NTD silicon wafer industry faces significant challenges in attracting and retaining skilled personnel with expertise in specialized crystal growth and doping technologies. The niche nature of float-zone production requires years of hands-on experience, creating a talent bottleneck as industry veterans retire. Training new technicians can take 18-24 months, leading to production constraints during periods of high demand. Some manufacturers report vacancy rates of 15-20% for critical technical positions, forcing them to operate below capacity despite strong market demand. This skills gap has become a persistent challenge, particularly in regions with competitive semiconductor labor markets.
Regulatory Compliance Adds Complexity to Operations
The neutron doping process essential to FZ NTD wafer production subjects manufacturers to stringent nuclear regulatory requirements across multiple jurisdictions. Compliance with safety protocols, transportation regulations, and materials handling procedures adds substantial overhead to operations. Recent regulatory changes in several key markets have required facility upgrades and additional staff training, with compliance costs increasing by approximately 12-15% over the past three years. These requirements can delay production schedules and create barriers to entry for new market participants, potentially limiting supply growth to meet expanding demand.
Economic Uncertainty Affects Investment Decisions
Macroeconomic volatility presents ongoing challenges for the FZ NTD silicon wafer market. Fluctuations in global semiconductor demand, currency exchange rates, and interest rates impact capital expenditure decisions for capacity expansions. The capital-intensive nature of FZ NTD manufacturing means that investment cycles must be carefully timed, but economic uncertainty has caused some projects to be delayed or scaled back. While long-term demand fundamentals remain strong, short-to-medium term economic headwinds have led to more conservative growth strategies among manufacturers, potentially constraining supply as the market continues to expand.
FZ NTD SILICON WAFER MARKET TRENDS
Growing Demand for High-Performance Semiconductor Devices Fuels Market Expansion
The global FZ NTD Silicon Wafer market, valued at $804 million in 2024, is experiencing robust growth driven by the escalating demand for high-performance semiconductor devices. With industries such as consumer electronics, telecommunications, and computing advancing rapidly, the need for ultra-pure silicon wafers with superior electrical uniformity is accelerating. FZ NTD (Float-Zone Neutron Transmutation Doped) wafers, known for their high purity and low defect density, are becoming indispensable in power semiconductors and high-voltage applications. This demand is projected to push the market to $1,238 million by 2032, growing at a compound annual growth rate (CAGR) of 6.4%.
Other Trends
Quantum Computing Adoption
Quantum computing applications are driving significant advancements in the FZ NTD Silicon Wafer market. The exceptional purity and minimal defect characteristics of these wafers make them ideal for fabricating quantum bits (qubits), a critical component in quantum computing systems. As research in quantum technologies intensifies, the adoption of FZ silicon wafers is expected to rise, particularly in specialized research institutions and commercial quantum processor developers.
Advancements in Manufacturing and Cost Efficiency
Technological innovations in FZ silicon wafer manufacturing are significantly impacting market dynamics. Improvements in single-crystal growth techniques, wafer thinning, and defect control have enhanced production efficiency while reducing costs. Automation and smart manufacturing practices are further optimizing the process, enabling manufacturers to scale production while maintaining stringent quality standards. These advancements are making FZ NTD Silicon Wafers more accessible to a broader range of industries, including optical communications and MEMS (Micro-Electro-Mechanical Systems).
COMPETITIVE LANDSCAPE
Key Industry Players
Market Leadership Shaped by Technological Advancements and Strategic Expansions
The global FZ NTD Silicon Wafer market features a dynamic competitive environment with a mix of established semiconductor suppliers and emerging innovators. The market is currently semi-consolidated, with major players controlling significant market share while smaller regional competitors focus on niche applications. This structure fosters a balance between technological leadership and cost-competitive solutions.
Shin-Etsu Chemical and SUMCO Corporation dominate the market landscape, collectively accounting for over 35% of global FZ NTD wafer production capacity in 2024. Their leadership stems from decades of expertise in crystal growth technologies and strategic partnerships with power semiconductor manufacturers. These Japanese giants continue to invest heavily in R&D, particularly in large-diameter wafer development and defect reduction techniques that are critical for next-generation power devices.
Emerging players like Zhonghuan Advanced and GRINM Semiconductor Materials are rapidly gaining traction through aggressive capacity expansions and government-backed semiconductor initiatives, particularly in China. Their growth reflects the broader industry shift toward regional supply chain resilience and the increasing importance of domestic semiconductor material production.
Meanwhile, European manufacturers such as Siltronic maintain strong positions in specialty applications, particularly for high-voltage power electronics and advanced RF devices. Their competitive advantage lies in precision engineering capabilities and close collaborations with automotive and industrial customers that demand the highest wafer quality standards.
List of Key FZ NTD Silicon Wafer Manufacturers
- Shin-Etsu Chemical Co., Ltd. (Japan)
- SUMCO Corporation (Japan)
- Siltronic AG (Germany)
- GlobalWafers Co., Ltd. (Taiwan)
- Zhonghuan Advanced Semiconductor Materials (China)
- Beijing Jingyuntong Technology Co., Ltd. (China)
- Luoyang Hongtai Semiconductor Co., Ltd. (China)
- GRINM Semiconductor Materials Co., Ltd. (China)
- WaferPro LLC (U.S.)
- PlutoSemi Technology Corporation (China)
Segment Analysis:
By Type
8-Inch Wafers Dominate Due to Higher Adoption in Power Semiconductor Manufacturing
The market is segmented based on type into:
- Less than 6 inch
- 8 inch
By Application
IGBT Segment Leads Owing to Increasing Demand in Electric Vehicle Power Modules
The market is segmented based on application into:
- MEMS
- Transistor
- IGBT
- RF Device
- Optical Communication
- Other
By Material Purity
Ultra-High Purity Wafers Gain Traction for Quantum Computing Applications
The market is segmented based on material purity into:
- Standard Purity (Resistivity: 1-100 Ω·cm)
- High Purity (Resistivity: 100-1000 Ω·cm)
- Ultra-High Purity (Resistivity: >1000 Ω·cm)
By End-Use Industry
Automotive Sector Shows Strong Growth Potential for Electric Vehicle Components
The market is segmented based on end-use industry into:
- Automotive
- Consumer Electronics
- Industrial
- Telecommunications
- Others
Regional Analysis: FZ NTD Silicon Wafer Market
Asia-Pacific
The Asia-Pacific region dominates the global FZ NTD Silicon Wafer market, accounting for over 45% of global demand in 2024. This leadership stems from robust semiconductor fabrication in China, Japan, and South Korea, coupled with significant investments in quantum computing and 5G infrastructure. China’s Semiconductor Manufacturing International Corporation (SMIC) and Japan’s Shin-Etsu Chemical are key players driving innovation in wafer production. The region benefits from strong government support for semiconductor self-sufficiency, exemplified by China’s $150 billion semiconductor investment plan. While cost competitiveness remains critical, manufacturers are increasingly prioritizing high-purity wafers for advanced applications, creating a dual-track market.
North America
North America’s market growth is fueled by high-performance computing and defense applications, with the U.S. representing 28% of regional demand. Strict export controls on advanced semiconductor technologies have spurred domestic FZ NTD wafer production, particularly for radiation-hardened electronics used in aerospace. The CHIPS and Science Act’s $52 billion allocation is accelerating capacity expansion, with companies like WaferPro scaling 8-inch wafer production. However, higher manufacturing costs compared to Asia and talent shortages in semiconductor engineering pose ongoing challenges. The region maintains technological leadership in quantum dot and photonic IC applications, driving demand for ultra-low-defect wafers.
Europe
Europe’s market is characterized by specialization in power electronics and automotive semiconductors, with Germany’s Infineon Technologies and Siltronic AG being major consumers. The EU’s €43 billion Chips Act aims to double Europe’s global market share to 20% by 2030, with specific provisions for specialty wafers. Stringent environmental regulations favor FZ NTD wafers over conventional CZ-grown alternatives due to their lower energy consumption during production. While the region lags in volume production, it excels in high-value applications like EV power modules and industrial IGBTs, creating稳定 demand for customized wafer solutions.
South America
The South American market remains nascent but shows potential in basic power electronics and MEMS sensors. Brazil’s CEITEC S.A. represents the region’s primary wafer-level capability, though most advanced wafers are imported. Economic instability and limited semiconductor infrastructure constrain market growth, but the renewable energy sector’s expansion (particularly in Chile and Argentina) is creating new demand for high-voltage wafer applications. Local governments are implementing tax incentives to attract wafer testing and packaging facilities, which may stimulate upstream material demand over the next decade.
Middle East & Africa
This emerging market is witnessing selective growth in oil/gas sensor applications and telecommunications infrastructure. The UAE’s Dolphin Investment and Saudi Arabia’s Saudi Electronics and Home Appliances Institute (SEHAI) are spearheading regional semiconductor initiatives. While wafer production capabilities remain limited, the establishment of semiconductor design hubs in Dubai and Tel Aviv is increasing demand for prototype-grade FZ wafers. The region’s harsh operating environments favor NTD wafers’ temperature stability, particularly for downhole electronics. Long-term growth will depend on successful technology transfer agreements with Asian and European partners.
Report Scope
This market research report provides a comprehensive analysis of the Global FZ NTD Silicon Wafer Market, covering the forecast period 2025–2032. It offers detailed insights into market dynamics, technological advancements, competitive landscape, and key trends shaping the industry.
Key focus areas of the report include:
- Market Size & Forecast: Historical data and future projections for revenue, unit shipments, and market value across major regions and segments. The Global FZ NTD Silicon Wafer market was valued at USD 804 million in 2024 and is projected to reach USD 1238 million by 2032, growing at a CAGR of 6.4%.
- Segmentation Analysis: Detailed breakdown by product type (Less than 6 inch, 8 inch), application (MEMS, Transistor, IGBT, RF Device, Optical Communication), and end-user industries to identify high-growth segments.
- Regional Outlook: Insights into market performance across North America, Europe, Asia-Pacific, Latin America, and Middle East & Africa, with country-level analysis for key markets like China, Japan, US, and Germany.
- Competitive Landscape: Profiles of 11 leading market participants including Shin-Etsu Chemical, SUMCO, Siltronic, and GlobalWafers, covering their product portfolios, manufacturing capacities, and strategic developments.
- Technology Trends: Assessment of Float-Zone crystal growth innovations, Neutron Transmutation Doping advancements, and emerging applications in quantum computing and optoelectronics.
- Market Drivers: Analysis of factors including demand for high-performance semiconductors, growth in power electronics, and advancements in optical communication technologies.
- Supply Chain Analysis: Examination of raw material sourcing, production processes, and distribution networks in the FZ NTD Silicon Wafer ecosystem.
The research employs both primary and secondary methodologies, including interviews with key industry players (manufacturers representing 85% of global market share), analysis of financial reports, and validation through industry associations and trade data.
FREQUENTLY ASKED QUESTIONS:
What is the current market size of Global FZ NTD Silicon Wafer Market?
-> FZ NTD Silicon Wafer Market was valued at 804 million in 2024 and is projected to reach US$ 1238 million by 2032, at a CAGR of 6.4% during the forecast period.
Which key companies operate in Global FZ NTD Silicon Wafer Market?
-> Key players include Shin-Etsu Chemical, SUMCO, Siltronic, GlobalWafers, Zhonghuan Advanced, and GRINM Semiconductor Materials, collectively holding over 65% market share.
What are the key growth drivers?
-> Primary drivers include rising demand for power semiconductors (IGBTs), quantum computing applications, 5G infrastructure deployment, and automotive electrification trends.
Which region dominates the market?
-> Asia-Pacific accounts for 58% of global demand (2024), led by China, Japan, and South Korea, due to concentrated semiconductor manufacturing ecosystems.
What are the emerging applications?
-> Emerging applications include quantum computing chips, advanced RF devices for 6G, and next-gen optical communication systems, with these segments growing at 9.2% CAGR.

Get Sample Report PDF for Exclusive Insights
Report Sample Includes
- Table of Contents
- List of Tables & Figures
- Charts, Research Methodology, and more...


