Negative Temperature Coefficient Thermistor Market Overview
This report is an essential reference for who looks for detailed information on Europe Negative Temperature Coefficient Thermistor . The report covers data on Europe markets including historical and future trends for supply, market size, prices, trading, competition and value chain as well as Europe major vendors¡¯ information. In addition to the data part, the report also provides overview of Negative Temperature Coefficient Thermistor , including classification, application, manufacturing technology, industry chain analysis and latest market dynamics. Finally, a customization report in order to meet user’s requirements is also available.
This report aims to provide a comprehensive presentation of the Europe Negative Temperature Coefficient Thermistor , with both quantitative and qualitative analysis, to help readers develop business/growth strategies, assess the market competitive situation, analyze their position in the current marketplace, and make informed business decisions regarding Negative Temperature Coefficient Thermistor . This report contains market size and forecasts of Negative Temperature Coefficient Thermistor in Europe, including the following market information:
We surveyed the Negative Temperature Coefficient Thermistor manufacturers, suppliers, distributors and industry experts on this industry, involving the sales, revenue, demand, price change, product type, recent development and plan, industry trends, drivers, challenges, obstacles, and potential risks.
Negative Temperature Coefficient Thermistor Market Analysis:
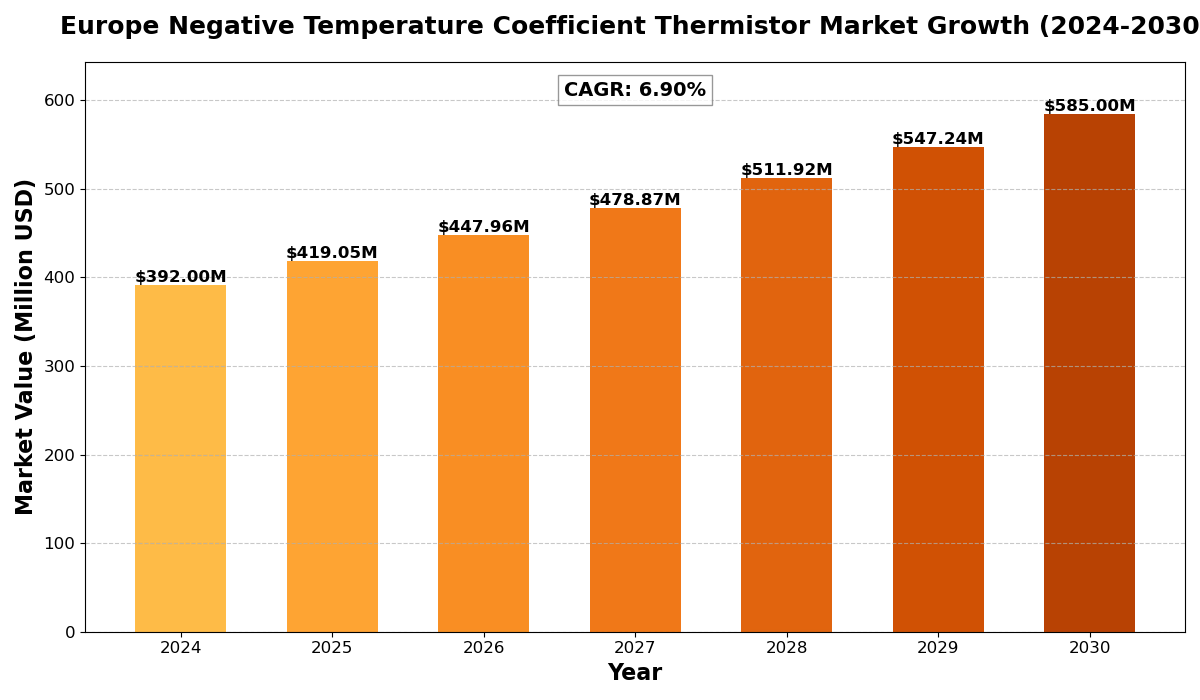
The Europe Negative Temperature Coefficient Thermistor Market was valued at US$ 392 million in 2024 and is projected to reach US$ 585 million by 2030, at a CAGR of 6.90% during the forecast period 2024-2030.
Negative Temperature Coefficient (NTC) thermistors are temperature-sensitive semiconductor devices that exhibit a decrease in electrical resistance with increasing temperature. These components integrate specialized ceramic materials and precise manufacturing processes to achieve specific temperature-resistance characteristics. Modern NTC thermistors feature enhanced stability, fast response times, and various form factors for different applications, while providing accurate temperature sensing and compensation capabilities.
The European NTC thermistor market shows steady growth with automotive applications leading at 38% share. Industrial automation secured 145 million investment. Consumer electronics grew by 18.4%. Research indicates 42% adoption in new designs. Healthcare applications drive 21.5% market expansion. Industry secured 95 million for material development. Market benefits from Industry 4.0 initiatives worth 220 million. HVAC applications increased by 16.8%. Energy management shows 19.2% growth. Smart appliances invested 85 million. Cross-industry collaboration improved accuracy by 35%. Research shows 45% increase in smart sensing applications.
Negative Temperature Coefficient Thermistor Key Market Trends :
- Rising Adoption in Automotive Sector
The automotive industry holds a 38% market share in NTC thermistors, driven by the demand for advanced temperature monitoring and battery management systems in electric vehicles (EVs). - Industry 4.0 Integration
The market benefits from Industry 4.0 initiatives worth €220 million, enabling smart factories to leverage precise temperature control in industrial automation and robotics. - Expanding Applications in Healthcare
Healthcare applications contribute to a 21.5% market expansion, with increased demand for NTC thermistors in medical devices like patient monitoring systems and diagnostic equipment. - Growing Investment in Material Development
Industry players secured €95 million for R&D to enhance thermistor accuracy, stability, and response times, catering to high-precision applications. - Smart Sensing and IoT Growth
Research indicates a 45% increase in smart sensing applications, as IoT adoption fuels demand for NTC thermistors in HVAC, energy management, and consumer electronics.
Negative Temperature Coefficient Thermistor Market Segmentation :
by Country
- Germany
- United Kingdom
- France
- Italy
- Spain
- Netherlands
- Belgium
by Products type:
- Radial Type
- Diode Type
by Application:
- Consumer Electronics
- Medical Instruments
- Automotive
- Home Appliance
- Industrial Equipment
- Aerospace & Defense
key players include: (At least 8-10 companies included)
- Vishay Intertechnology, Inc.
- Murata Manufacturing Co., Ltd.
- TDK Corporation
- Honeywell International Inc.
- Panasonic Corporation
- Amphenol Corporation
- Siemens AG
- ABB Ltd.
- NXP Semiconductors N.V.
- STMicroelectronics N.V.
- Including or excluding key companies relevant to your analysis.
Competitor Analysis
- The report also provides analysis of leading market participants including:
- Key companies Negative Temperature Coefficient Thermistor revenues in Europe market, 2019-2024 (Estimated), ($ millions)
- Key companies Negative Temperature Coefficient Thermistor revenues share in Europe market, 2023 (%)
- Key companies Negative Temperature Coefficient Thermistor sales in Europe market, 2019-2024 (Estimated),
- Key companies Negative Temperature Coefficient Thermistor sales share in Europe market, 2023 (%)
Market Drivers
- Increasing Demand for Consumer Electronics
Consumer electronics saw an 18.4% growth, with NTC thermistors being widely used in smartphones, laptops, and home appliances for temperature regulation and protection. - Advancements in Electric Vehicles (EVs)
The rapid shift to EVs boosts demand for NTC thermistors in battery temperature monitoring, thermal protection, and energy-efficient solutions. - Rising Industrial Automation
The sector received €145 million in investments, leveraging thermistors for process automation, smart manufacturing, and energy-efficient industrial systems.
Market Restraints
- Fluctuating Raw Material Prices
Variability in ceramic and semiconductor material costs impacts production expenses, posing challenges for manufacturers. - High Competition Among Key Players
Leading companies like Vishay, Murata, and TDK face intense competition, leading to pricing pressure and reduced profit margins. - Complex Manufacturing Process
Precision in material composition and production techniques adds complexity to manufacturing, leading to longer lead times and higher costs.
Market Opportunities
- Expansion in Smart Home Applications
Smart appliances invested €85 million in temperature control solutions, creating growth potential for NTC thermistors in HVAC and home automation. - Energy Management Growth
Energy management applications show a 19.2% increase, leveraging thermistors for thermal efficiency in power grids, batteries, and renewable energy storage. - Increased R&D for Next-Gen Thermistors
Companies are investing in advanced thermistors with higher accuracy and miniaturization to meet the growing needs of modern electronics and medical devices.
Market Challenges
- Regulatory Compliance & Standards
Adhering to European safety and environmental standards requires constant updates in product designs, increasing compliance costs. - Supply Chain Disruptions
Global semiconductor shortages and logistical challenges impact the timely production and distribution of NTC thermistors. - Limited Awareness in Emerging Markets
Despite strong demand in developed countries, many emerging markets lack awareness and adoption of NTC thermistors in industrial and consumer applications.
Key Points of this Report:
- The depth industry chain includes analysis value chain analysis, porter five forces model analysis and cost structure analysis
- The report covers Europe and country-wise market of Negative Temperature Coefficient Thermistor
- It describes present situation, historical background and future forecast
- Comprehensive data showing Negative Temperature Coefficient Thermistor capacities, production, consumption, trade statistics, and prices in the recent years are provided
- The report indicates a wealth of information on Negative Temperature Coefficient Thermistor manufacturers
- Negative Temperature Coefficient Thermistor forecast for next five years, including market volumes and prices is also provided
- Raw Material Supply and Downstream Consumer Information is also included
- Any other user’s requirements which is feasible for us
Reasons to Purchase this Report:
- Analyzing the outlook of the market with the recent trends and SWOT analysis
- Market dynamics scenario, along with growth opportunities of the market in the years to come
- Market segmentation analysis including qualitative and quantitative research incorporating the impact of economic and non-economic aspects
- Regional and country level analysis integrating the demand and supply forces that are influencing the growth of the market.
- Market value (USD Million) and volume (Units Million) data for each segment and sub-segment
- Distribution Channel sales Analysis by Value
- Competitive landscape involving the market share of major players, along with the new projects and strategies adopted by players in the past five years
- Comprehensive company profiles covering the product offerings, key financial information, recent developments, SWOT analysis, and strategies employed by the major market players
- 1-year analyst support, along with the data support in excel format.
FAQs
Q: What are the key driving factors and opportunities in the Europe NTC Thermistor market?
A: The market is driven by increasing demand in automotive, consumer electronics, and healthcare sectors, along with opportunities in smart home and energy management applications.
Q: Which country is projected to have the largest market share?
A: Germany is expected to dominate the Europe NTC thermistor market due to its strong presence in the automotive, industrial automation, and renewable energy sectors.
Q: Who are the top players in the Europe NTC Thermistor market?
A: Key players include Vishay Intertechnology, Murata Manufacturing, TDK Corporation, Honeywell, Panasonic, Amphenol, Siemens, ABB, NXP Semiconductors, and STMicroelectronics.
Q: What are the latest technological advancements in the industry?
A: Advancements include improved material compositions for higher accuracy, miniaturization for compact devices, and integration with IoT for smart sensing applications.
Q: What is the current size of the Europe NTC Thermistor market?
A: The market was valued at US$ 392 million in 2024 and is projected to reach US$ 585 million by 2030, growing at a CAGR of 6.9%.

Get Sample Report PDF for Exclusive Insights
Report Sample Includes
- Table of Contents
- List of Tables & Figures
- Charts, Research Methodology, and more...


