SEMICONDUCTOR INSIGHT
MARKET RESEARCH REPORT

Ethernet Switch Chips Market

2026 to 2034
MARKET INTELLIGENCE
ACROSS KEY REGIONS
2026 EDITION
COMMUNICATION SYSTEMS Semiconductor Market Research

Ethernet Switch Chips Market

Trends, Business Strategies 2026-2034

◷
UPDATED 24 September 2026
▤
REPORT LENGTH Detailed Report
▣
REPORT CODE b70e64283bb3
▯
FORMATS PDF

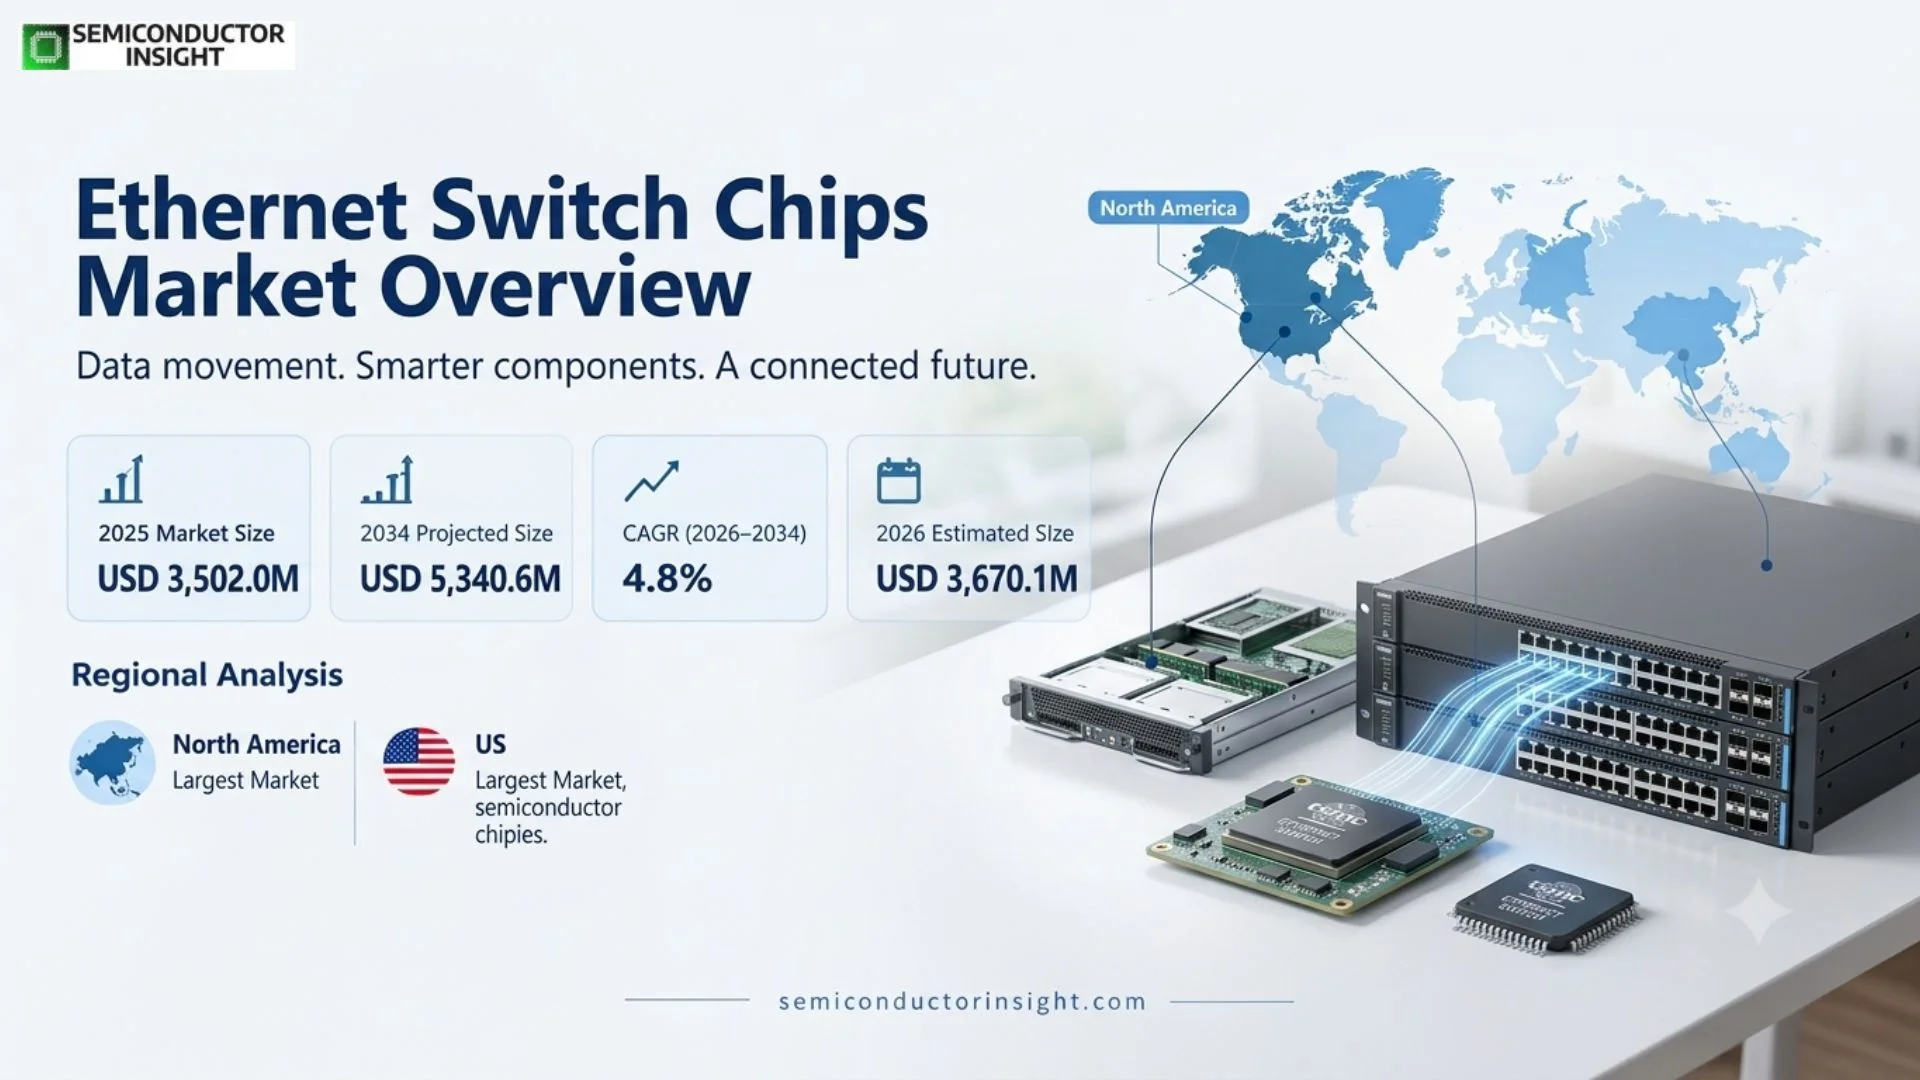
Ethernet Switch Chips Market is projected to reach USD 5,340.6 million by 2034, representing a 4.8% CAGR during 2026–2034. North America is the largest market in 2025. The 2026 estimated market size is USD 3,670.1 million, consistent with the growth path implied by the published value anchors.

Get the sample PDF with study scope, segmentation and methodology details.

Key Statistics

2025 Market Size
USD 3,502.0 million
2034 Projected Market Size
USD 5,340.6 million
CAGR (2026–2034)
4.8%
Largest Market in 2025
North America

Key Takeaways

  • 10G remains a core commercial segment because it is already embedded in established system architectures and benefits from a broad installed base.
  • 100G Above carries the strongest technology-led growth profile as customers prioritize higher density, efficiency or throughput and accept greater qualification complexity.
  • Data Centers is a key growth application because it translates end-market technology shifts directly into higher electronic content and more demanding component specifications.
  • North America is the largest regional market in 2025, while Asia Pacific has the strongest structural growth momentum through the forecast window.
  • The market expands from USD 3,502.0 million in 2025 to USD 5,340.6 million in 2034, corresponding to a 4.8% CAGR for 2026–2034.
  • Supplier advantage increasingly depends on qualification depth, manufacturing scale, engineering support and lifecycle assurance rather than on nominal component specifications alone.

Ethernet Switch Chips Market Overview

Ethernet Switch Chips market is valued at USD 3,502.0 million in 2025 and is projected to reach USD 5,340.6 million by 2034, representing a 4.8% CAGR during 2026–2034. North America is the largest market in 2025. The 2026 estimated market size is USD 3,670.1 million, consistent with the growth path implied by the published value anchors.

Base year: 2025 · Estimated year: 2026 · Forecast period: 2026–2034 · Values in USD million

Ethernet switch chips are high-throughput networking integrated circuits that classify, buffer and forward packets across switch ports. They sit at the core of data-center, enterprise and telecom switching platforms, with architectural competition centered on aggregate switching capacity, SerDes speed, radix, buffering, telemetry, programmability, latency and power efficiency.

The market is not defined by a single component specification. It is an ecosystem of design choices, manufacturing capability, qualification requirements and downstream system economics. For ethernet switch chips, the purchasing decision shifts toward suppliers that can demonstrate predictable performance across production lots, long-term availability and application support. That makes design wins sticky but also raises the cost of entering programs already served by qualified incumbents.

The current transition is being driven by end markets that require more capability per unit of power, volume or installed system cost. This favors technologies that solve a system bottleneck rather than simply offering a higher nominal specification. The commercial result is a market where premium products can grow faster than unit volume, while mature categories remain important because they anchor installed-base replacement and cost-sensitive applications.

Segment Analysis: By Type

By type, the ethernet switch chips market is segmented into 10G, 25G-40G, 100G and 100G Above. The segments differ in architecture, qualification burden and system-level value. The commercial mix therefore changes as customers move from mature solutions toward products that deliver higher density, efficiency, integration or performance within the same equipment footprint.

Type Technology and use profile Market position and commercial implication
10G 10G switch silicon serves established enterprise, industrial and access-network applications where port density, cost and long lifecycle matter more than leading-edge throughput. The segment benefits from a large installed base and mature ecosystems, but value growth is limited because the technology is well established. Suppliers compete primarily on integration, power consumption, availability and platform longevity. 10G competes on measurable system value rather than a single datasheet parameter. Buyers compare qualification history, total implementation cost, availability and engineering support. As end markets adopt more demanding architectures, suppliers that combine product performance with stable manufacturing and reference designs are positioned to capture higher-value design wins and reduce customer switching risk.
25G-40G 25G and 40G products bridge legacy data-center architectures and higher-speed deployments. 25G remains useful for server connectivity and certain enterprise designs because it improves bandwidth over 10G without requiring the most advanced optics. Growth is moderate as new AI and hyperscale designs move toward 100G-per-lane technologies, but the installed base supports replacement and cost-sensitive demand. 25G-40G competes on measurable system value rather than a single datasheet parameter. Buyers compare qualification history, total implementation cost, availability and engineering support. As end markets adopt more demanding architectures, suppliers that combine product performance with stable manufacturing and reference designs are positioned to capture higher-value design wins and reduce customer switching risk.
100G 100G switching remains a major data-center building block, supporting leaf-spine architectures, cloud infrastructure and high-performance enterprise networks. The segment has broad interoperability and established optics. Its commercial role is shifting from frontier technology toward a high-volume baseline, which makes cost per bit, power efficiency and software ecosystem support increasingly important in supplier selection. 100G competes on measurable system value rather than a single datasheet parameter. Buyers compare qualification history, total implementation cost, availability and engineering support. As end markets adopt more demanding architectures, suppliers that combine product performance with stable manufacturing and reference designs are positioned to capture higher-value design wins and reduce customer switching risk.
100G Above The 100G Above segment is the innovation engine, encompassing 200G, 400G, 800G and emerging 1.6T-class Ethernet systems. AI clusters and hyperscale data centers require extreme aggregate bandwidth and large radix. Broadcom’s 102.4 Tbps Tomahawk 6 and 51.2 Tbps platforms from Cisco and Marvell demonstrate how switching capacity is doubling while vendors add telemetry and congestion-management features. 100G Above competes on measurable system value rather than a single datasheet parameter. Buyers compare qualification history, total implementation cost, availability and engineering support. As end markets adopt more demanding architectures, suppliers that combine product performance with stable manufacturing and reference designs are positioned to capture higher-value design wins and reduce customer switching risk.

Pricing and qualification by type

Price realization across ethernet switch chips segments reflects process complexity, performance class, packaging or board construction, qualification effort and purchase volume. Mature products generally face stronger price competition, while newer high-performance categories can sustain premiums when they reduce system cost, size, power or validation burden. This creates a two-speed market in which technology migration raises average value even as legacy products continue to ship in volume.

Segment Analysis: By Application

By application, the market covers Commercial, Self-Developed, Data Centers and Enterprise Networks. Application demand is shaped by the purchasing trigger inside the end system: performance, reliability, size, power, connectivity, compliance or lifecycle cost. The strongest growth occurs where component choice directly unlocks a new system architecture rather than merely replacing an equivalent incumbent part.

Application Demand characteristics and buying trigger
Commercial Commercial switch-chip demand includes merchant silicon sold to networking OEMs, ODMs and white-box system builders. Buyers value broad interoperability, software support and a predictable roadmap because one chip can underpin multiple switch platforms. The segment favors suppliers with scale and ecosystem breadth, and it creates strong leverage for leading merchant-silicon vendors across cloud and enterprise networks.
Self-Developed Self-developed switch silicon is used by vertically integrated system or cloud companies seeking architectural differentiation, tighter hardware-software control or economics at very large scale. The approach requires major design investment and long validation cycles. It can reduce dependence on merchant silicon, but only organizations with sufficient volume can justify custom ASIC development and maintain multi-generation roadmaps.
Data Centers Data centers are the most dynamic application because AI training, cloud services and distributed storage increase east-west traffic and require low-latency fabrics. Switching silicon must scale to 400G, 800G and beyond while controlling power per bit. The commercial opportunity concentrates in high-radix chips, advanced SerDes and congestion-management architectures designed for large GPU and accelerator clusters.
Enterprise Networks Enterprise networks prioritize reliability, feature integration, security and manageable upgrade paths. Port speeds rise more slowly than in hyperscale data centers, but the installed base is broad. Switch chips used here must support VLANs, quality of service, routing and telemetry across multiple port-speed generations, creating durable demand for mature products alongside newer high-speed silicon.

Secondary segmentation: By end user

End user Commercial profile
Telecom Providers Telecom Providers represents a distinct purchasing environment within the ethernet switch chips value chain. Procurement priorities vary by scale, compliance burden, service model and system criticality, but qualification continuity and lifecycle support remain common themes. Suppliers that adapt documentation, logistics and engineering support to the end user’s operating model can defend share even when the underlying hardware specification is widely available.
Cloud Service Providers Cloud Service Providers represents a distinct purchasing environment within the ethernet switch chips value chain. Procurement priorities vary by scale, compliance burden, service model and system criticality, but qualification continuity and lifecycle support remain common themes. Suppliers that adapt documentation, logistics and engineering support to the end user’s operating model can defend share even when the underlying hardware specification is widely available.
Large Enterprises Large Enterprises represents a distinct purchasing environment within the ethernet switch chips value chain. Procurement priorities vary by scale, compliance burden, service model and system criticality, but qualification continuity and lifecycle support remain common themes. Suppliers that adapt documentation, logistics and engineering support to the end user’s operating model can defend share even when the underlying hardware specification is widely available.

Ethernet Switch Chips Market Trends

Regional Analysis

North America leads the ethernet switch chips market in 2025, while Asia Pacific carries the strongest structural growth momentum. Regional demand differs because manufacturing concentration, end-market investment, qualification ecosystems and channel structures are not evenly distributed. The most attractive region for a supplier therefore depends on whether it competes through local production, design influence, application engineering, system integration or distribution reach.

How does regional demand differ across the ethernet switch chips market?

Regional analysis is most useful when it distinguishes why customers buy. North America has the deepest current demand pool, but other regions can offer faster incremental growth in selected applications. North America is often innovation and design-led, Europe is qualification and efficiency-led, Asia Pacific combines manufacturing scale with expanding consumption, while South America and Middle East & Africa are more project and import dependent.

Region Position Growth outlook Demand profile What decides supplier selection
Asia Pacific Fastest-growing High Manufacturing, design and end-market mix vary by region. Asia Pacific is the fastest-growing region as cloud capacity, 5G transport, enterprise digitalization and domestic data-center construction expand. China, Taiwan, South Korea and Southeast Asia combine system manufacturing with rapidly growing network demand. Regional suppliers participate strongly in lower and mid-speed segments, while leading-edge AI fabrics remain concentrated around global merchant and vertically integrated silicon platforms.
North America Largest Moderate Manufacturing, design and end-market mix vary by region. North America leads because the region contains the largest concentration of hyperscale cloud operators, AI infrastructure investment and leading switch-silicon designers. Data-center operators deploy new Ethernet generations early, creating demand for 51.2 Tbps and 102.4 Tbps platforms. The market is therefore innovation-led, with power per bit and congestion management becoming as important as raw bandwidth.
Europe Established / emerging Moderate Manufacturing, design and end-market mix vary by region. Europe has steady demand from enterprise networks, telecom infrastructure, cloud regions and sovereign digital projects. Adoption of the highest-speed switch silicon follows hyperscale deployments but is moderated by a smaller concentration of global cloud headquarters. Energy efficiency is increasingly important because data-center power constraints can influence architecture, giving efficient switching silicon a clear system-level value proposition.
South America Established / emerging Moderate Manufacturing, design and end-market mix vary by region. South America is an emerging Ethernet switching market centered on cloud regions, telecom networks and enterprise modernization, with Brazil as the largest demand center. High-speed silicon enters primarily through imported systems rather than local chip production. Growth follows data-center and connectivity investment, while currency and capital-spending cycles can make deployments less consistent than in North America or Asia.
Middle East & Africa Established / emerging Moderate Manufacturing, design and end-market mix vary by region. Middle East and Africa demand is accelerating from a smaller base as Gulf countries invest in cloud regions, AI infrastructure and national data-center capacity. The region imports nearly all advanced switching silicon through systems and white-box platforms. Large projects can move directly to high-speed Ethernet architectures, creating demand for current-generation merchant silicon without a long legacy transition.
Asia Pacific FASTEST-GROWING

Why is Asia Pacific strategically important in the ethernet switch chips market?

Asia Pacific is the fastest-growing region as cloud capacity, 5G transport, enterprise digitalization and domestic data-center construction expand. China, Taiwan, South Korea and Southeast Asia combine system manufacturing with rapidly growing network demand. Regional suppliers participate strongly in lower and mid-speed segments, while leading-edge AI fabrics remain concentrated around global merchant and vertically integrated silicon platforms.

Market positionImportant regional market
Growth outlookHighest in market
Demand profileDesign, manufacturing and end-use mix
Market access gateQualification, supply assurance and local channel
Country Position in region Demand mechanism
China Primary China participates through a combination of local demand, system integration, distribution and manufacturing relevant to ethernet switch chips. Its importance depends on the region’s industrial structure rather than a single reported share. Suppliers typically enter through qualified OEM programs, local channel partners or multinational production networks, making technical support and continuity of supply important alongside price.
Japan Secondary Japan participates through a combination of local demand, system integration, distribution and manufacturing relevant to ethernet switch chips. Its importance depends on the region’s industrial structure rather than a single reported share. Suppliers typically enter through qualified OEM programs, local channel partners or multinational production networks, making technical support and continuity of supply important alongside price.
South Korea Secondary South Korea participates through a combination of local demand, system integration, distribution and manufacturing relevant to ethernet switch chips. Its importance depends on the region’s industrial structure rather than a single reported share. Suppliers typically enter through qualified OEM programs, local channel partners or multinational production networks, making technical support and continuity of supply important alongside price.

China market instance

In China, demand is tied to the local mix of manufacturing, infrastructure and end-market investment. The relevant commercial signal is the number of qualified platforms and projects rather than a standalone market-share estimate. Suppliers that align product roadmaps with local OEM qualification, logistics and service requirements can convert regional investment into repeat design wins.

Japan market instance

In Japan, demand is tied to the local mix of manufacturing, infrastructure and end-market investment. The relevant commercial signal is the number of qualified platforms and projects rather than a standalone market-share estimate. Suppliers that align product roadmaps with local OEM qualification, logistics and service requirements can convert regional investment into repeat design wins.

South Korea market instance

In South Korea, demand is tied to the local mix of manufacturing, infrastructure and end-market investment. The relevant commercial signal is the number of qualified platforms and projects rather than a standalone market-share estimate. Suppliers that align product roadmaps with local OEM qualification, logistics and service requirements can convert regional investment into repeat design wins.

The full report provides country-level segmentation for Asia Pacific consistent with the source report scope. This overview focuses on the commercial mechanism that differentiates the region and avoids unsupported share estimates when a verified quantitative figure is not available.

North America LARGEST

Why is North America strategically important in the ethernet switch chips market?

North America leads because the region contains the largest concentration of hyperscale cloud operators, AI infrastructure investment and leading switch-silicon designers. Data-center operators deploy new Ethernet generations early, creating demand for 51.2 Tbps and 102.4 Tbps platforms. The market is therefore innovation-led, with power per bit and congestion management becoming as important as raw bandwidth.

Market positionLargest region
Growth outlookApplication-led growth
Demand profileDesign, manufacturing and end-use mix
Market access gateQualification, supply assurance and local channel
Country Position in region Demand mechanism
United States Primary United States participates through a combination of local demand, system integration, distribution and manufacturing relevant to ethernet switch chips. Its importance depends on the region’s industrial structure rather than a single reported share. Suppliers typically enter through qualified OEM programs, local channel partners or multinational production networks, making technical support and continuity of supply important alongside price.
Canada Secondary Canada participates through a combination of local demand, system integration, distribution and manufacturing relevant to ethernet switch chips. Its importance depends on the region’s industrial structure rather than a single reported share. Suppliers typically enter through qualified OEM programs, local channel partners or multinational production networks, making technical support and continuity of supply important alongside price.
Mexico Secondary Mexico participates through a combination of local demand, system integration, distribution and manufacturing relevant to ethernet switch chips. Its importance depends on the region’s industrial structure rather than a single reported share. Suppliers typically enter through qualified OEM programs, local channel partners or multinational production networks, making technical support and continuity of supply important alongside price.

United States market instance

In United States, demand is tied to the local mix of manufacturing, infrastructure and end-market investment. The relevant commercial signal is the number of qualified platforms and projects rather than a standalone market-share estimate. Suppliers that align product roadmaps with local OEM qualification, logistics and service requirements can convert regional investment into repeat design wins.

Canada market instance

In Canada, demand is tied to the local mix of manufacturing, infrastructure and end-market investment. The relevant commercial signal is the number of qualified platforms and projects rather than a standalone market-share estimate. Suppliers that align product roadmaps with local OEM qualification, logistics and service requirements can convert regional investment into repeat design wins.

Mexico market instance

In Mexico, demand is tied to the local mix of manufacturing, infrastructure and end-market investment. The relevant commercial signal is the number of qualified platforms and projects rather than a standalone market-share estimate. Suppliers that align product roadmaps with local OEM qualification, logistics and service requirements can convert regional investment into repeat design wins.

The full report provides country-level segmentation for North America consistent with the source report scope. This overview focuses on the commercial mechanism that differentiates the region and avoids unsupported share estimates when a verified quantitative figure is not available.

Europe STRATEGIC MARKET

Why is Europe strategically important in the ethernet switch chips market?

Europe has steady demand from enterprise networks, telecom infrastructure, cloud regions and sovereign digital projects. Adoption of the highest-speed switch silicon follows hyperscale deployments but is moderated by a smaller concentration of global cloud headquarters. Energy efficiency is increasingly important because data-center power constraints can influence architecture, giving efficient switching silicon a clear system-level value proposition.

Market positionImportant regional market
Growth outlookApplication-led growth
Demand profileDesign, manufacturing and end-use mix
Market access gateQualification, supply assurance and local channel
Country Position in region Demand mechanism
Germany Primary Germany participates through a combination of local demand, system integration, distribution and manufacturing relevant to ethernet switch chips. Its importance depends on the region’s industrial structure rather than a single reported share. Suppliers typically enter through qualified OEM programs, local channel partners or multinational production networks, making technical support and continuity of supply important alongside price.
France Secondary France participates through a combination of local demand, system integration, distribution and manufacturing relevant to ethernet switch chips. Its importance depends on the region’s industrial structure rather than a single reported share. Suppliers typically enter through qualified OEM programs, local channel partners or multinational production networks, making technical support and continuity of supply important alongside price.
United Kingdom Secondary United Kingdom participates through a combination of local demand, system integration, distribution and manufacturing relevant to ethernet switch chips. Its importance depends on the region’s industrial structure rather than a single reported share. Suppliers typically enter through qualified OEM programs, local channel partners or multinational production networks, making technical support and continuity of supply important alongside price.

Germany market instance

In Germany, demand is tied to the local mix of manufacturing, infrastructure and end-market investment. The relevant commercial signal is the number of qualified platforms and projects rather than a standalone market-share estimate. Suppliers that align product roadmaps with local OEM qualification, logistics and service requirements can convert regional investment into repeat design wins.

France market instance

In France, demand is tied to the local mix of manufacturing, infrastructure and end-market investment. The relevant commercial signal is the number of qualified platforms and projects rather than a standalone market-share estimate. Suppliers that align product roadmaps with local OEM qualification, logistics and service requirements can convert regional investment into repeat design wins.

United Kingdom market instance

In United Kingdom, demand is tied to the local mix of manufacturing, infrastructure and end-market investment. The relevant commercial signal is the number of qualified platforms and projects rather than a standalone market-share estimate. Suppliers that align product roadmaps with local OEM qualification, logistics and service requirements can convert regional investment into repeat design wins.

The full report provides country-level segmentation for Europe consistent with the source report scope. This overview focuses on the commercial mechanism that differentiates the region and avoids unsupported share estimates when a verified quantitative figure is not available.

South America STRATEGIC MARKET

Why is South America strategically important in the ethernet switch chips market?

South America is an emerging Ethernet switching market centered on cloud regions, telecom networks and enterprise modernization, with Brazil as the largest demand center. High-speed silicon enters primarily through imported systems rather than local chip production. Growth follows data-center and connectivity investment, while currency and capital-spending cycles can make deployments less consistent than in North America or Asia.

Market positionImportant regional market
Growth outlookApplication-led growth
Demand profileDesign, manufacturing and end-use mix
Market access gateQualification, supply assurance and local channel
Country Position in region Demand mechanism
Brazil Primary Brazil participates through a combination of local demand, system integration, distribution and manufacturing relevant to ethernet switch chips. Its importance depends on the region’s industrial structure rather than a single reported share. Suppliers typically enter through qualified OEM programs, local channel partners or multinational production networks, making technical support and continuity of supply important alongside price.
Argentina Secondary Argentina participates through a combination of local demand, system integration, distribution and manufacturing relevant to ethernet switch chips. Its importance depends on the region’s industrial structure rather than a single reported share. Suppliers typically enter through qualified OEM programs, local channel partners or multinational production networks, making technical support and continuity of supply important alongside price.
Chile Secondary Chile participates through a combination of local demand, system integration, distribution and manufacturing relevant to ethernet switch chips. Its importance depends on the region’s industrial structure rather than a single reported share. Suppliers typically enter through qualified OEM programs, local channel partners or multinational production networks, making technical support and continuity of supply important alongside price.

Brazil market instance

In Brazil, demand is tied to the local mix of manufacturing, infrastructure and end-market investment. The relevant commercial signal is the number of qualified platforms and projects rather than a standalone market-share estimate. Suppliers that align product roadmaps with local OEM qualification, logistics and service requirements can convert regional investment into repeat design wins.

Argentina market instance

In Argentina, demand is tied to the local mix of manufacturing, infrastructure and end-market investment. The relevant commercial signal is the number of qualified platforms and projects rather than a standalone market-share estimate. Suppliers that align product roadmaps with local OEM qualification, logistics and service requirements can convert regional investment into repeat design wins.

Chile market instance

In Chile, demand is tied to the local mix of manufacturing, infrastructure and end-market investment. The relevant commercial signal is the number of qualified platforms and projects rather than a standalone market-share estimate. Suppliers that align product roadmaps with local OEM qualification, logistics and service requirements can convert regional investment into repeat design wins.

The full report provides country-level segmentation for South America consistent with the source report scope. This overview focuses on the commercial mechanism that differentiates the region and avoids unsupported share estimates when a verified quantitative figure is not available.

Middle East & Africa STRATEGIC MARKET

Why is Middle East & Africa strategically important in the ethernet switch chips market?

Middle East and Africa demand is accelerating from a smaller base as Gulf countries invest in cloud regions, AI infrastructure and national data-center capacity. The region imports nearly all advanced switching silicon through systems and white-box platforms. Large projects can move directly to high-speed Ethernet architectures, creating demand for current-generation merchant silicon without a long legacy transition.

Market positionImportant regional market
Growth outlookApplication-led growth
Demand profileDesign, manufacturing and end-use mix
Market access gateQualification, supply assurance and local channel
Country Position in region Demand mechanism
Saudi Arabia Primary Saudi Arabia participates through a combination of local demand, system integration, distribution and manufacturing relevant to ethernet switch chips. Its importance depends on the region’s industrial structure rather than a single reported share. Suppliers typically enter through qualified OEM programs, local channel partners or multinational production networks, making technical support and continuity of supply important alongside price.
United Arab Emirates Secondary United Arab Emirates participates through a combination of local demand, system integration, distribution and manufacturing relevant to ethernet switch chips. Its importance depends on the region’s industrial structure rather than a single reported share. Suppliers typically enter through qualified OEM programs, local channel partners or multinational production networks, making technical support and continuity of supply important alongside price.
South Africa Secondary South Africa participates through a combination of local demand, system integration, distribution and manufacturing relevant to ethernet switch chips. Its importance depends on the region’s industrial structure rather than a single reported share. Suppliers typically enter through qualified OEM programs, local channel partners or multinational production networks, making technical support and continuity of supply important alongside price.

Saudi Arabia market instance

In Saudi Arabia, demand is tied to the local mix of manufacturing, infrastructure and end-market investment. The relevant commercial signal is the number of qualified platforms and projects rather than a standalone market-share estimate. Suppliers that align product roadmaps with local OEM qualification, logistics and service requirements can convert regional investment into repeat design wins.

United Arab Emirates market instance

In United Arab Emirates, demand is tied to the local mix of manufacturing, infrastructure and end-market investment. The relevant commercial signal is the number of qualified platforms and projects rather than a standalone market-share estimate. Suppliers that align product roadmaps with local OEM qualification, logistics and service requirements can convert regional investment into repeat design wins.

South Africa market instance

In South Africa, demand is tied to the local mix of manufacturing, infrastructure and end-market investment. The relevant commercial signal is the number of qualified platforms and projects rather than a standalone market-share estimate. Suppliers that align product roadmaps with local OEM qualification, logistics and service requirements can convert regional investment into repeat design wins.

The full report provides country-level segmentation for Middle East & Africa consistent with the source report scope. This overview focuses on the commercial mechanism that differentiates the region and avoids unsupported share estimates when a verified quantitative figure is not available.

Competitive Landscape

Competition in the ethernet switch chips market is shaped by qualification, platform depth, manufacturing scale and customer engineering support. The profiled company set includes Broadcom Inc., Cisco Systems, Marvell Technology, Intel Corporation (Fulcrum) and 11 additional companies. The strongest positions are typically built through repeated design wins and lifecycle execution rather than short-term price moves.

Large suppliers compete by offering product roadmaps that allow customers to move across performance tiers without redesigning the entire system. That advantage is reinforced by applications engineering, reference platforms, validation data and global supply. Smaller specialists can still win where customization, fast-turn engineering or niche process capability matters more than breadth, but they face higher customer-acquisition and qualification costs.

Customer concentration differs by application. High-volume platforms can create very large sockets, but they also give buyers pricing leverage and require suppliers to commit capacity years in advance. Lower-volume industrial and specialized applications generate smaller unit demand but can support longer lifecycles and more stable pricing. A balanced customer mix therefore reduces dependence on a single end-market investment cycle.

Competitive tier Positioning
Tier 1: scaled platform suppliers Broadcom Inc., Cisco Systems, Marvell Technology, Intel Corporation (Fulcrum). These companies compete on manufacturing scale, technology roadmaps, global application support and the ability to sustain multi-generation customer programs. Their advantage is strongest where qualification is expensive and customers want a long-term supplier rather than a one-product transaction.
Tier 2: focused specialists Centec Communications, NVIDIA (Mellanox), Realtek Semiconductor, Microchip Technology. These vendors compete through focused engineering, regional responsiveness, specialized technology or attractive economics. They can win niches that are not large enough for every global supplier, but they must prove long-term supply and quality consistency to move into mission-critical programs.
Emerging and regional participants Renesas Electronics, MaxLinear, VITESSE SEMICONDUCTOR (Acquired by Microsemi), EZchip Semiconductor (Acquired by Marvell). These companies expand the competitive set in cost-sensitive or locally sourced applications. Their path to higher-value business depends on certification, reference customers, process maturity and ecosystem compatibility rather than price alone.

Companies profiled in the report

The report profiles the following companies in its stated scope: Broadcom Inc., Cisco Systems, Marvell Technology, Intel Corporation (Fulcrum), Centec Communications, NVIDIA (Mellanox), Realtek Semiconductor, Microchip Technology, Renesas Electronics, MaxLinear, VITESSE SEMICONDUCTOR (Acquired by Microsemi), EZchip Semiconductor (Acquired by Marvell), Innovium (Acquired by Marvell), Barefoot Networks (Acquired by Intel), Shanghai Zhaoxin Semiconductor. The list is preserved from the source page for scope consistency. Competitive interpretation in this overview focuses on defensible supplier roles and does not assign unsupported revenue shares or rankings beyond leadership positions that are directly evidenced.

Production Capacity Analysis

Production capacity for ethernet switch chips is constrained by the manufacturing steps that require the most specialized equipment, process control and qualification. Capacity is not interchangeable across products: a nominally available fab, PCB line or advanced packaging resource may not be qualified for the required materials, geometry, voltage, signal integrity or medical reliability class. The practical supply base is therefore smaller than headline industry capacity suggests.

Capacity expansion creates value only after yields, reliability and customer qualification reach production targets. Suppliers with control over critical upstream steps can respond faster to shortages and technology transitions, while fabless or outsourced models can be more capital efficient but depend on foundry, substrate, packaging or fabrication partners. This trade-off shapes margins, lead times and the speed at which new architectures reach volume.

Advanced switch-chip capacity depends on leading-edge wafer fabrication, large-die yield, high-speed SerDes integration and advanced packaging. Broadcom’s 102.4 Tbps Tomahawk 6 and 51.2 Tbps products from Cisco and Marvell illustrate the scale of integration now required. Each generation raises design, mask, validation and packaging intensity, limiting the number of suppliers that can compete at the frontier.

Market Dynamics

The ethernet switch chips market is expanding because downstream systems demand more performance, efficiency, density, connectivity or reliability from the same physical and power envelope. Growth is balanced by qualification cost, manufacturing complexity and incumbent alternatives. The result is not uniform adoption: premium applications migrate first, while mature segments persist where total system economics do not justify a technology change.

Market Drivers

Primary forces supporting market expansion
Driver Directional impact
AI clusters and east-west bandwidth High — the mechanism directly increases design activity, electronic content or addressable system value without assuming an unsupported percentage contribution to CAGR.
Cloud and hyperscale data-center expansion High — the mechanism directly increases design activity, electronic content or addressable system value without assuming an unsupported percentage contribution to CAGR.
Higher SerDes speeds and port density High — the mechanism directly increases design activity, electronic content or addressable system value without assuming an unsupported percentage contribution to CAGR.
Programmability and telemetry High — the mechanism directly increases design activity, electronic content or addressable system value without assuming an unsupported percentage contribution to CAGR.

AI clusters and east-west bandwidth

AI training creates synchronized traffic between accelerators, making network throughput, latency and congestion behavior critical to cluster efficiency. Ethernet vendors are responding with larger-radix switch ASICs, 800G interfaces and AI-focused load balancing. The commercial implication is a rapid migration toward 51.2 Tbps and 102.4 Tbps switch generations in high-end data centers.

Cloud and hyperscale data-center expansion

Cloud platforms refresh network fabrics continuously to support storage, compute and distributed services. Merchant switch silicon allows system builders to scale port density while maintaining common software. Large cloud operators drive early adoption of new SerDes generations, so their capex cycles influence the revenue timing of leading switch-chip suppliers more than traditional enterprise refresh cycles.

Higher SerDes speeds and port density

Moving from 50G to 100G and 200G SerDes increases aggregate bandwidth without proportionally increasing the number of lanes. This enables 400G, 800G and future 1.6T ports from high-radix chips. Each generation raises signal-integrity, packaging and thermal challenges, increasing the value of advanced process technology and co-designed electrical or optical I/O.

Programmability and telemetry

Modern data-center operators require real-time visibility into congestion, packet loss and flow behavior. Programmable pipelines and in-band telemetry let network software adapt to workload patterns and troubleshoot large fabrics. These capabilities differentiate switch ASICs beyond raw bandwidth and give vendors with mature SDKs, SONiC integration and telemetry ecosystems a stronger platform position.

Market Restraints

Factors limiting adoption, pricing or supply expansion
Restraint Directional impact
Rising design and mask costs Medium to High — the factor can delay qualification, reduce addressable applications or pressure supplier economics, but its magnitude varies by segment and customer architecture.
Power and thermal limits Medium to High — the factor can delay qualification, reduce addressable applications or pressure supplier economics, but its magnitude varies by segment and customer architecture.
Customer concentration Medium to High — the factor can delay qualification, reduce addressable applications or pressure supplier economics, but its magnitude varies by segment and customer architecture.
Long validation and software integration cycles Medium to High — the factor can delay qualification, reduce addressable applications or pressure supplier economics, but its magnitude varies by segment and customer architecture.

Rising design and mask costs

Leading switch ASICs use advanced process nodes, very large die sizes, high-speed SerDes and complex packaging. Each new generation demands major engineering investment before revenue begins. The scale required to recover those costs limits the number of viable suppliers and makes roadmap execution critical, especially when cloud customers can shift demand between merchant and custom silicon.

Power and thermal limits

Switch capacity can double faster than data-center power budgets. Higher SerDes rates, larger buffers and more ports increase thermal density unless power per bit improves. This constrains system design and drives interest in co-packaged optics, advanced cooling and efficient architectures. A chip that misses its power target can lose platform sockets despite competitive throughput.

Customer concentration

The highest-performance switching segment depends heavily on a small number of hyperscale and AI infrastructure buyers. Their procurement decisions, custom-silicon strategies and capex timing can materially affect supplier volumes. This concentration gives customers negotiation leverage and increases revenue volatility compared with broader enterprise markets, even when underlying network traffic continues to grow.

Long validation and software integration cycles

Switch ASIC qualification includes hardware validation, optics interoperability, SDK integration, network operating systems and large-scale traffic testing. Changing silicon vendors can require substantial software and operational work. These switching costs protect incumbents but slow adoption for new entrants, making software ecosystem maturity and field-proven reliability essential competitive barriers.

Market Opportunities

102.4 Tbps merchant switch silicon

Broadcom’s Tomahawk 6 establishes 102.4 Tbps as a commercial generation for scale-up and scale-out AI networks. Doubling switch capacity can reduce network tiers or increase port density, but it also shifts demand toward 200G SerDes and advanced optics. Suppliers that reach volume production early can capture premium AI-fabric sockets.

51.2 Tbps multi-vendor ecosystem

Cisco Silicon One G200 and Marvell Teralynx 10 demonstrate that 51.2 Tbps switching is available from multiple architectural approaches. This gives hyperscalers and OEMs more choice and supports broader adoption of 400G and 800G ports. Competition increasingly centers on latency, programmability, buffers, telemetry, power and software rather than bandwidth alone.

AI-optimized Ethernet

NVIDIA Spectrum-X and other AI Ethernet platforms add adaptive routing, congestion control and telemetry to conventional Ethernet. This creates a new value layer in switching silicon because cluster performance depends on collective communication behavior, not just line rate. Vendors that combine ASIC features with NICs and software can capture more of the networking stack.

Co-packaged optics

Electrical I/O power and signal integrity become harder as switch bandwidth rises. Co-packaged optics moves optical engines closer to the switch ASIC, reducing electrical reach and potentially lowering power. Commercial adoption creates opportunities across switch silicon, optical engines, packaging and thermal management, while also changing how networking systems are serviced and manufactured.

Supply Chain Analysis

Materials and foundational technology
Component / board manufacturing
System integration and qualification
Deployment, service and lifecycle

Materials and foundational technology

The upstream stage supplies the materials, process technology, fabrication equipment and intellectual property that determine what ethernet switch chips products can be manufactured economically. Bottlenecks here can propagate through the chain because downstream suppliers cannot substitute materials or processes freely once a customer platform is qualified. Strategic sourcing and multi-year capacity planning therefore influence both availability and cost.

Component / board manufacturing

Manufacturing converts upstream inputs into qualified products through fabrication, assembly, testing or printed-board processing. Value capture rises with process complexity and yield sensitivity. Suppliers that own differentiated process know-how or have secure access to advanced manufacturing can defend margins, while commodity capacity competes more directly on utilization, yield and purchasing scale.

System integration and qualification

System integrators turn components into usable equipment and carry much of the qualification burden. They validate performance across temperature, power, signal integrity, software, regulatory or reliability conditions depending on the market. Because redesign is expensive, a successful design win can persist for multiple product generations, giving qualified suppliers strong lifecycle value even when unit prices decline.

Deployment, service and lifecycle

Deployment and service create the final feedback loop. Field reliability, software behavior, maintenance requirements and customer support influence whether a supplier remains on the approved list for the next platform. Long-lived applications reward continuity and documentation, while fast-moving data-center or consumer architectures reward roadmap speed. Suppliers that balance both needs can broaden their addressable customer base.

Recent Developments

February 2026

Cisco updated its Silicon One G200 data sheet for a 51.2 Tbps device positioned across AI networking, web-scale, enterprise and service-provider architectures. The product reinforces the move toward common silicon architectures that can address multiple system roles, increasing competition with merchant switching platforms on software integration, power and deployment flexibility.

October 2025

Broadcom announced Tomahawk 6 Davisson, a 102.4 Tbps co-packaged-optics Ethernet switch targeting AI scale-up and scale-out fabrics. The development shows that switch-chip competition is moving beyond electrical port density into optical integration and link stability, as I/O power becomes a central bottleneck for very large accelerator clusters.

June 2025

Broadcom began shipping the Tomahawk 6 switch series at 102.4 Tbps, twice the bandwidth of the prior 51.2 Tbps class. The device supports 100G and 200G SerDes and is positioned for AI networks exceeding one million accelerators, demonstrating how AI demand is compressing the cadence between Ethernet bandwidth generations.

Report Scope & Segmentation

Attribute Scope
Market Ethernet Switch Chips
2025 market size USD 3,502.0 million
2026 estimated size USD 3,670.1 million
2034 projected size USD 5,340.6 million
CAGR 4.8% during 2026–2034
Largest market in 2025 North America
By Type 10G, 25G-40G, 100G, 100G Above
By Application Commercial, Self-Developed, Data Centers, Enterprise Networks
By End User Telecom Providers, Cloud Service Providers, Large Enterprises
Regions Asia Pacific, North America, Europe, South America, Middle East & Africa
Companies profiled Broadcom Inc., Cisco Systems, Marvell Technology, Intel Corporation (Fulcrum), Centec Communications, NVIDIA (Mellanox), Realtek Semiconductor, Microchip Technology, Renesas Electronics, MaxLinear, VITESSE SEMICONDUCTOR (Acquired by Microsemi), EZchip Semiconductor (Acquired by Marvell), Innovium (Acquired by Marvell), Barefoot Networks (Acquired by Intel), Shanghai Zhaoxin Semiconductor

Frequently Asked Questions

What is the Ethernet Switch Chips market size in 2025?

The global ethernet switch chips market is valued at USD 3,502.0 million in 2025. The figure is the rebased base-year point derived from the published market-size anchors on the source report page. It provides the common starting point for the 2026–2034 forecast window and is used consistently throughout the Key Statistics, Market Overview and Report Scope sections.

What is the projected Ethernet Switch Chips market size by 2034?

The market is projected to reach USD 5,340.6 million by 2034. This endpoint follows the annual growth factor implied by the source page’s published value anchors rather than relying on a CAGR label when the label and anchors differ. The resulting series keeps the 2025 base, 2026 estimate and 2034 endpoint mathematically consistent.

What CAGR is expected during 2026–2034?

The ethernet switch chips market is expected to expand at a 4.8% CAGR during 2026–2034. This rate is the compound growth factor that reconciles the 2025 market size of USD 3,502.0 million with the 2034 projected size of USD 5,340.6 million. It is therefore internally consistent with the monetary values used across the full overview.

Which region is the largest Ethernet Switch Chips market in 2025?

North America is the largest regional market in 2025 in this analysis. Its position reflects the region’s combination of end-market demand, manufacturing or design concentration and supplier ecosystem relevant to ethernet switch chips. The overview avoids assigning a regional share unless a reliable quantitative figure is directly supported by a defensible source.

Which region is growing fastest?

Asia Pacific has the strongest structural growth outlook. The region benefits from a favorable combination of new capacity, downstream investment, infrastructure expansion or manufacturing scale depending on the market. Growth is not assumed to be uniform across countries, so supplier opportunity depends on local qualification, channel access and customer-platform exposure.

What are the main product types in the market?

The report segments the market by type into 10G, 25G-40G, 100G, 100G Above. These categories are retained from the source page rather than being renamed or expanded. Their commercial profiles differ because each type addresses a different balance of performance, integration, qualification complexity and cost, which leads to distinct adoption curves across applications.

What are the main applications for ethernet switch chips?

The application scope includes Commercial, Self-Developed, Data Centers, Enterprise Networks. Each application has a different purchasing trigger, ranging from efficiency and power density to reliability, throughput, connectivity or miniaturization. The fastest-growing opportunity is typically where the component enables a new system architecture rather than serving as a direct replacement for a mature incumbent solution.

Who are the key companies profiled?

The source report profiles Broadcom Inc., Cisco Systems, Marvell Technology, Intel Corporation (Fulcrum), Centec Communications, NVIDIA (Mellanox), Realtek Semiconductor, Microchip Technology, Renesas Electronics, MaxLinear, VITESSE SEMICONDUCTOR (Acquired by Microsemi), EZchip Semiconductor (Acquired by Marvell), Innovium (Acquired by Marvell), Barefoot Networks (Acquired by Intel), Shanghai Zhaoxin Semiconductor. The list is preserved for scope consistency. Competitive strength varies by technology and region, so the overview does not assign unsupported market shares to individual companies. Supplier positioning is instead assessed through manufacturing scale, technology roadmap, qualification depth, engineering support and lifecycle execution.

What are the main market drivers?

The main drivers are ai clusters and east-west bandwidth, cloud and hyperscale data-center expansion, higher serdes speeds and port density, programmability and telemetry. These mechanisms increase demand because they raise the value of performance, efficiency, reliability, density or connectivity inside downstream systems. Their commercial impact depends on whether customers can capture enough system-level benefit to justify qualification cost and any component price premium.

What are the principal restraints on market growth?

Growth is restrained by rising design and mask costs, power and thermal limits, customer concentration, long validation and software integration cycles. These factors slow adoption by increasing cost, qualification time, supply risk or customer switching barriers. They do not remove the long-term demand trend, but they determine how quickly newer solutions penetrate price-sensitive and highly regulated applications.

Research Sources & Evidence Base

View research sources used for this overview.
  1. Broadcom. Tomahawk 6 102.4 Tbps switch, 102.4 Tbps single-chip Ethernet switching and AI-network features, June 2025.
  2. Cisco. Silicon One G200 Data Sheet, 51.2 Tbps switching silicon for AI, web-scale, enterprise and service-provider networks.
  3. Marvell. Teralynx 10 Ethernet switch, 25.6 to 51.2 Tbps programmable Ethernet switching for AI cloud.
  4. NVIDIA. Spectrum-X Ethernet Networking Platform, AI-optimized Ethernet switching and SuperNIC architecture.
  5. Official company or regulator source. Development source, October 2025.

Ethernet Switch Chips Market, Trends, Business Strategies 2026-2034

Get Sample Report PDF for Exclusive Insights

Report Sample Includes

  • Table of Contents
  • List of Tables & Figures
  • Charts, Research Methodology, and more...

PDF Icon Download Sample Report PDF
SKU: b70e64283bb3
Category:
Tag:
License Type

Corporate License, Excel License, PDF and Excel Databook License

Download Sample Report

Table of Content

1 Introduction to Research & Analysis Reports
1.1 Ethernet Switch Chips Market Definition
1.2 Market Segments
1.2.1 Segment by Type
1.2.2 Segment by Application
1.3 Global Ethernet Switch Chips Market Overview
1.4 Features & Benefits of This Report
1.5 Methodology & Sources of Information
1.5.1 Research Methodology
1.5.2 Research Process
1.5.3 Base Year
1.5.4 Report Assumptions & Caveats
2 Global Ethernet Switch Chips Overall Market Size
2.1 Global Ethernet Switch Chips Market Size: 2024 VS 2032
2.2 Global Ethernet Switch Chips Market Size, Prospects & Forecasts: 2020-2032
2.3 Global Ethernet Switch Chips Sales: 2020-2032
3 Company Landscape
3.1 Top Ethernet Switch Chips Players in Global Market
3.2 Top Global Ethernet Switch Chips Companies Ranked by Revenue
3.3 Global Ethernet Switch Chips Revenue by Companies
3.4 Global Ethernet Switch Chips Sales by Companies
3.5 Global Ethernet Switch Chips Price by Manufacturer (2020-2025)
3.6 Top 3 and Top 5 Ethernet Switch Chips Companies in Global Market, by Revenue in 2024
3.7 Global Manufacturers Ethernet Switch Chips Product Type
3.8 Tier 1, Tier 2, and Tier 3 Ethernet Switch Chips Players in Global Market
3.8.1 List of Global Tier 1 Ethernet Switch Chips Companies
3.8.2 List of Global Tier 2 and Tier 3 Ethernet Switch Chips Companies
4 Sights by Product
4.1 Overview
4.1.1 Segment by Type – Global Ethernet Switch Chips Market Size Markets, 2024 & 2032
4.1.2 10G
4.1.3 25G-40G
4.1.4 100G
4.1.5 100G Above
4.2 Segment by Type – Global Ethernet Switch Chips Revenue & Forecasts
4.2.1 Segment by Type – Global Ethernet Switch Chips Revenue, 2020-2025
4.2.2 Segment by Type – Global Ethernet Switch Chips Revenue, 2026-2032
4.2.3 Segment by Type – Global Ethernet Switch Chips Revenue Market Share, 2020-2032
4.3 Segment by Type – Global Ethernet Switch Chips Sales & Forecasts
4.3.1 Segment by Type – Global Ethernet Switch Chips Sales, 2020-2025
4.3.2 Segment by Type – Global Ethernet Switch Chips Sales, 2026-2032
4.3.3 Segment by Type – Global Ethernet Switch Chips Sales Market Share, 2020-2032
4.4 Segment by Type – Global Ethernet Switch Chips Price (Manufacturers Selling Prices), 2020-2032
5 Sights by Application
5.1 Overview
5.1.1 Segment by Application – Global Ethernet Switch Chips Market Size, 2024 & 2032
5.1.2 Commercial
5.1.3 Self-Developed
5.2 Segment by Application – Global Ethernet Switch Chips Revenue & Forecasts
5.2.1 Segment by Application – Global Ethernet Switch Chips Revenue, 2020-2025
5.2.2 Segment by Application – Global Ethernet Switch Chips Revenue, 2026-2032
5.2.3 Segment by Application – Global Ethernet Switch Chips Revenue Market Share, 2020-2032
5.3 Segment by Application – Global Ethernet Switch Chips Sales & Forecasts
5.3.1 Segment by Application – Global Ethernet Switch Chips Sales, 2020-2025
5.3.2 Segment by Application – Global Ethernet Switch Chips Sales, 2026-2032
5.3.3 Segment by Application – Global Ethernet Switch Chips Sales Market Share, 2020-2032
5.4 Segment by Application – Global Ethernet Switch Chips Price (Manufacturers Selling Prices), 2020-2032
6 Sights by Region
6.1 By Region – Global Ethernet Switch Chips Market Size, 2024 & 2032
6.2 By Region – Global Ethernet Switch Chips Revenue & Forecasts
6.2.1 By Region – Global Ethernet Switch Chips Revenue, 2020-2025
6.2.2 By Region – Global Ethernet Switch Chips Revenue, 2026-2032
6.2.3 By Region – Global Ethernet Switch Chips Revenue Market Share, 2020-2032
6.3 By Region – Global Ethernet Switch Chips Sales & Forecasts
6.3.1 By Region – Global Ethernet Switch Chips Sales, 2020-2025
6.3.2 By Region – Global Ethernet Switch Chips Sales, 2026-2032
6.3.3 By Region – Global Ethernet Switch Chips Sales Market Share, 2020-2032
6.4 North America
6.4.1 By Country – North America Ethernet Switch Chips Revenue, 2020-2032
6.4.2 By Country – North America Ethernet Switch Chips Sales, 2020-2032
6.4.3 United States Ethernet Switch Chips Market Size, 2020-2032
6.4.4 Canada Ethernet Switch Chips Market Size, 2020-2032
6.4.5 Mexico Ethernet Switch Chips Market Size, 2020-2032
6.5 Europe
6.5.1 By Country – Europe Ethernet Switch Chips Revenue, 2020-2032
6.5.2 By Country – Europe Ethernet Switch Chips Sales, 2020-2032
6.5.3 Germany Ethernet Switch Chips Market Size, 2020-2032
6.5.4 France Ethernet Switch Chips Market Size, 2020-2032
6.5.5 U.K. Ethernet Switch Chips Market Size, 2020-2032
6.5.6 Italy Ethernet Switch Chips Market Size, 2020-2032
6.5.7 Russia Ethernet Switch Chips Market Size, 2020-2032
6.5.8 Nordic Countries Ethernet Switch Chips Market Size, 2020-2032
6.5.9 Benelux Ethernet Switch Chips Market Size, 2020-2032
6.6 Asia
6.6.1 By Region – Asia Ethernet Switch Chips Revenue, 2020-2032
6.6.2 By Region – Asia Ethernet Switch Chips Sales, 2020-2032
6.6.3 China Ethernet Switch Chips Market Size, 2020-2032
6.6.4 Japan Ethernet Switch Chips Market Size, 2020-2032
6.6.5 South Korea Ethernet Switch Chips Market Size, 2020-2032
6.6.6 Southeast Asia Ethernet Switch Chips Market Size, 2020-2032
6.6.7 India Ethernet Switch Chips Market Size, 2020-2032
6.7 South America
6.7.1 By Country – South America Ethernet Switch Chips Revenue, 2020-2032
6.7.2 By Country – South America Ethernet Switch Chips Sales, 2020-2032
6.7.3 Brazil Ethernet Switch Chips Market Size, 2020-2032
6.7.4 Argentina Ethernet Switch Chips Market Size, 2020-2032
6.8 Middle East & Africa
6.8.1 By Country – Middle East & Africa Ethernet Switch Chips Revenue, 2020-2032
6.8.2 By Country – Middle East & Africa Ethernet Switch Chips Sales, 2020-2032
6.8.3 Turkey Ethernet Switch Chips Market Size, 2020-2032
6.8.4 Israel Ethernet Switch Chips Market Size, 2020-2032
6.8.5 Saudi Arabia Ethernet Switch Chips Market Size, 2020-2032
6.8.6 UAE Ethernet Switch Chips Market Size, 2020-2032
7 Manufacturers & Brands Profiles
7.1 Broadcom
7.1.1 Broadcom Company Summary
7.1.2 Broadcom Business Overview
7.1.3 Broadcom Ethernet Switch Chips Major Product Offerings
7.1.4 Broadcom Ethernet Switch Chips Sales and Revenue in Global (2020-2025)
7.1.5 Broadcom Key News & Latest Developments
7.2 Cisco
7.2.1 Cisco Company Summary
7.2.2 Cisco Business Overview
7.2.3 Cisco Ethernet Switch Chips Major Product Offerings
7.2.4 Cisco Ethernet Switch Chips Sales and Revenue in Global (2020-2025)
7.2.5 Cisco Key News & Latest Developments
7.3 Marvell
7.3.1 Marvell Company Summary
7.3.2 Marvell Business Overview
7.3.3 Marvell Ethernet Switch Chips Major Product Offerings
7.3.4 Marvell Ethernet Switch Chips Sales and Revenue in Global (2020-2025)
7.3.5 Marvell Key News & Latest Developments
7.4 Intel (Fulcrum)
7.4.1 Intel (Fulcrum) Company Summary
7.4.2 Intel (Fulcrum) Business Overview
7.4.3 Intel (Fulcrum) Ethernet Switch Chips Major Product Offerings
7.4.4 Intel (Fulcrum) Ethernet Switch Chips Sales and Revenue in Global (2020-2025)
7.4.5 Intel (Fulcrum) Key News & Latest Developments
7.5 Centec Communications
7.5.1 Centec Communications Company Summary
7.5.2 Centec Communications Business Overview
7.5.3 Centec Communications Ethernet Switch Chips Major Product Offerings
7.5.4 Centec Communications Ethernet Switch Chips Sales and Revenue in Global (2020-2025)
7.5.5 Centec Communications Key News & Latest Developments
8 Global Ethernet Switch Chips Production Capacity, Analysis
8.1 Global Ethernet Switch Chips Production Capacity, 2020-2032
8.2 Ethernet Switch Chips Production Capacity of Key Manufacturers in Global Market
8.3 Global Ethernet Switch Chips Production by Region
9 Key Market Trends, Opportunity, Drivers and Restraints
9.1 Market Opportunities & Trends
9.2 Market Drivers
9.3 Market Restraints
10 Ethernet Switch Chips Supply Chain Analysis
10.1 Ethernet Switch Chips Industry Value Chain
10.2 Ethernet Switch Chips Upstream Market
10.3 Ethernet Switch Chips Downstream and Clients
10.4 Marketing Channels Analysis
10.4.1 Marketing Channels
10.4.2 Ethernet Switch Chips Distributors and Sales Agents in Global
11 Conclusion
12 Appendix
12.1 Note
12.2 Examples of Clients
12.3 DisclaimerList of Tables
Table 1. Key Players of Ethernet Switch Chips in Global Market
Table 2. Top Ethernet Switch Chips Players in Global Market, Ranking by Revenue (2024)
Table 3. Global Ethernet Switch Chips Revenue by Companies, (US$, Mn), 2020-2025
Table 4. Global Ethernet Switch Chips Revenue Share by Companies, 2020-2025
Table 5. Global Ethernet Switch Chips Sales by Companies, (K Pcs), 2020-2025
Table 6. Global Ethernet Switch Chips Sales Share by Companies, 2020-2025
Table 7. Key Manufacturers Ethernet Switch Chips Price (2020-2025) & (US$/Pcs)
Table 8. Global Manufacturers Ethernet Switch Chips Product Type
Table 9. List of Global Tier 1 Ethernet Switch Chips Companies, Revenue (US$, Mn) in 2024 and Market Share
Table 10. List of Global Tier 2 and Tier 3 Ethernet Switch Chips Companies, Revenue (US$, Mn) in 2024 and Market Share
Table 11. Segment by Type – Global Ethernet Switch Chips Revenue, (US$, Mn), 2024 & 2032
Table 12. Segment by Type – Global Ethernet Switch Chips Revenue (US$, Mn), 2020-2025
Table 13. Segment by Type – Global Ethernet Switch Chips Revenue (US$, Mn), 2026-2032
Table 14. Segment by Type – Global Ethernet Switch Chips Sales (K Pcs), 2020-2025
Table 15. Segment by Type – Global Ethernet Switch Chips Sales (K Pcs), 2026-2032
Table 16. Segment by Application – Global Ethernet Switch Chips Revenue, (US$, Mn), 2024 & 2032
Table 17. Segment by Application – Global Ethernet Switch Chips Revenue, (US$, Mn), 2020-2025
Table 18. Segment by Application – Global Ethernet Switch Chips Revenue, (US$, Mn), 2026-2032
Table 19. Segment by Application – Global Ethernet Switch Chips Sales, (K Pcs), 2020-2025
Table 20. Segment by Application – Global Ethernet Switch Chips Sales, (K Pcs), 2026-2032
Table 21. By Region – Global Ethernet Switch Chips Revenue, (US$, Mn), 2025-2032
Table 22. By Region – Global Ethernet Switch Chips Revenue, (US$, Mn), 2020-2025
Table 23. By Region – Global Ethernet Switch Chips Revenue, (US$, Mn), 2026-2032
Table 24. By Region – Global Ethernet Switch Chips Sales, (K Pcs), 2020-2025
Table 25. By Region – Global Ethernet Switch Chips Sales, (K Pcs), 2026-2032
Table 26. By Country – North America Ethernet Switch Chips Revenue, (US$, Mn), 2020-2025
Table 27. By Country – North America Ethernet Switch Chips Revenue, (US$, Mn), 2026-2032
Table 28. By Country – North America Ethernet Switch Chips Sales, (K Pcs), 2020-2025
Table 29. By Country – North America Ethernet Switch Chips Sales, (K Pcs), 2026-2032
Table 30. By Country – Europe Ethernet Switch Chips Revenue, (US$, Mn), 2020-2025
Table 31. By Country – Europe Ethernet Switch Chips Revenue, (US$, Mn), 2026-2032
Table 32. By Country – Europe Ethernet Switch Chips Sales, (K Pcs), 2020-2025
Table 33. By Country – Europe Ethernet Switch Chips Sales, (K Pcs), 2026-2032
Table 34. By Region – Asia Ethernet Switch Chips Revenue, (US$, Mn), 2020-2025
Table 35. By Region – Asia Ethernet Switch Chips Revenue, (US$, Mn), 2026-2032
Table 36. By Region – Asia Ethernet Switch Chips Sales, (K Pcs), 2020-2025
Table 37. By Region – Asia Ethernet Switch Chips Sales, (K Pcs), 2026-2032
Table 38. By Country – South America Ethernet Switch Chips Revenue, (US$, Mn), 2020-2025
Table 39. By Country – South America Ethernet Switch Chips Revenue, (US$, Mn), 2026-2032
Table 40. By Country – South America Ethernet Switch Chips Sales, (K Pcs), 2020-2025
Table 41. By Country – South America Ethernet Switch Chips Sales, (K Pcs), 2026-2032
Table 42. By Country – Middle East & Africa Ethernet Switch Chips Revenue, (US$, Mn), 2020-2025
Table 43. By Country – Middle East & Africa Ethernet Switch Chips Revenue, (US$, Mn), 2026-2032
Table 44. By Country – Middle East & Africa Ethernet Switch Chips Sales, (K Pcs), 2020-2025
Table 45. By Country – Middle East & Africa Ethernet Switch Chips Sales, (K Pcs), 2026-2032
Table 46. Broadcom Company Summary
Table 47. Broadcom Ethernet Switch Chips Product Offerings
Table 48. Broadcom Ethernet Switch Chips Sales (K Pcs), Revenue (US$, Mn) and Average Price (US$/Pcs) & (2020-2025)
Table 49. Broadcom Key News & Latest Developments
Table 50. Cisco Company Summary
Table 51. Cisco Ethernet Switch Chips Product Offerings
Table 52. Cisco Ethernet Switch Chips Sales (K Pcs), Revenue (US$, Mn) and Average Price (US$/Pcs) & (2020-2025)
Table 53. Cisco Key News & Latest Developments
Table 54. Marvell Company Summary
Table 55. Marvell Ethernet Switch Chips Product Offerings
Table 56. Marvell Ethernet Switch Chips Sales (K Pcs), Revenue (US$, Mn) and Average Price (US$/Pcs) & (2020-2025)
Table 57. Marvell Key News & Latest Developments
Table 58. Intel (Fulcrum) Company Summary
Table 59. Intel (Fulcrum) Ethernet Switch Chips Product Offerings
Table 60. Intel (Fulcrum) Ethernet Switch Chips Sales (K Pcs), Revenue (US$, Mn) and Average Price (US$/Pcs) & (2020-2025)
Table 61. Intel (Fulcrum) Key News & Latest Developments
Table 62. Centec Communications Company Summary
Table 63. Centec Communications Ethernet Switch Chips Product Offerings
Table 64. Centec Communications Ethernet Switch Chips Sales (K Pcs), Revenue (US$, Mn) and Average Price (US$/Pcs) & (2020-2025)
Table 65. Centec Communications Key News & Latest Developments
Table 66. Ethernet Switch Chips Capacity of Key Manufacturers in Global Market, 2023-2025 (K Pcs)
Table 67. Global Ethernet Switch Chips Capacity Market Share of Key Manufacturers, 2023-2025
Table 68. Global Ethernet Switch Chips Production by Region, 2020-2025 (K Pcs)
Table 69. Global Ethernet Switch Chips Production by Region, 2026-2032 (K Pcs)
Table 70. Ethernet Switch Chips Market Opportunities & Trends in Global Market
Table 71. Ethernet Switch Chips Market Drivers in Global Market
Table 72. Ethernet Switch Chips Market Restraints in Global Market
Table 73. Ethernet Switch Chips Raw Materials
Table 74. Ethernet Switch Chips Raw Materials Suppliers in Global Market
Table 75. Typical Ethernet Switch Chips Downstream
Table 76. Ethernet Switch Chips Downstream Clients in Global Market
Table 77. Ethernet Switch Chips Distributors and Sales Agents in Global Market

List of Figures
Figure 1. Ethernet Switch Chips Product Picture
Figure 2. Ethernet Switch Chips Segment by Type in 2024
Figure 3. Ethernet Switch Chips Segment by Application in 2024
Figure 4. Global Ethernet Switch Chips Market Overview: 2024
Figure 5. Key Caveats
Figure 6. Global Ethernet Switch Chips Market Size: 2024 VS 2032 (US$, Mn)
Figure 7. Global Ethernet Switch Chips Revenue: 2020-2032 (US$, Mn)
Figure 8. Ethernet Switch Chips Sales in Global Market: 2020-2032 (K Pcs)
Figure 9. The Top 3 and 5 Players Market Share by Ethernet Switch Chips Revenue in 2024
Figure 10. Segment by Type – Global Ethernet Switch Chips Revenue, (US$, Mn), 2024 & 2032
Figure 11. Segment by Type – Global Ethernet Switch Chips Revenue Market Share, 2020-2032
Figure 12. Segment by Type – Global Ethernet Switch Chips Sales Market Share, 2020-2032
Figure 13. Segment by Type – Global Ethernet Switch Chips Price (US$/Pcs), 2020-2032
Figure 14. Segment by Application – Global Ethernet Switch Chips Revenue, (US$, Mn), 2024 & 2032
Figure 15. Segment by Application – Global Ethernet Switch Chips Revenue Market Share, 2020-2032
Figure 16. Segment by Application – Global Ethernet Switch Chips Sales Market Share, 2020-2032
Figure 17. Segment by Application -Global Ethernet Switch Chips Price (US$/Pcs), 2020-2032
Figure 18. By Region – Global Ethernet Switch Chips Revenue, (US$, Mn), 2025 & 2032
Figure 19. By Region – Global Ethernet Switch Chips Revenue Market Share, 2020 VS 2024 VS 2032
Figure 20. By Region – Global Ethernet Switch Chips Revenue Market Share, 2020-2032
Figure 21. By Region – Global Ethernet Switch Chips Sales Market Share, 2020-2032
Figure 22. By Country – North America Ethernet Switch Chips Revenue Market Share, 2020-2032
Figure 23. By Country – North America Ethernet Switch Chips Sales Market Share, 2020-2032
Figure 24. United States Ethernet Switch Chips Revenue, (US$, Mn), 2020-2032
Figure 25. Canada Ethernet Switch Chips Revenue, (US$, Mn), 2020-2032
Figure 26. Mexico Ethernet Switch Chips Revenue, (US$, Mn), 2020-2032
Figure 27. By Country – Europe Ethernet Switch Chips Revenue Market Share, 2020-2032
Figure 28. By Country – Europe Ethernet Switch Chips Sales Market Share, 2020-2032
Figure 29. Germany Ethernet Switch Chips Revenue, (US$, Mn), 2020-2032
Figure 30. France Ethernet Switch Chips Revenue, (US$, Mn), 2020-2032
Figure 31. U.K. Ethernet Switch Chips Revenue, (US$, Mn), 2020-2032
Figure 32. Italy Ethernet Switch Chips Revenue, (US$, Mn), 2020-2032
Figure 33. Russia Ethernet Switch Chips Revenue, (US$, Mn), 2020-2032
Figure 34. Nordic Countries Ethernet Switch Chips Revenue, (US$, Mn), 2020-2032
Figure 35. Benelux Ethernet Switch Chips Revenue, (US$, Mn), 2020-2032
Figure 36. By Region – Asia Ethernet Switch Chips Revenue Market Share, 2020-2032
Figure 37. By Region – Asia Ethernet Switch Chips Sales Market Share, 2020-2032
Figure 38. China Ethernet Switch Chips Revenue, (US$, Mn), 2020-2032
Figure 39. Japan Ethernet Switch Chips Revenue, (US$, Mn), 2020-2032
Figure 40. South Korea Ethernet Switch Chips Revenue, (US$, Mn), 2020-2032
Figure 41. Southeast Asia Ethernet Switch Chips Revenue, (US$, Mn), 2020-2032
Figure 42. India Ethernet Switch Chips Revenue, (US$, Mn), 2020-2032
Figure 43. By Country – South America Ethernet Switch Chips Revenue Market Share, 2020-2032
Figure 44. By Country – South America Ethernet Switch Chips Sales, Market Share, 2020-2032
Figure 45. Brazil Ethernet Switch Chips Revenue, (US$, Mn), 2020-2032
Figure 46. Argentina Ethernet Switch Chips Revenue, (US$, Mn), 2020-2032
Figure 47. By Country – Middle East & Africa Ethernet Switch Chips Revenue, Market Share, 2020-2032
Figure 48. By Country – Middle East & Africa Ethernet Switch Chips Sales, Market Share, 2020-2032
Figure 49. Turkey Ethernet Switch Chips Revenue, (US$, Mn), 2020-2032
Figure 50. Israel Ethernet Switch Chips Revenue, (US$, Mn), 2020-2032
Figure 51. Saudi Arabia Ethernet Switch Chips Revenue, (US$, Mn), 2020-2032
Figure 52. UAE Ethernet Switch Chips Revenue, (US$, Mn), 2020-2032
Figure 53. Global Ethernet Switch Chips Production Capacity (K Pcs), 2020-2032
Figure 54. The Percentage of Production Ethernet Switch Chips by Region, 2024 VS 2032
Figure 55. Ethernet Switch Chips Industry Value Chain
Figure 56. Marketing Channels