Electronic Total Station Market, Trends, Business Strategies 2026-2033

Electronic Total Station Market was valued at USD 1.2 billion in 2025 and is projected to reach USD 1.8 billion by 2033, exhibiting a CAGR of 5.3% during the forecast period.

PDF Icon Download Sample Report PDF
  • Quick Dispatch

    All Orders

  • Secure Payment

    100% Secure Payment

Price range: $1,500.00 through $4,250.00

Clear

Market Insights

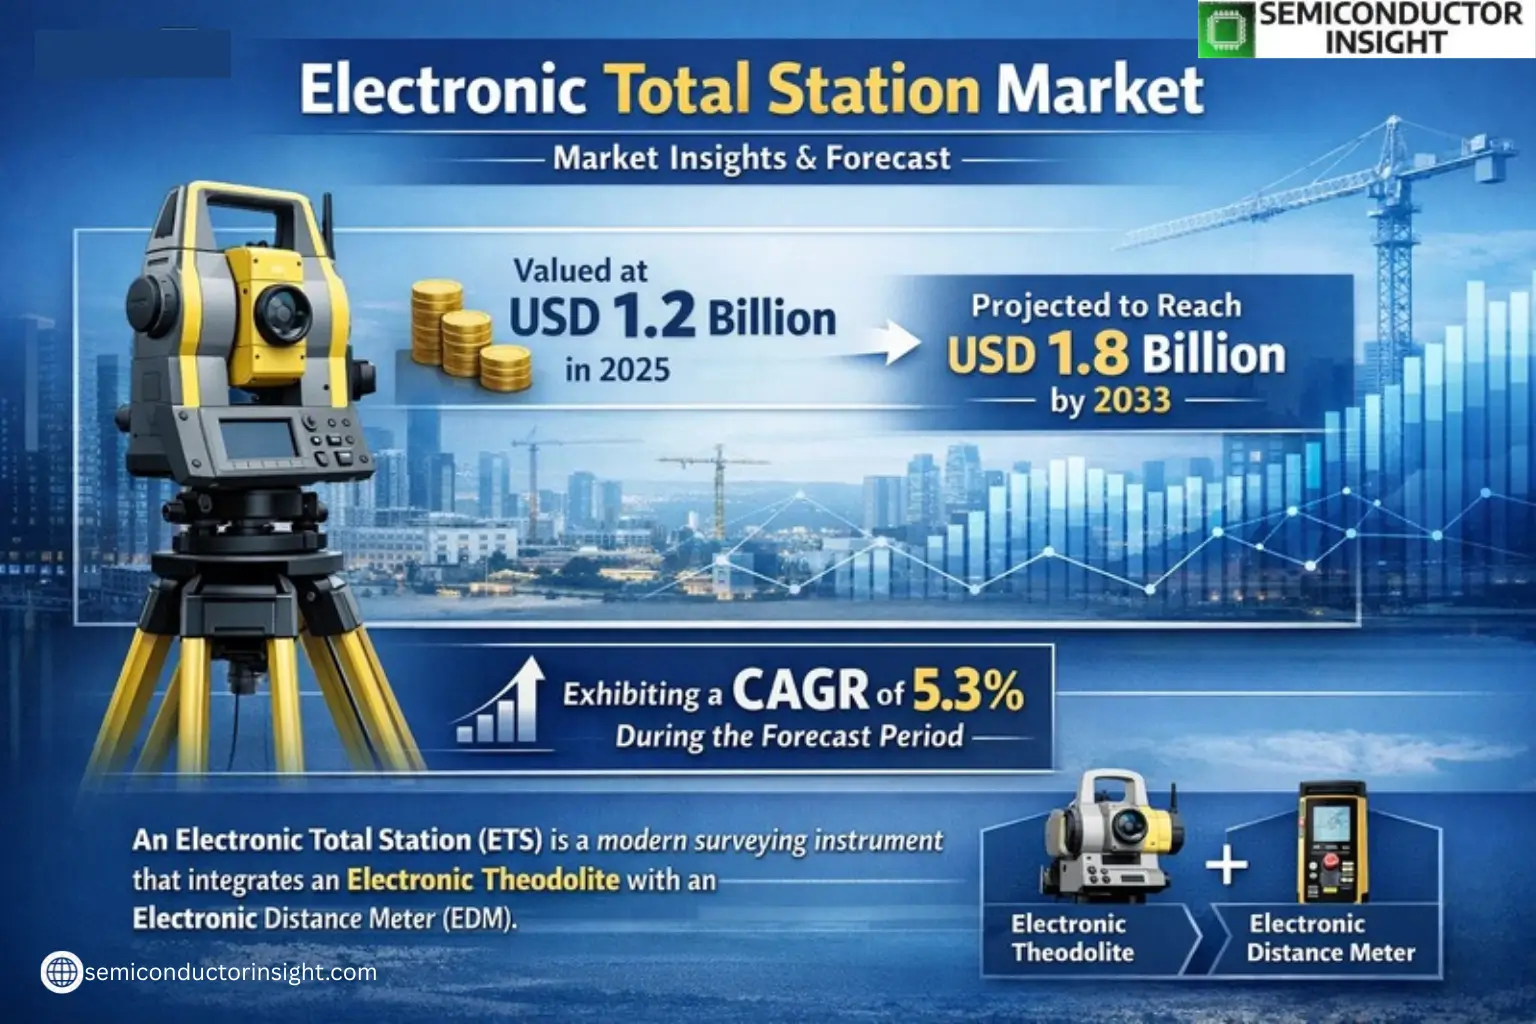
Global Electronic Total Station Market was valued at USD 1.2 billion in 2025 and is projected to reach USD 1.8 billion by 2033, exhibiting a CAGR of 5.3% during the forecast period.

An electronic total station (ETS) is a modern surveying instrument that integrates an electronic theodolite with an electronic distance meter (EDM). It is widely used for precise measurements of distances, angles, and elevations in construction, civil engineering, and land surveying applications. The device enhances efficiency by automating data collection and reducing human error.

The market growth is driven by increasing infrastructure development projects worldwide, particularly in emerging economies. Governments are investing heavily in smart cities and transportation networks, boosting demand for high-precision surveying tools. However, the high cost of advanced ETS systems remains a barrier for small-scale contractors. Key players like Leica Geosystems (Hexagon), Topcon Corporation, and Trimble Inc. dominate the market with continuous innovations such as robotic total stations and cloud-based data integration.

Xyz market size & forecast

MARKET DRIVERS

Growing Infrastructure Development Projects

The increasing demand for Electronic Total Station Market is primarily driven by rapid urbanization and large-scale infrastructure development projects worldwide. Governments are investing heavily in smart cities, highways, and transportation networks, requiring precise measurement tools like electronic total stations for accurate land surveying and construction planning.

Technological Advancements in Surveying Equipment

Modern electronic total stations now integrate advanced features such as robotic operation, 3D scanning, and GNSS compatibility. These innovations significantly improve efficiency in the Electronic Total Station Market, reducing human error and speeding up project timelines while maintaining high precision standards.

Furthermore, the mining industry’s expansion into remote locations has created additional demand for rugged, high-precision electronic total stations capable of operating in challenging environments.

MARKET CHALLENGES

High Initial Investment Costs

Electronic Total Station Market faces challenges from the substantial capital investment required for premium models with advanced functionalities. Many small and medium-sized surveying firms find it difficult to justify the cost, especially when competing with lower-priced alternatives.

Other Challenges

Technical Skill Requirements
Operating electronic total stations requires specialized training, creating a skills gap that limits market penetration in developing regions where professional surveyors are scarce.

MARKET RESTRAINTS

Competition from Alternative Technologies

Electronic Total Station Market faces competition from emerging technologies like UAV-based photogrammetry and mobile mapping systems that offer faster data collection for certain applications. However, electronic total stations maintain an advantage in situations requiring millimeter-level precision.

MARKET OPPORTUNITIES

Integration with BIM and IoT Platforms

Electronic Total Station Market has significant growth potential through integration with Building Information Modeling (BIM) systems and IoT networks. This convergence enables real-time data sharing and collaborative workflows across construction projects, driving demand for smart survey equipment with cloud connectivity.
Electronic Total Station Market Trends

Steady Growth in Surveying Technology Adoption

Global Electronic Total Station Market was valued at USD XX million in 2025 and is projected to reach USD XX million by 2033, growing at a CAGR of X.X%. This growth is driven by increasing infrastructure development projects worldwide and the need for precise measurement solutions in construction and surveying applications. The market shows particular strength in Asia-Pacific regions, where rapid urbanization demands efficient land measurement tools.

Other Trends

Dominance of 2″ Accuracy Segment

Products with 2″ angle measurement accuracy currently hold over 65% market share, being the preferred choice for most construction and surveying applications. These units balance precision with operational efficiency, making them ideal for large-scale projects where both accuracy and speed are critical factors.

Increasing Demand for Underground Applications

While large-scale ground construction remains the leading application for Electronic Total Stations, underground tunnel construction is emerging as a significant growth segment. The technology’s ability to provide accurate measurements in confined spaces makes it invaluable for subway systems, mining operations, and other subterranean construction projects. Precision engineering surveying and deformation monitoring applications are also gaining traction in structural health monitoring.

Market Concentration and Regional Dynamics

Five manufacturers currently dominate over 80% of the Chinese Electronic Total Station Market, with SOUTH, FOIF, and TJOP being key players. Globally, Leica, Topcon, and Trimble lead the competitive landscape. North America and Europe maintain steady demand for high-precision units, while developing regions show preference for more cost-effective models.

COMPETITIVE LANDSCAPE

Key Industry Players

Leica and Trimble Lead the Global Electronic Total Station Market

Global Electronic Total Station Market is dominated by established surveying equipment manufacturers, with Leica Geosystems (Hexagon AB) and Trimble Navigation leading in technological innovation and market share. These companies hold approximately 30% combined market share, offering high-precision instruments with robotic functionality and advanced data integration capabilities. The market exhibits an oligopolistic structure in developed regions, while Chinese manufacturers like SOUTH Group and FOIF control over 80% of the domestic China market through competitive pricing strategies.

Niche players such as Topcon Corporation and South Surveying & Mapping Instrument focus on specialized applications including tunneling monitoring and smart construction. Emerging manufacturers from Asia-Pacific, particularly Korea’s Kolida and Japan’s Sokkia, are gaining traction through cost-effective alternatives with 2″ accuracy, which accounts for 65% of total shipments. The competitive landscape is evolving with increasing R&D investments in automated tracking and BIM integration features across all tiers of manufacturers.

List of Key Electronic Total Station Companies Profiled

Segment Analysis:

Segment Category Sub-Segments Key Insights
By Type
  • 2″ Accuracy Models
  • 1″ Accuracy Models
  • Greater than 2″ Models
2″ Accuracy Models dominate the market due to:

  • Optimal balance between precision and affordability for most surveying tasks
  • Wide adoption in standard construction and engineering projects
  • Compatibility with existing workflows in majority of surveying firms
By Application
  • Large-Scale Ground Construction
  • Underground Tunnel Construction
  • Precision Engineering Surveying
  • Deformation Monitoring
Large-Scale Ground Construction applications show strongest demand because:

  • Critical need for accurate site layout and as-built verification in major projects
  • Government infrastructure investments driving market growth
  • Integration with BIM workflows increases efficiency on construction sites
By End User
  • Construction Firms
  • Surveying Companies
  • Government Agencies
  • Engineering Consultants
Construction Firms represent the core customer segment due to:

  • High equipment utilization rates in ongoing projects
  • Replacement cycles driven by technology upgrades
  • Need for certified measurements in regulatory compliance
By Technology
  • Robotic Total Stations
  • Manual Total Stations
  • Scanning Total Stations
Robotic Total Stations are gaining strong adoption because:

  • Operator efficiency improvements with one-person operation capability
  • Integration with GNSS systems for hybrid surveying solutions
  • Improved safety in hazardous work environments
By Distribution Channel
  • Direct Sales
  • Dealer Networks
  • Online Platforms
Dealer Networks remain the preferred channel due to:

  • Need for technical support and after-sales service
  • Equipment demonstration requirements before purchase
  • Access to training programs and certification courses

Regional Analysis: Electronic Total Station Market

Asia-Pacific

The Asia-Pacific region dominates the electronic total station market, driven by rapid infrastructure development across emerging economies. China and India account for substantial demand due to massive construction projects and government-led urban development initiatives. Japan and South Korea contribute significant technological advancements with high-precision equipment for civil engineering applications. Regional manufacturers benefit from cost-competitive production capabilities while maintaining quality standards comparable to Western counterparts. The growing adoption of smart city projects and transportation infrastructure modernization provides sustained growth opportunities. Surveying professionals in the region increasingly prefer electronic total stations over traditional equipment for their accuracy in large-scale land development projects. Local players continue to innovate with integrated GNSS capabilities to serve diverse topographic surveying requirements.

Construction Boom Drivers
China’s Belt and Road Initiative and India’s Smart Cities Mission generate unprecedented demand for electronic total stations in civil construction and urban planning applications, creating long-term market expansion opportunities.
Technological Leadership
Japanese manufacturers lead in robotics integration and automated measurement technologies, while South Korean firms specialize in ruggedized designs for complex terrain applications across the region’s diverse geography.
Local Production Advantages
Regional production hubs in China and Southeast Asia offer cost-effective manufacturing while maintaining precision engineering standards, enabling competitive pricing strategies against international brands in developing markets.
Surveying Practices Shift
Traditional surveying methods are rapidly being replaced across ASEAN countries as infrastructure projects require higher accuracy and digital data integration capabilities offered by modern electronic total stations.

North America
The North American electronic total station market features strong adoption in transportation and energy infrastructure projects, with particular emphasis on pipeline monitoring and railway construction. U.S. firms lead in software integration capabilities, combining total stations with BIM and GIS platforms. Canadian mining operations drive demand for ruggedized models capable of functioning in extreme weather conditions. The region showcases high preference for robotic total stations that enable single-operator functionality across construction sites.

Europe
European markets demonstrate sophisticated adoption patterns with strict accuracy requirements for archaeological and heritage conservation projects. Germany and France lead in manufacturing high-precision instruments for engineering applications. Scandinavian countries show growing demand for automated monitoring systems in renewable energy projects. EU infrastructure funding programs continue to support steady demand for surveying equipment across transportation and urban development sectors.

Middle East & Africa
Gulf Cooperation Council countries drive regional demand through mega construction projects and urban development initiatives. African markets show emerging potential with increasing mining exploration activities and basic infrastructure projects. The region presents opportunities for entry-level electronic total station models alongside premium solutions for large-scale development projects in oil-rich nations.

South America
Brazil and Chile represent key markets with significant activity in mining and agricultural land development applications. Government infrastructure programs foster steady demand, though economic volatility occasionally impacts equipment purchasing cycles. Regional preferences lean toward multifunctional electronic total stations that serve both construction and topographic surveying requirements.

Report Scope

This market research report provides a comprehensive analysis of the Electronic Total Station Market , covering the forecast period 2025–2033. It offers detailed insights into market dynamics, technological advancements, competitive landscape, and key trends shaping the industry.

Key focus areas of the report include:

  • Market Overview: The report begins with an overview outlining its current market scenario, key growth indicators, and industry transformation drivers. It discusses macroeconomic factors, demand–supply balance, regulatory landscape, and the strategic role of electronic total stations in surveying and construction sectors.
  • Market Size & Forecast: Historical data and future projections for revenue, unit shipments, and market value across major regions and segments.
  • Segmentation Analysis: Detailed breakdown by angle measurement accuracy (1″, 2″, >2″), application (construction, tunneling, engineering), and end-user industry to identify high-growth segments.
  • Regional Insights: Insights into market performance across North America, Europe, Asia, South America, and Middle East & Africa, including country-level analysis where relevant.
  • Competitive Landscape: Profiles of leading market participants, including their product offerings, market share, manufacturing capacity, and recent developments.
  • Technology Trends & Innovation: Assessment of emerging integration of electronic distance measurement and optical surveying technologies.
  • Market Drivers & Restraints: Evaluation of factors driving market growth along with challenges in the surveying equipment industry.
  • Stakeholder Insights: Insights for equipment manufacturers, construction firms, surveyors, and investors regarding market opportunities.

Primary and secondary research methods are employed, including interviews with industry experts and data from verified sources to ensure accuracy.

FREQUENTLY ASKED QUESTIONS:

What is the current market size of Electronic Total Station Market?

-> Electronic Total Station Market was valued at USD 1.2 billion in 2025 and is projected to reach USD 1.8 billion by 2033, exhibiting a CAGR of 5.3% during the forecast period.

Which key companies operate in Electronic Total Station Market?

-> Key players include SOUTH, FOIF, TJOP, DAD, BOIF, Leica, Topcon, and Trimble. The top five manufacturers hold over 80% market share.

What are the key growth drivers?

-> Key growth drivers include increased construction activities, infrastructure development, and demand for precise surveying equipment.

Which region dominates the market?

-> Asia dominates the market, with China being the largest producer and consumer of electronic total stations.

What are the emerging trends?

-> Emerging trends include development of high-precision instruments, integration with digital technologies, and automation in surveying.

Electronic Total Station Market, Trends, Business Strategies 2026-2033

Get Sample Report PDF for Exclusive Insights

Report Sample Includes

  • Table of Contents
  • List of Tables & Figures
  • Charts, Research Methodology, and more...
PDF Icon Download Sample Report PDF
SKU: b282aab1aea4
Category:
License Type

Corporate License, Excel License, PDF and Excel Databook License

Download Sample Report

Table of Content

1 Introduction to Research & Analysis Reports
1.1 Electronic Total Station Market Definition
1.2 Market Segments
1.2.1 Segment by Angle Measurement Accuracy
1.2.2 Segment by Application
1.3 Global Electronic Total Station Market Overview
1.4 Features & Benefits of This Report
1.5 Methodology & Sources of Information
1.5.1 Research Methodology
1.5.2 Research Process
1.5.3 Base Year
1.5.4 Report Assumptions & Caveats
2 Global Electronic Total Station Overall Market Size
2.1 Global Electronic Total Station Market Size: 2024 VS 2032
2.2 Global Electronic Total Station Market Size, Prospects & Forecasts: 2020-2032
2.3 Global Electronic Total Station Sales: 2020-2032
3 Company Landscape
3.1 Top Electronic Total Station Players in Global Market
3.2 Top Global Electronic Total Station Companies Ranked by Revenue
3.3 Global Electronic Total Station Revenue by Companies
3.4 Global Electronic Total Station Sales by Companies
3.5 Global Electronic Total Station Price by Manufacturer (2020-2025)
3.6 Top 3 and Top 5 Electronic Total Station Companies in Global Market, by Revenue in 2024
3.7 Global Manufacturers Electronic Total Station Product Type
3.8 Tier 1, Tier 2, and Tier 3 Electronic Total Station Players in Global Market
3.8.1 List of Global Tier 1 Electronic Total Station Companies
3.8.2 List of Global Tier 2 and Tier 3 Electronic Total Station Companies
4 Sights by Product
4.1 Overview
4.1.1 Segment by Angle Measurement Accuracy – Global Electronic Total Station Market Size Markets, 2024 & 2032
4.1.2 ?1″
4.1.3 2″
4.1.4 ?2″
4.2 Segment by Angle Measurement Accuracy – Global Electronic Total Station Revenue & Forecasts
4.2.1 Segment by Angle Measurement Accuracy – Global Electronic Total Station Revenue, 2020-2025
4.2.2 Segment by Angle Measurement Accuracy – Global Electronic Total Station Revenue, 2026-2032
4.2.3 Segment by Angle Measurement Accuracy – Global Electronic Total Station Revenue Market Share, 2020-2032
4.3 Segment by Angle Measurement Accuracy – Global Electronic Total Station Sales & Forecasts
4.3.1 Segment by Angle Measurement Accuracy – Global Electronic Total Station Sales, 2020-2025
4.3.2 Segment by Angle Measurement Accuracy – Global Electronic Total Station Sales, 2026-2032
4.3.3 Segment by Angle Measurement Accuracy – Global Electronic Total Station Sales Market Share, 2020-2032
4.4 Segment by Angle Measurement Accuracy – Global Electronic Total Station Price (Manufacturers Selling Prices), 2020-2032
5 Sights by Application
5.1 Overview
5.1.1 Segment by Application – Global Electronic Total Station Market Size, 2024 & 2032
5.1.2 Large-Scale Construction On the Ground
5.1.3 Underground Tunnel Construction
5.1.4 Precision Engineering Surveying
5.1.5 Deformation Monitoring
5.2 Segment by Application – Global Electronic Total Station Revenue & Forecasts
5.2.1 Segment by Application – Global Electronic Total Station Revenue, 2020-2025
5.2.2 Segment by Application – Global Electronic Total Station Revenue, 2026-2032
5.2.3 Segment by Application – Global Electronic Total Station Revenue Market Share, 2020-2032
5.3 Segment by Application – Global Electronic Total Station Sales & Forecasts
5.3.1 Segment by Application – Global Electronic Total Station Sales, 2020-2025
5.3.2 Segment by Application – Global Electronic Total Station Sales, 2026-2032
5.3.3 Segment by Application – Global Electronic Total Station Sales Market Share, 2020-2032
5.4 Segment by Application – Global Electronic Total Station Price (Manufacturers Selling Prices), 2020-2032
6 Sights by Region
6.1 By Region – Global Electronic Total Station Market Size, 2024 & 2032
6.2 By Region – Global Electronic Total Station Revenue & Forecasts
6.2.1 By Region – Global Electronic Total Station Revenue, 2020-2025
6.2.2 By Region – Global Electronic Total Station Revenue, 2026-2032
6.2.3 By Region – Global Electronic Total Station Revenue Market Share, 2020-2032
6.3 By Region – Global Electronic Total Station Sales & Forecasts
6.3.1 By Region – Global Electronic Total Station Sales, 2020-2025
6.3.2 By Region – Global Electronic Total Station Sales, 2026-2032
6.3.3 By Region – Global Electronic Total Station Sales Market Share, 2020-2032
6.4 North America
6.4.1 By Country – North America Electronic Total Station Revenue, 2020-2032
6.4.2 By Country – North America Electronic Total Station Sales, 2020-2032
6.4.3 United States Electronic Total Station Market Size, 2020-2032
6.4.4 Canada Electronic Total Station Market Size, 2020-2032
6.4.5 Mexico Electronic Total Station Market Size, 2020-2032
6.5 Europe
6.5.1 By Country – Europe Electronic Total Station Revenue, 2020-2032
6.5.2 By Country – Europe Electronic Total Station Sales, 2020-2032
6.5.3 Germany Electronic Total Station Market Size, 2020-2032
6.5.4 France Electronic Total Station Market Size, 2020-2032
6.5.5 U.K. Electronic Total Station Market Size, 2020-2032
6.5.6 Italy Electronic Total Station Market Size, 2020-2032
6.5.7 Russia Electronic Total Station Market Size, 2020-2032
6.5.8 Nordic Countries Electronic Total Station Market Size, 2020-2032
6.5.9 Benelux Electronic Total Station Market Size, 2020-2032
6.6 Asia
6.6.1 By Region – Asia Electronic Total Station Revenue, 2020-2032
6.6.2 By Region – Asia Electronic Total Station Sales, 2020-2032
6.6.3 China Electronic Total Station Market Size, 2020-2032
6.6.4 Japan Electronic Total Station Market Size, 2020-2032
6.6.5 South Korea Electronic Total Station Market Size, 2020-2032
6.6.6 Southeast Asia Electronic Total Station Market Size, 2020-2032
6.6.7 India Electronic Total Station Market Size, 2020-2032
6.7 South America
6.7.1 By Country – South America Electronic Total Station Revenue, 2020-2032
6.7.2 By Country – South America Electronic Total Station Sales, 2020-2032
6.7.3 Brazil Electronic Total Station Market Size, 2020-2032
6.7.4 Argentina Electronic Total Station Market Size, 2020-2032
6.8 Middle East & Africa
6.8.1 By Country – Middle East & Africa Electronic Total Station Revenue, 2020-2032
6.8.2 By Country – Middle East & Africa Electronic Total Station Sales, 2020-2032
6.8.3 Turkey Electronic Total Station Market Size, 2020-2032
6.8.4 Israel Electronic Total Station Market Size, 2020-2032
6.8.5 Saudi Arabia Electronic Total Station Market Size, 2020-2032
6.8.6 UAE Electronic Total Station Market Size, 2020-2032
7 Manufacturers & Brands Profiles
7.1 SOUTH
7.1.1 SOUTH Company Summary
7.1.2 SOUTH Business Overview
7.1.3 SOUTH Electronic Total Station Major Product Offerings
7.1.4 SOUTH Electronic Total Station Sales and Revenue in Global (2020-2025)
7.1.5 SOUTH Key News & Latest Developments
7.2 FOIF
7.2.1 FOIF Company Summary
7.2.2 FOIF Business Overview
7.2.3 FOIF Electronic Total Station Major Product Offerings
7.2.4 FOIF Electronic Total Station Sales and Revenue in Global (2020-2025)
7.2.5 FOIF Key News & Latest Developments
7.3 TJOP
7.3.1 TJOP Company Summary
7.3.2 TJOP Business Overview
7.3.3 TJOP Electronic Total Station Major Product Offerings
7.3.4 TJOP Electronic Total Station Sales and Revenue in Global (2020-2025)
7.3.5 TJOP Key News & Latest Developments
7.4 DAD
7.4.1 DAD Company Summary
7.4.2 DAD Business Overview
7.4.3 DAD Electronic Total Station Major Product Offerings
7.4.4 DAD Electronic Total Station Sales and Revenue in Global (2020-2025)
7.4.5 DAD Key News & Latest Developments
7.5 BOIF
7.5.1 BOIF Company Summary
7.5.2 BOIF Business Overview
7.5.3 BOIF Electronic Total Station Major Product Offerings
7.5.4 BOIF Electronic Total Station Sales and Revenue in Global (2020-2025)
7.5.5 BOIF Key News & Latest Developments
7.6 Leica
7.6.1 Leica Company Summary
7.6.2 Leica Business Overview
7.6.3 Leica Electronic Total Station Major Product Offerings
7.6.4 Leica Electronic Total Station Sales and Revenue in Global (2020-2025)
7.6.5 Leica Key News & Latest Developments
7.7 Topcon
7.7.1 Topcon Company Summary
7.7.2 Topcon Business Overview
7.7.3 Topcon Electronic Total Station Major Product Offerings
7.7.4 Topcon Electronic Total Station Sales and Revenue in Global (2020-2025)
7.7.5 Topcon Key News & Latest Developments
7.8 Trimble
7.8.1 Trimble Company Summary
7.8.2 Trimble Business Overview
7.8.3 Trimble Electronic Total Station Major Product Offerings
7.8.4 Trimble Electronic Total Station Sales and Revenue in Global (2020-2025)
7.8.5 Trimble Key News & Latest Developments
8 Global Electronic Total Station Production Capacity, Analysis
8.1 Global Electronic Total Station Production Capacity, 2020-2032
8.2 Electronic Total Station Production Capacity of Key Manufacturers in Global Market
8.3 Global Electronic Total Station Production by Region
9 Key Market Trends, Opportunity, Drivers and Restraints
9.1 Market Opportunities & Trends
9.2 Market Drivers
9.3 Market Restraints
10 Electronic Total Station Supply Chain Analysis
10.1 Electronic Total Station Industry Value Chain
10.2 Electronic Total Station Upstream Market
10.3 Electronic Total Station Downstream and Clients
10.4 Marketing Channels Analysis
10.4.1 Marketing Channels
10.4.2 Electronic Total Station Distributors and Sales Agents in Global
11 Conclusion
12 Appendix
12.1 Note
12.2 Examples of Clients
12.3 DisclaimerList of Tables
Table 1. Key Players of Electronic Total Station in Global Market
Table 2. Top Electronic Total Station Players in Global Market, Ranking by Revenue (2024)
Table 3. Global Electronic Total Station Revenue by Companies, (US$, Mn), 2020-2025
Table 4. Global Electronic Total Station Revenue Share by Companies, 2020-2025
Table 5. Global Electronic Total Station Sales by Companies, (Units), 2020-2025
Table 6. Global Electronic Total Station Sales Share by Companies, 2020-2025
Table 7. Key Manufacturers Electronic Total Station Price (2020-2025) & (USD/Unit)
Table 8. Global Manufacturers Electronic Total Station Product Type
Table 9. List of Global Tier 1 Electronic Total Station Companies, Revenue (US$, Mn) in 2024 and Market Share
Table 10. List of Global Tier 2 and Tier 3 Electronic Total Station Companies, Revenue (US$, Mn) in 2024 and Market Share
Table 11. Segment by Angle Measurement Accuracy – Global Electronic Total Station Revenue, (US$, Mn), 2024 & 2032
Table 12. Segment by Angle Measurement Accuracy – Global Electronic Total Station Revenue (US$, Mn), 2020-2025
Table 13. Segment by Angle Measurement Accuracy – Global Electronic Total Station Revenue (US$, Mn), 2026-2032
Table 14. Segment by Angle Measurement Accuracy – Global Electronic Total Station Sales (Units), 2020-2025
Table 15. Segment by Angle Measurement Accuracy – Global Electronic Total Station Sales (Units), 2026-2032
Table 16. Segment by Application – Global Electronic Total Station Revenue, (US$, Mn), 2024 & 2032
Table 17. Segment by Application – Global Electronic Total Station Revenue, (US$, Mn), 2020-2025
Table 18. Segment by Application – Global Electronic Total Station Revenue, (US$, Mn), 2026-2032
Table 19. Segment by Application – Global Electronic Total Station Sales, (Units), 2020-2025
Table 20. Segment by Application – Global Electronic Total Station Sales, (Units), 2026-2032
Table 21. By Region – Global Electronic Total Station Revenue, (US$, Mn), 2025-2032
Table 22. By Region – Global Electronic Total Station Revenue, (US$, Mn), 2020-2025
Table 23. By Region – Global Electronic Total Station Revenue, (US$, Mn), 2026-2032
Table 24. By Region – Global Electronic Total Station Sales, (Units), 2020-2025
Table 25. By Region – Global Electronic Total Station Sales, (Units), 2026-2032
Table 26. By Country – North America Electronic Total Station Revenue, (US$, Mn), 2020-2025
Table 27. By Country – North America Electronic Total Station Revenue, (US$, Mn), 2026-2032
Table 28. By Country – North America Electronic Total Station Sales, (Units), 2020-2025
Table 29. By Country – North America Electronic Total Station Sales, (Units), 2026-2032
Table 30. By Country – Europe Electronic Total Station Revenue, (US$, Mn), 2020-2025
Table 31. By Country – Europe Electronic Total Station Revenue, (US$, Mn), 2026-2032
Table 32. By Country – Europe Electronic Total Station Sales, (Units), 2020-2025
Table 33. By Country – Europe Electronic Total Station Sales, (Units), 2026-2032
Table 34. By Region – Asia Electronic Total Station Revenue, (US$, Mn), 2020-2025
Table 35. By Region – Asia Electronic Total Station Revenue, (US$, Mn), 2026-2032
Table 36. By Region – Asia Electronic Total Station Sales, (Units), 2020-2025
Table 37. By Region – Asia Electronic Total Station Sales, (Units), 2026-2032
Table 38. By Country – South America Electronic Total Station Revenue, (US$, Mn), 2020-2025
Table 39. By Country – South America Electronic Total Station Revenue, (US$, Mn), 2026-2032
Table 40. By Country – South America Electronic Total Station Sales, (Units), 2020-2025
Table 41. By Country – South America Electronic Total Station Sales, (Units), 2026-2032
Table 42. By Country – Middle East & Africa Electronic Total Station Revenue, (US$, Mn), 2020-2025
Table 43. By Country – Middle East & Africa Electronic Total Station Revenue, (US$, Mn), 2026-2032
Table 44. By Country – Middle East & Africa Electronic Total Station Sales, (Units), 2020-2025
Table 45. By Country – Middle East & Africa Electronic Total Station Sales, (Units), 2026-2032
Table 46. SOUTH Company Summary
Table 47. SOUTH Electronic Total Station Product Offerings
Table 48. SOUTH Electronic Total Station Sales (Units), Revenue (US$, Mn) and Average Price (USD/Unit) & (2020-2025)
Table 49. SOUTH Key News & Latest Developments
Table 50. FOIF Company Summary
Table 51. FOIF Electronic Total Station Product Offerings
Table 52. FOIF Electronic Total Station Sales (Units), Revenue (US$, Mn) and Average Price (USD/Unit) & (2020-2025)
Table 53. FOIF Key News & Latest Developments
Table 54. TJOP Company Summary
Table 55. TJOP Electronic Total Station Product Offerings
Table 56. TJOP Electronic Total Station Sales (Units), Revenue (US$, Mn) and Average Price (USD/Unit) & (2020-2025)
Table 57. TJOP Key News & Latest Developments
Table 58. DAD Company Summary
Table 59. DAD Electronic Total Station Product Offerings
Table 60. DAD Electronic Total Station Sales (Units), Revenue (US$, Mn) and Average Price (USD/Unit) & (2020-2025)
Table 61. DAD Key News & Latest Developments
Table 62. BOIF Company Summary
Table 63. BOIF Electronic Total Station Product Offerings
Table 64. BOIF Electronic Total Station Sales (Units), Revenue (US$, Mn) and Average Price (USD/Unit) & (2020-2025)
Table 65. BOIF Key News & Latest Developments
Table 66. Leica Company Summary
Table 67. Leica Electronic Total Station Product Offerings
Table 68. Leica Electronic Total Station Sales (Units), Revenue (US$, Mn) and Average Price (USD/Unit) & (2020-2025)
Table 69. Leica Key News & Latest Developments
Table 70. Topcon Company Summary
Table 71. Topcon Electronic Total Station Product Offerings
Table 72. Topcon Electronic Total Station Sales (Units), Revenue (US$, Mn) and Average Price (USD/Unit) & (2020-2025)
Table 73. Topcon Key News & Latest Developments
Table 74. Trimble Company Summary
Table 75. Trimble Electronic Total Station Product Offerings
Table 76. Trimble Electronic Total Station Sales (Units), Revenue (US$, Mn) and Average Price (USD/Unit) & (2020-2025)
Table 77. Trimble Key News & Latest Developments
Table 78. Electronic Total Station Capacity of Key Manufacturers in Global Market, 2023-2025 (Units)
Table 79. Global Electronic Total Station Capacity Market Share of Key Manufacturers, 2023-2025
Table 80. Global Electronic Total Station Production by Region, 2020-2025 (Units)
Table 81. Global Electronic Total Station Production by Region, 2026-2032 (Units)
Table 82. Electronic Total Station Market Opportunities & Trends in Global Market
Table 83. Electronic Total Station Market Drivers in Global Market
Table 84. Electronic Total Station Market Restraints in Global Market
Table 85. Electronic Total Station Raw Materials
Table 86. Electronic Total Station Raw Materials Suppliers in Global Market
Table 87. Typical Electronic Total Station Downstream
Table 88. Electronic Total Station Downstream Clients in Global Market
Table 89. Electronic Total Station Distributors and Sales Agents in Global Market

List of Figures
Figure 1. Electronic Total Station Product Picture
Figure 2. Electronic Total Station Segment by Angle Measurement Accuracy in 2024
Figure 3. Electronic Total Station Segment by Application in 2024
Figure 4. Global Electronic Total Station Market Overview: 2024
Figure 5. Key Caveats
Figure 6. Global Electronic Total Station Market Size: 2024 VS 2032 (US$, Mn)
Figure 7. Global Electronic Total Station Revenue: 2020-2032 (US$, Mn)
Figure 8. Electronic Total Station Sales in Global Market: 2020-2032 (Units)
Figure 9. The Top 3 and 5 Players Market Share by Electronic Total Station Revenue in 2024
Figure 10. Segment by Angle Measurement Accuracy – Global Electronic Total Station Revenue, (US$, Mn), 2024 & 2032
Figure 11. Segment by Angle Measurement Accuracy – Global Electronic Total Station Revenue Market Share, 2020-2032
Figure 12. Segment by Angle Measurement Accuracy – Global Electronic Total Station Sales Market Share, 2020-2032
Figure 13. Segment by Angle Measurement Accuracy – Global Electronic Total Station Price (USD/Unit), 2020-2032
Figure 14. Segment by Application – Global Electronic Total Station Revenue, (US$, Mn), 2024 & 2032
Figure 15. Segment by Application – Global Electronic Total Station Revenue Market Share, 2020-2032
Figure 16. Segment by Application – Global Electronic Total Station Sales Market Share, 2020-2032
Figure 17. Segment by Application -Global Electronic Total Station Price (USD/Unit), 2020-2032
Figure 18. By Region – Global Electronic Total Station Revenue, (US$, Mn), 2025 & 2032
Figure 19. By Region – Global Electronic Total Station Revenue Market Share, 2020 VS 2024 VS 2032
Figure 20. By Region – Global Electronic Total Station Revenue Market Share, 2020-2032
Figure 21. By Region – Global Electronic Total Station Sales Market Share, 2020-2032
Figure 22. By Country – North America Electronic Total Station Revenue Market Share, 2020-2032
Figure 23. By Country – North America Electronic Total Station Sales Market Share, 2020-2032
Figure 24. United States Electronic Total Station Revenue, (US$, Mn), 2020-2032
Figure 25. Canada Electronic Total Station Revenue, (US$, Mn), 2020-2032
Figure 26. Mexico Electronic Total Station Revenue, (US$, Mn), 2020-2032
Figure 27. By Country – Europe Electronic Total Station Revenue Market Share, 2020-2032
Figure 28. By Country – Europe Electronic Total Station Sales Market Share, 2020-2032
Figure 29. Germany Electronic Total Station Revenue, (US$, Mn), 2020-2032
Figure 30. France Electronic Total Station Revenue, (US$, Mn), 2020-2032
Figure 31. U.K. Electronic Total Station Revenue, (US$, Mn), 2020-2032
Figure 32. Italy Electronic Total Station Revenue, (US$, Mn), 2020-2032
Figure 33. Russia Electronic Total Station Revenue, (US$, Mn), 2020-2032
Figure 34. Nordic Countries Electronic Total Station Revenue, (US$, Mn), 2020-2032
Figure 35. Benelux Electronic Total Station Revenue, (US$, Mn), 2020-2032
Figure 36. By Region – Asia Electronic Total Station Revenue Market Share, 2020-2032
Figure 37. By Region – Asia Electronic Total Station Sales Market Share, 2020-2032
Figure 38. China Electronic Total Station Revenue, (US$, Mn), 2020-2032
Figure 39. Japan Electronic Total Station Revenue, (US$, Mn), 2020-2032
Figure 40. South Korea Electronic Total Station Revenue, (US$, Mn), 2020-2032
Figure 41. Southeast Asia Electronic Total Station Revenue, (US$, Mn), 2020-2032
Figure 42. India Electronic Total Station Revenue, (US$, Mn), 2020-2032
Figure 43. By Country – South America Electronic Total Station Revenue Market Share, 2020-2032
Figure 44. By Country – South America Electronic Total Station Sales, Market Share, 2020-2032
Figure 45. Brazil Electronic Total Station Revenue, (US$, Mn), 2020-2032
Figure 46. Argentina Electronic Total Station Revenue, (US$, Mn), 2020-2032
Figure 47. By Country – Middle East & Africa Electronic Total Station Revenue, Market Share, 2020-2032
Figure 48. By Country – Middle East & Africa Electronic Total Station Sales, Market Share, 2020-2032
Figure 49. Turkey Electronic Total Station Revenue, (US$, Mn), 2020-2032
Figure 50. Israel Electronic Total Station Revenue, (US$, Mn), 2020-2032
Figure 51. Saudi Arabia Electronic Total Station Revenue, (US$, Mn), 2020-2032
Figure 52. UAE Electronic Total Station Revenue, (US$, Mn), 2020-2032
Figure 53. Global Electronic Total Station Production Capacity (Units), 2020-2032
Figure 54. The Percentage of Production Electronic Total Station by Region, 2024 VS 2032
Figure 55. Electronic Total Station Industry Value Chain
Figure 56. Marketing Channels