Computational Camera Market, Trends, Business Strategies 2025-2032

Computational Camera Market size was valued at USD 5.8 billion in 2024. The market is projected to grow from USD 6.7 billion in 2025 to USD 14.3 billion by 2032, exhibiting a CAGR of 11.2% during the forecast period.


PDF Icon Download Sample Report PDF
  • Quick Dispatch

    All Orders

  • Secure Payment

    100% Secure Payment

Price range: $1,500.00 through $4,250.00

Clear

MARKET INSIGHTS

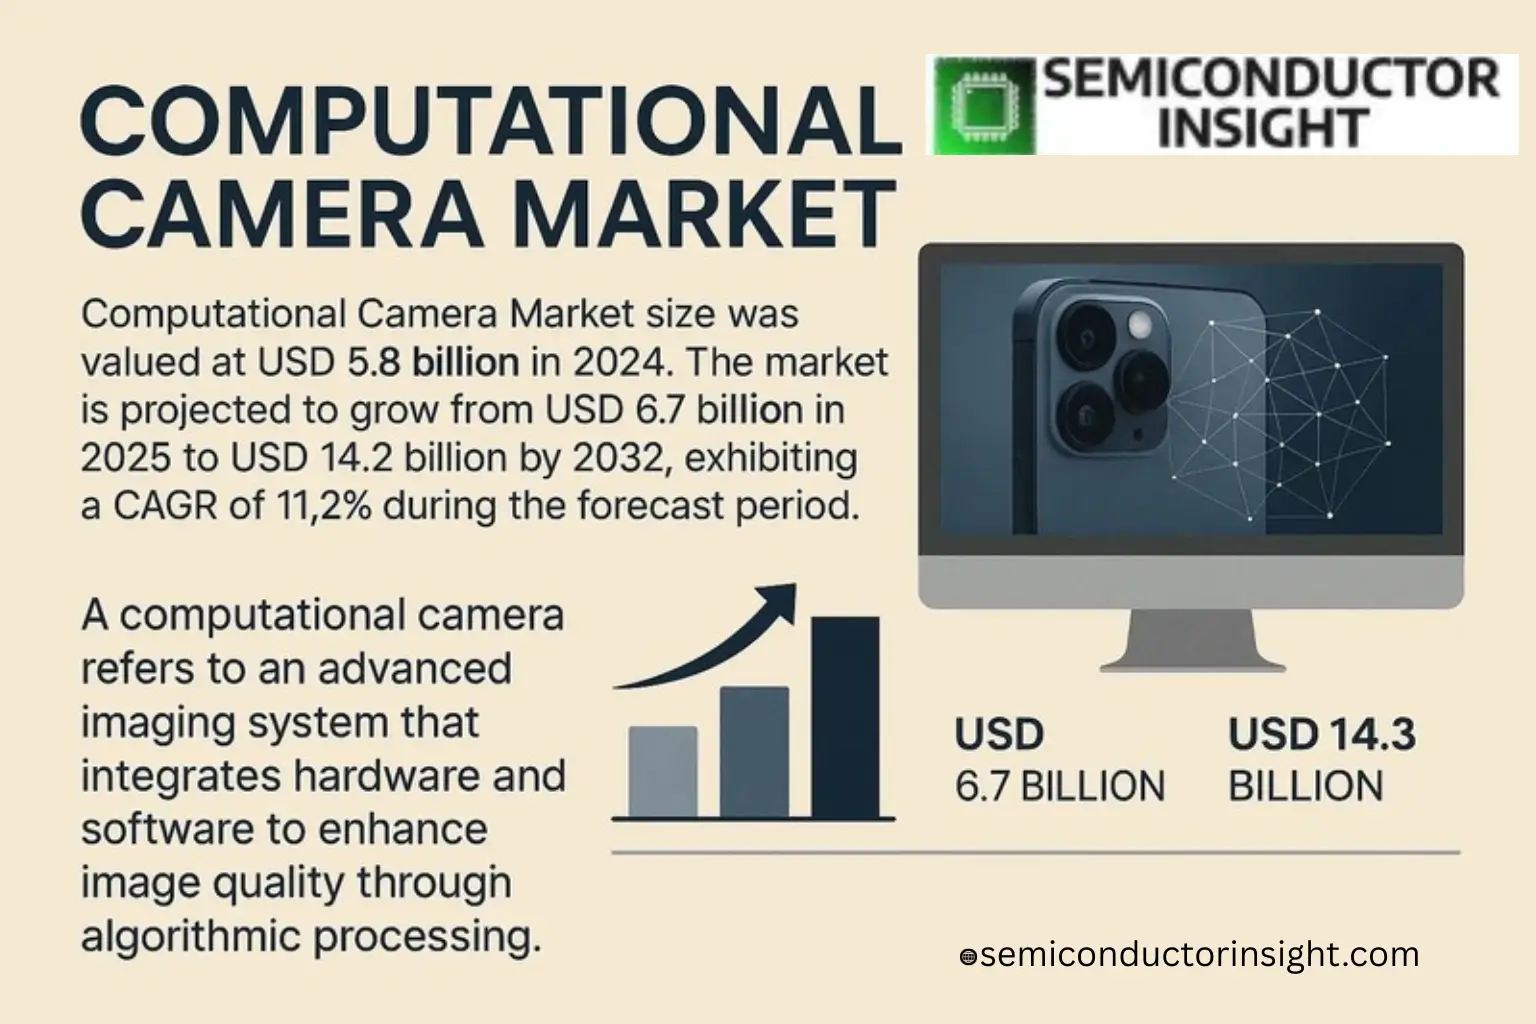
Global Computational Camera Market size was valued at USD 5.8 billion in 2024. The market is projected to grow from USD 6.7 billion in 2025 to USD 14.3 billion by 2032, exhibiting a CAGR of 11.2% during the forecast period.

A computational camera refers to an advanced imaging system that integrates hardware and software to enhance image quality through algorithmic processing. Unlike traditional cameras, these devices leverage artificial intelligence, computer vision, and multi-sensor fusion to enable features like low-light enhancement, depth mapping, and real-time object recognition. Key technologies include multi-frame noise reduction, HDR imaging, and computational bokeh effects.

The market is experiencing rapid growth due to increasing demand for high-quality imaging in smartphones, autonomous vehicles, and surveillance systems. The proliferation of AI-powered applications and the expansion of 5G networks are further accelerating adoption. Major players such as Sony, Samsung Electronics, and Apple are investing heavily in R&D to develop next-generation solutions with improved processing capabilities and energy efficiency.

Xyz market size & forecast

MARKET DRIVERS

Advancements in AI-Powered Imaging

The Computational Camera Market is experiencing significant growth due to rapid advancements in artificial intelligence and machine learning. These technologies enable real-time image processing, enhancing features like low-light photography, depth sensing, and object recognition. Over 65% of premium smartphones now incorporate computational photography capabilities.

Demand for Enhanced Mobile Photography

Consumer expectations for professional-quality smartphone photography continue to rise, with computational cameras enabling multi-frame processing, HDR imaging, and portrait modes. Global smartphone Computational Camera Market is projected to grow at 18.7% CAGR through 2028.

Automotive applications are emerging as another key driver, with computational cameras enabling advanced driver assistance systems (ADAS) through real-time environmental analysis.

MARKET CHALLENGES

High Computational Requirements

Implementing computational camera algorithms requires significant processing power, leading to increased hardware costs and battery consumption. This creates challenges for mid-range device integration where consumers are more price-sensitive.

Other Challenges

Latency Issues in Real-Time Processing
Despite advancements, some computational camera systems still face millisecond-level delays in processing complex scenes, particularly in applications requiring instant feedback like AR/VR.

MARKET RESTRAINTS

Intellectual Property Barriers

Major tech companies hold numerous patents on computational photography algorithms, creating barriers to entry for smaller players. License costs for key technologies can add 12-18% to overall camera module production expenses.

MARKET OPPORTUNITIES

Medical Imaging Applications

Computational camera technology shows strong potential in healthcare, particularly for AI-assisted diagnostics through enhanced medical imaging. The market for computational imaging in healthcare is expected to reach USD 3.2 billion by 2027.

Industrial Automation Expansion

Manufacturing sectors are increasingly adopting computational cameras for quality control, with machine vision systems achieving 99.5% defect detection accuracy in controlled environments.
Computational Camera Market Trends

AI and Computational Photography Driving Market Expansion

The Computational Camera Market, valued at million in 2024, is projected to grow at a CAGR of % by 2032, fueled by advancements in AI-powered image processing. This technology combines computer vision, machine learning, and advanced optics to deliver superior imaging capabilities beyond traditional cameras. Market adoption is accelerating in smartphones, autonomous vehicles, and industrial inspection systems where enhanced visual intelligence is critical.

Other Trends

Smartphone Integration Boosts Consumer Demand

Over 78% of premium smartphones now incorporate computational camera technologies for features like night mode enhancement and portrait bokeh. Manufacturers are competing on computational photography capabilities, with multi-lens arrays (16-lens cameras) gaining traction for professional-grade mobile imaging. The smartphone camera segment accounts for 62% of global computational camera unit sales.

Industrial and Medical Applications Show Rapid Growth

Machine vision systems utilizing computational cameras are transforming quality control in manufacturing, achieving 99.5% defect detection accuracy in automotive production lines. Medical imaging applications are expanding with computational cameras enabling early disease detection through advanced tissue analysis. The industrial segment is projected to grow at 21% CAGR through 2032, outpacing consumer markets.

5G and Edge Computing Enable Real-Time Processing

The rollout of 5G networks and edge computing infrastructure is removing latency barriers for computational camera applications. Autonomous vehicles now process complex visual data in under 50ms, while security systems achieve real-time facial recognition with 98% accuracy. This infrastructure development is critical for scaling computational camera deployments across smart cities and IoT ecosystems.

Regional Market Dynamics

Asia-Pacific dominates the Computational Camera Market with 54% global share, driven by smartphone OEMs and manufacturing automation in China, South Korea, and Japan. North America leads in R&D investment with 38% of AI imaging patents originating from U.S. tech firms. Europe shows strong growth in industrial and automotive applications, particularly in German and French markets.

COMPETITIVE LANDSCAPE

Key Industry Players

Advanced Imaging Technologies Reshaping Market Dynamics

The Computational Camera Market is dominated by established optical technology leaders and emerging AI-driven imaging specialists. Sony leads the sector with its advanced CMOS sensors and AI processing chips, capturing over 25% market share through partnerships with major smartphone manufacturers. Samsung follows closely with ISOCELL image sensors optimized for computational photography, while Canon and Nikon maintain strong positions in industrial and professional imaging segments through hybrid optical-computational solutions.

Niche players like Sunny Optical and OFILM Group are gaining traction through specialized multi-lens array designs for 3D imaging applications. Technology giants Apple and Google leverage vertical integration, developing proprietary computational photography stacks that outperform traditional camera hardware. The market also sees innovative approaches from Pelican Imaging (light field technology) and Algolux (computational ISP solutions), though these face challenges scaling against established competitors.

List of Key Computational Camera Companies Profiled

  • Sony Corporation
  • Samsung Electronics
  • Canon Inc.
  • Nikon Corporation
  • Apple Inc.
  • LG Innotek
  • Sharp Corporation
  • Sunny Optical Technology
  • OFILM Group
  • Chicony Electronics
  • Fujifilm Holdings
  • Leica Camera AG
  • Primax Electronics
  • Pelican Imaging Corporation
  • Algolux Inc.

Segment Analysis:

Segment Category Sub-Segments Key Insights
By Type
  • Single and Dual Lens Cameras
  • 16-Lens Cameras
  • Others
Single and Dual Lens Cameras

  • Dominates consumer electronics due to balanced cost-performance ratio
  • Widely adopted in smartphones for AI-enhanced photography features
  • Enables advanced computational photography with lower hardware complexity
By Application
  • Smartphone Camera
  • Standalone Camera
  • Machine Vision
  • Others
Smartphone Camera

  • Primary growth driver for computational camera adoption
  • Enables premium features like night mode, portrait bokeh, and HDR
  • Continuous innovation in smartphone imaging drives R&D investments
By End User
  • Consumer Electronics
  • Automotive
  • Industrial
Consumer Electronics

  • Largest end-user segment leveraging computational photography
  • Includes smartphones, digital cameras, and AR/VR devices
  • Demand driven by social media and content creation trends
By Technology
  • AI-based Processing
  • Multi-frame Fusion
  • Depth Reconstruction
AI-based Processing

  • Most advanced segment driving computational camera capabilities
  • Enables real-time scene understanding and image optimization
  • Critical for autonomous vehicles and security applications
By Integration Level
  • Standalone Systems
  • Embedded Solutions
  • Cloud-based Processing
Embedded Solutions

  • Preferred integration method for most applications
  • Balances performance with power efficiency requirements
  • Critical for mobile and edge computing implementations


Regional Analysis: Computational Camera Market

North America

North America dominates the Computational Camera Market with advanced camera technologies and strong R&D investments. Major technology hubs like Silicon Valley drive innovation in AI-powered computational photography. The region benefits from high consumer adoption of premium smartphones with advanced camera systems and growing applications in industrial imaging. Tech giants continue pioneering multi-camera arrays and depth-sensing technologies that enhance computational photography capabilities across smartphones, automotive, and medical imaging sectors. The presence of leading semiconductor companies and software developers creates a robust ecosystem for computational camera solution development.

Smartphone Innovation Hub
North American smartphone manufacturers lead in integrating computational photography with AI processing chips. The region sees rapid adoption of night mode, HDR+, and portrait lighting features through advanced computational camera algorithms.
Automotive Imaging Growth
Computational cameras find increasing applications in autonomous vehicles across North America, with enhanced depth mapping and real-time image processing capabilities proving critical for ADAS and self-driving technologies.
AR/VR Applications
The region’s strong AR/VR ecosystem leverages computational cameras for precise environmental mapping and image enhancement, particularly in gaming, retail, and industrial training applications.
Medical Imaging Advances
North American healthcare facilities increasingly adopt computational camera systems for enhanced diagnostic imaging, with AI-powered analysis improving early disease detection through sophisticated image processing.

Europe
Europe shows strong growth in computational camera applications with strict data protection regulations shaping development priorities. The region focuses on privacy-preserving computational photography techniques in surveillance and smartphone applications. Automotive companies collaborate with camera manufacturers to develop ADAS-compliant imaging systems. Industrial applications in manufacturing quality control are expanding, with Germany and France leading in optical technology innovation for machine vision.

Asia-Pacific
The Asia-Pacific Computational Camera Market experiences rapid expansion, driven by mass smartphone adoption and booming electronics manufacturing. Chinese and Korean manufacturers push computational photography boundaries with innovative multi-lens solutions. Emerging applications in surveillance systems and mobile payments utilize facial recognition capabilities. Japan leads in industrial applications, particularly in robotics and automated inspection systems using computational imaging.

South America
South America shows growing adoption of computational cameras primarily in smartphone segments. Brazil and Argentina see increasing demand for mid-range devices featuring computational photography. Limited industrial applications currently focus on agricultural monitoring and security systems, with gradual adoption in manufacturing quality control processes.

Middle East & Africa
The MEA region demonstrates emerging potential in computational camera adoption, with smartphone penetration driving initial growth. Security and surveillance applications dominate current usage, particularly in smart city projects across Gulf nations. Local manufacturers face challenges in developing indigenous computational photography technologies, relying primarily on imported solutions.

Report Scope

This market research report provides a comprehensive analysis of the Computational Camera Market , covering the forecast period 2025–2032. It offers detailed insights into market dynamics, technological advancements, competitive landscape, and key trends shaping the industry.

Key focus areas of the report include:

  • Market Overview: The report begins with an overview outlining its current market scenario, key growth indicators, and industry transformation drivers. It discusses macroeconomic factors, demand–supply balance, regulatory landscape, and the strategic role of semiconductors in powering advancements across industries such as automotive, telecommunications, consumer electronics, and industrial automation.
  • Market Size & Forecast: Historical data and future projections for revenue, unit shipments, and market value across major regions and segments.
  • Segmentation Analysis: Detailed breakdown by product type, technology, application, and end-user industry to identify high-growth segments and investment opportunities.
  • Regional Insights: Insights into market performance across North America, Europe, Asia-Pacific, Latin America, and the Middle East & Africa, including country-level analysis where relevant.
  • Competitive Landscape: Profiles of leading market participants, including their product offerings, R&D focus, manufacturing capacity, pricing strategies, and recent developments such as mergers, acquisitions, and partnerships.
  • Technology Trends & Innovation: Assessment of emerging technologies, integration of AI/IoT, semiconductor design trends, fabrication techniques, and evolving industry standards.
  • Market Drivers & Restraints: Evaluation of factors driving market growth along with challenges, supply chain constraints, regulatory issues, and market-entry barriers.
  • Stakeholder Insights: Insights for component suppliers, OEMs, system integrators, investors, and policymakers regarding the evolving ecosystem and strategic opportunities.

Primary and secondary research methods are employed, including interviews with industry experts, data from verified sources, and real-time market intelligence to ensure the accuracy and reliability of the insights presented.

FREQUENTLY ASKED QUESTIONS:

What is the current market size of Computational Camera Market?

-> Computational Camera Market size was valued at USD 5.8 billion in 2024. The market is projected to grow from USD 6.7 billion in 2025 to USD 14.3 billion by 2032, exhibiting a CAGR of 11.2% during the forecast period.

Which key companies operate in Computational Camera Market?

-> Key players include LG Innotek, Sharp, Sunny Optical Technology, OFILM Group, Chicony Electronics, Fujifilm, Apple, Samsung Electronics, Canon, Nikon, Sony, Leica, among others.

What are the key growth drivers?

-> Key growth drivers include expansion of smartphone applications, autonomous vehicle adoption, increasing security surveillance needs, and advancements in AI/image processing technologies.

Which region dominates the market?

-> Asia is the fastest-growing region, particularly China, Japan, and South Korea, due to strong presence of electronics manufacturers.

What are the emerging trends?

-> Emerging trends include integration of 5G/edge computing, multi-lens camera systems, and increasing demand for intelligent visual sensing in industrial applications.

Computational Camera Market, Trends, Business Strategies 2025-2032

Get Sample Report PDF for Exclusive Insights

Report Sample Includes

  • Table of Contents
  • List of Tables & Figures
  • Charts, Research Methodology, and more...
PDF Icon Download Sample Report PDF
SKU: 09ec9424db74
Category:

Download Sample Report

Table of Content

1 Introduction to Research & Analysis Reports
1.1 Computational Camera Market Definition
1.2 Market Segments
1.2.1 Segment by Type
1.2.2 Segment by Application
1.3 Global Computational Camera Market Overview
1.4 Features & Benefits of This Report
1.5 Methodology & Sources of Information
1.5.1 Research Methodology
1.5.2 Research Process
1.5.3 Base Year
1.5.4 Report Assumptions & Caveats
2 Global Computational Camera Overall Market Size
2.1 Global Computational Camera Market Size: 2024 VS 2032
2.2 Global Computational Camera Market Size, Prospects & Forecasts: 2020-2032
2.3 Global Computational Camera Sales: 2020-2032
3 Company Landscape
3.1 Top Computational Camera Players in Global Market
3.2 Top Global Computational Camera Companies Ranked by Revenue
3.3 Global Computational Camera Revenue by Companies
3.4 Global Computational Camera Sales by Companies
3.5 Global Computational Camera Price by Manufacturer (2020-2025)
3.6 Top 3 and Top 5 Computational Camera Companies in Global Market, by Revenue in 2024
3.7 Global Manufacturers Computational Camera Product Type
3.8 Tier 1, Tier 2, and Tier 3 Computational Camera Players in Global Market
3.8.1 List of Global Tier 1 Computational Camera Companies
3.8.2 List of Global Tier 2 and Tier 3 Computational Camera Companies
4 Sights by Product
4.1 Overview
4.1.1 Segment by Type – Global Computational Camera Market Size Markets, 2024 & 2032
4.1.2 Single and Dual Lens Cameras
4.1.3 16-Lens Cameras
4.1.4 Others
4.2 Segment by Type – Global Computational Camera Revenue & Forecasts
4.2.1 Segment by Type – Global Computational Camera Revenue, 2020-2025
4.2.2 Segment by Type – Global Computational Camera Revenue, 2026-2032
4.2.3 Segment by Type – Global Computational Camera Revenue Market Share, 2020-2032
4.3 Segment by Type – Global Computational Camera Sales & Forecasts
4.3.1 Segment by Type – Global Computational Camera Sales, 2020-2025
4.3.2 Segment by Type – Global Computational Camera Sales, 2026-2032
4.3.3 Segment by Type – Global Computational Camera Sales Market Share, 2020-2032
4.4 Segment by Type – Global Computational Camera Price (Manufacturers Selling Prices), 2020-2032
5 Sights by Application
5.1 Overview
5.1.1 Segment by Application – Global Computational Camera Market Size, 2024 & 2032
5.1.2 Smartphone Camera
5.1.3 Standalone Camera
5.1.4 Machine Vision
5.2 Segment by Application – Global Computational Camera Revenue & Forecasts
5.2.1 Segment by Application – Global Computational Camera Revenue, 2020-2025
5.2.2 Segment by Application – Global Computational Camera Revenue, 2026-2032
5.2.3 Segment by Application – Global Computational Camera Revenue Market Share, 2020-2032
5.3 Segment by Application – Global Computational Camera Sales & Forecasts
5.3.1 Segment by Application – Global Computational Camera Sales, 2020-2025
5.3.2 Segment by Application – Global Computational Camera Sales, 2026-2032
5.3.3 Segment by Application – Global Computational Camera Sales Market Share, 2020-2032
5.4 Segment by Application – Global Computational Camera Price (Manufacturers Selling Prices), 2020-2032
6 Sights by Region
6.1 By Region – Global Computational Camera Market Size, 2024 & 2032
6.2 By Region – Global Computational Camera Revenue & Forecasts
6.2.1 By Region – Global Computational Camera Revenue, 2020-2025
6.2.2 By Region – Global Computational Camera Revenue, 2026-2032
6.2.3 By Region – Global Computational Camera Revenue Market Share, 2020-2032
6.3 By Region – Global Computational Camera Sales & Forecasts
6.3.1 By Region – Global Computational Camera Sales, 2020-2025
6.3.2 By Region – Global Computational Camera Sales, 2026-2032
6.3.3 By Region – Global Computational Camera Sales Market Share, 2020-2032
6.4 North America
6.4.1 By Country – North America Computational Camera Revenue, 2020-2032
6.4.2 By Country – North America Computational Camera Sales, 2020-2032
6.4.3 United States Computational Camera Market Size, 2020-2032
6.4.4 Canada Computational Camera Market Size, 2020-2032
6.4.5 Mexico Computational Camera Market Size, 2020-2032
6.5 Europe
6.5.1 By Country – Europe Computational Camera Revenue, 2020-2032
6.5.2 By Country – Europe Computational Camera Sales, 2020-2032
6.5.3 Germany Computational Camera Market Size, 2020-2032
6.5.4 France Computational Camera Market Size, 2020-2032
6.5.5 U.K. Computational Camera Market Size, 2020-2032
6.5.6 Italy Computational Camera Market Size, 2020-2032
6.5.7 Russia Computational Camera Market Size, 2020-2032
6.5.8 Nordic Countries Computational Camera Market Size, 2020-2032
6.5.9 Benelux Computational Camera Market Size, 2020-2032
6.6 Asia
6.6.1 By Region – Asia Computational Camera Revenue, 2020-2032
6.6.2 By Region – Asia Computational Camera Sales, 2020-2032
6.6.3 China Computational Camera Market Size, 2020-2032
6.6.4 Japan Computational Camera Market Size, 2020-2032
6.6.5 South Korea Computational Camera Market Size, 2020-2032
6.6.6 Southeast Asia Computational Camera Market Size, 2020-2032
6.6.7 India Computational Camera Market Size, 2020-2032
6.7 South America
6.7.1 By Country – South America Computational Camera Revenue, 2020-2032
6.7.2 By Country – South America Computational Camera Sales, 2020-2032
6.7.3 Brazil Computational Camera Market Size, 2020-2032
6.7.4 Argentina Computational Camera Market Size, 2020-2032
6.8 Middle East & Africa
6.8.1 By Country – Middle East & Africa Computational Camera Revenue, 2020-2032
6.8.2 By Country – Middle East & Africa Computational Camera Sales, 2020-2032
6.8.3 Turkey Computational Camera Market Size, 2020-2032
6.8.4 Israel Computational Camera Market Size, 2020-2032
6.8.5 Saudi Arabia Computational Camera Market Size, 2020-2032
6.8.6 UAE Computational Camera Market Size, 2020-2032
7 Manufacturers & Brands Profiles
7.1 LG Innotek
7.1.1 LG Innotek Company Summary
7.1.2 LG Innotek Business Overview
7.1.3 LG Innotek Computational Camera Major Product Offerings
7.1.4 LG Innotek Computational Camera Sales and Revenue in Global (2020-2025)
7.1.5 LG Innotek Key News & Latest Developments
7.2 Sharp
7.2.1 Sharp Company Summary
7.2.2 Sharp Business Overview
7.2.3 Sharp Computational Camera Major Product Offerings
7.2.4 Sharp Computational Camera Sales and Revenue in Global (2020-2025)
7.2.5 Sharp Key News & Latest Developments
7.3 Sunny Optical Technology
7.3.1 Sunny Optical Technology Company Summary
7.3.2 Sunny Optical Technology Business Overview
7.3.3 Sunny Optical Technology Computational Camera Major Product Offerings
7.3.4 Sunny Optical Technology Computational Camera Sales and Revenue in Global (2020-2025)
7.3.5 Sunny Optical Technology Key News & Latest Developments
7.4 OFILM Group
7.4.1 OFILM Group Company Summary
7.4.2 OFILM Group Business Overview
7.4.3 OFILM Group Computational Camera Major Product Offerings
7.4.4 OFILM Group Computational Camera Sales and Revenue in Global (2020-2025)
7.4.5 OFILM Group Key News & Latest Developments
7.5 Chicony Electronics
7.5.1 Chicony Electronics Company Summary
7.5.2 Chicony Electronics Business Overview
7.5.3 Chicony Electronics Computational Camera Major Product Offerings
7.5.4 Chicony Electronics Computational Camera Sales and Revenue in Global (2020-2025)
7.5.5 Chicony Electronics Key News & Latest Developments
7.6 Fujifilm
7.6.1 Fujifilm Company Summary
7.6.2 Fujifilm Business Overview
7.6.3 Fujifilm Computational Camera Major Product Offerings
7.6.4 Fujifilm Computational Camera Sales and Revenue in Global (2020-2025)
7.6.5 Fujifilm Key News & Latest Developments
7.7 Apple
7.7.1 Apple Company Summary
7.7.2 Apple Business Overview
7.7.3 Apple Computational Camera Major Product Offerings
7.7.4 Apple Computational Camera Sales and Revenue in Global (2020-2025)
7.7.5 Apple Key News & Latest Developments
7.8 Samsung Electronics
7.8.1 Samsung Electronics Company Summary
7.8.2 Samsung Electronics Business Overview
7.8.3 Samsung Electronics Computational Camera Major Product Offerings
7.8.4 Samsung Electronics Computational Camera Sales and Revenue in Global (2020-2025)
7.8.5 Samsung Electronics Key News & Latest Developments
7.9 Canon
7.9.1 Canon Company Summary
7.9.2 Canon Business Overview
7.9.3 Canon Computational Camera Major Product Offerings
7.9.4 Canon Computational Camera Sales and Revenue in Global (2020-2025)
7.9.5 Canon Key News & Latest Developments
7.10 Nikon
7.10.1 Nikon Company Summary
7.10.2 Nikon Business Overview
7.10.3 Nikon Computational Camera Major Product Offerings
7.10.4 Nikon Computational Camera Sales and Revenue in Global (2020-2025)
7.10.5 Nikon Key News & Latest Developments
7.11 Sony
7.11.1 Sony Company Summary
7.11.2 Sony Business Overview
7.11.3 Sony Computational Camera Major Product Offerings
7.11.4 Sony Computational Camera Sales and Revenue in Global (2020-2025)
7.11.5 Sony Key News & Latest Developments
7.12 Leica
7.12.1 Leica Company Summary
7.12.2 Leica Business Overview
7.12.3 Leica Computational Camera Major Product Offerings
7.12.4 Leica Computational Camera Sales and Revenue in Global (2020-2025)
7.12.5 Leica Key News & Latest Developments
7.13 Sunny Optical
7.13.1 Sunny Optical Company Summary
7.13.2 Sunny Optical Business Overview
7.13.3 Sunny Optical Computational Camera Major Product Offerings
7.13.4 Sunny Optical Computational Camera Sales and Revenue in Global (2020-2025)
7.13.5 Sunny Optical Key News & Latest Developments
7.14 Primax
7.14.1 Primax Company Summary
7.14.2 Primax Business Overview
7.14.3 Primax Computational Camera Major Product Offerings
7.14.4 Primax Computational Camera Sales and Revenue in Global (2020-2025)
7.14.5 Primax Key News & Latest Developments
7.15 Pelican Imaging
7.15.1 Pelican Imaging Company Summary
7.15.2 Pelican Imaging Business Overview
7.15.3 Pelican Imaging Computational Camera Major Product Offerings
7.15.4 Pelican Imaging Computational Camera Sales and Revenue in Global (2020-2025)
7.15.5 Pelican Imaging Key News & Latest Developments
8 Global Computational Camera Production Capacity, Analysis
8.1 Global Computational Camera Production Capacity, 2020-2032
8.2 Computational Camera Production Capacity of Key Manufacturers in Global Market
8.3 Global Computational Camera Production by Region
9 Key Market Trends, Opportunity, Drivers and Restraints
9.1 Market Opportunities & Trends
9.2 Market Drivers
9.3 Market Restraints
10 Computational Camera Supply Chain Analysis
10.1 Computational Camera Industry Value Chain
10.2 Computational Camera Upstream Market
10.3 Computational Camera Downstream and Clients
10.4 Marketing Channels Analysis
10.4.1 Marketing Channels
10.4.2 Computational Camera Distributors and Sales Agents in Global
11 Conclusion
12 Appendix
12.1 Note
12.2 Examples of Clients
12.3 DisclaimerList of Tables
Table 1. Key Players of Computational Camera in Global Market
Table 2. Top Computational Camera Players in Global Market, Ranking by Revenue (2024)
Table 3. Global Computational Camera Revenue by Companies, (US$, Mn), 2020-2025
Table 4. Global Computational Camera Revenue Share by Companies, 2020-2025
Table 5. Global Computational Camera Sales by Companies, (K Units), 2020-2025
Table 6. Global Computational Camera Sales Share by Companies, 2020-2025
Table 7. Key Manufacturers Computational Camera Price (2020-2025) & (USD/Unit)
Table 8. Global Manufacturers Computational Camera Product Type
Table 9. List of Global Tier 1 Computational Camera Companies, Revenue (US$, Mn) in 2024 and Market Share
Table 10. List of Global Tier 2 and Tier 3 Computational Camera Companies, Revenue (US$, Mn) in 2024 and Market Share
Table 11. Segment by Type – Global Computational Camera Revenue, (US$, Mn), 2024 & 2032
Table 12. Segment by Type – Global Computational Camera Revenue (US$, Mn), 2020-2025
Table 13. Segment by Type – Global Computational Camera Revenue (US$, Mn), 2026-2032
Table 14. Segment by Type – Global Computational Camera Sales (K Units), 2020-2025
Table 15. Segment by Type – Global Computational Camera Sales (K Units), 2026-2032
Table 16. Segment by Application – Global Computational Camera Revenue, (US$, Mn), 2024 & 2032
Table 17. Segment by Application – Global Computational Camera Revenue, (US$, Mn), 2020-2025
Table 18. Segment by Application – Global Computational Camera Revenue, (US$, Mn), 2026-2032
Table 19. Segment by Application – Global Computational Camera Sales, (K Units), 2020-2025
Table 20. Segment by Application – Global Computational Camera Sales, (K Units), 2026-2032
Table 21. By Region – Global Computational Camera Revenue, (US$, Mn), 2025-2032
Table 22. By Region – Global Computational Camera Revenue, (US$, Mn), 2020-2025
Table 23. By Region – Global Computational Camera Revenue, (US$, Mn), 2026-2032
Table 24. By Region – Global Computational Camera Sales, (K Units), 2020-2025
Table 25. By Region – Global Computational Camera Sales, (K Units), 2026-2032
Table 26. By Country – North America Computational Camera Revenue, (US$, Mn), 2020-2025
Table 27. By Country – North America Computational Camera Revenue, (US$, Mn), 2026-2032
Table 28. By Country – North America Computational Camera Sales, (K Units), 2020-2025
Table 29. By Country – North America Computational Camera Sales, (K Units), 2026-2032
Table 30. By Country – Europe Computational Camera Revenue, (US$, Mn), 2020-2025
Table 31. By Country – Europe Computational Camera Revenue, (US$, Mn), 2026-2032
Table 32. By Country – Europe Computational Camera Sales, (K Units), 2020-2025
Table 33. By Country – Europe Computational Camera Sales, (K Units), 2026-2032
Table 34. By Region – Asia Computational Camera Revenue, (US$, Mn), 2020-2025
Table 35. By Region – Asia Computational Camera Revenue, (US$, Mn), 2026-2032
Table 36. By Region – Asia Computational Camera Sales, (K Units), 2020-2025
Table 37. By Region – Asia Computational Camera Sales, (K Units), 2026-2032
Table 38. By Country – South America Computational Camera Revenue, (US$, Mn), 2020-2025
Table 39. By Country – South America Computational Camera Revenue, (US$, Mn), 2026-2032
Table 40. By Country – South America Computational Camera Sales, (K Units), 2020-2025
Table 41. By Country – South America Computational Camera Sales, (K Units), 2026-2032
Table 42. By Country – Middle East & Africa Computational Camera Revenue, (US$, Mn), 2020-2025
Table 43. By Country – Middle East & Africa Computational Camera Revenue, (US$, Mn), 2026-2032
Table 44. By Country – Middle East & Africa Computational Camera Sales, (K Units), 2020-2025
Table 45. By Country – Middle East & Africa Computational Camera Sales, (K Units), 2026-2032
Table 46. LG Innotek Company Summary
Table 47. LG Innotek Computational Camera Product Offerings
Table 48. LG Innotek Computational Camera Sales (K Units), Revenue (US$, Mn) and Average Price (USD/Unit) & (2020-2025)
Table 49. LG Innotek Key News & Latest Developments
Table 50. Sharp Company Summary
Table 51. Sharp Computational Camera Product Offerings
Table 52. Sharp Computational Camera Sales (K Units), Revenue (US$, Mn) and Average Price (USD/Unit) & (2020-2025)
Table 53. Sharp Key News & Latest Developments
Table 54. Sunny Optical Technology Company Summary
Table 55. Sunny Optical Technology Computational Camera Product Offerings
Table 56. Sunny Optical Technology Computational Camera Sales (K Units), Revenue (US$, Mn) and Average Price (USD/Unit) & (2020-2025)
Table 57. Sunny Optical Technology Key News & Latest Developments
Table 58. OFILM Group Company Summary
Table 59. OFILM Group Computational Camera Product Offerings
Table 60. OFILM Group Computational Camera Sales (K Units), Revenue (US$, Mn) and Average Price (USD/Unit) & (2020-2025)
Table 61. OFILM Group Key News & Latest Developments
Table 62. Chicony Electronics Company Summary
Table 63. Chicony Electronics Computational Camera Product Offerings
Table 64. Chicony Electronics Computational Camera Sales (K Units), Revenue (US$, Mn) and Average Price (USD/Unit) & (2020-2025)
Table 65. Chicony Electronics Key News & Latest Developments
Table 66. Fujifilm Company Summary
Table 67. Fujifilm Computational Camera Product Offerings
Table 68. Fujifilm Computational Camera Sales (K Units), Revenue (US$, Mn) and Average Price (USD/Unit) & (2020-2025)
Table 69. Fujifilm Key News & Latest Developments
Table 70. Apple Company Summary
Table 71. Apple Computational Camera Product Offerings
Table 72. Apple Computational Camera Sales (K Units), Revenue (US$, Mn) and Average Price (USD/Unit) & (2020-2025)
Table 73. Apple Key News & Latest Developments
Table 74. Samsung Electronics Company Summary
Table 75. Samsung Electronics Computational Camera Product Offerings
Table 76. Samsung Electronics Computational Camera Sales (K Units), Revenue (US$, Mn) and Average Price (USD/Unit) & (2020-2025)
Table 77. Samsung Electronics Key News & Latest Developments
Table 78. Canon Company Summary
Table 79. Canon Computational Camera Product Offerings
Table 80. Canon Computational Camera Sales (K Units), Revenue (US$, Mn) and Average Price (USD/Unit) & (2020-2025)
Table 81. Canon Key News & Latest Developments
Table 82. Nikon Company Summary
Table 83. Nikon Computational Camera Product Offerings
Table 84. Nikon Computational Camera Sales (K Units), Revenue (US$, Mn) and Average Price (USD/Unit) & (2020-2025)
Table 85. Nikon Key News & Latest Developments
Table 86. Sony Company Summary
Table 87. Sony Computational Camera Product Offerings
Table 88. Sony Computational Camera Sales (K Units), Revenue (US$, Mn) and Average Price (USD/Unit) & (2020-2025)
Table 89. Sony Key News & Latest Developments
Table 90. Leica Company Summary
Table 91. Leica Computational Camera Product Offerings
Table 92. Leica Computational Camera Sales (K Units), Revenue (US$, Mn) and Average Price (USD/Unit) & (2020-2025)
Table 93. Leica Key News & Latest Developments
Table 94. Sunny Optical Company Summary
Table 95. Sunny Optical Computational Camera Product Offerings
Table 96. Sunny Optical Computational Camera Sales (K Units), Revenue (US$, Mn) and Average Price (USD/Unit) & (2020-2025)
Table 97. Sunny Optical Key News & Latest Developments
Table 98. Primax Company Summary
Table 99. Primax Computational Camera Product Offerings
Table 100. Primax Computational Camera Sales (K Units), Revenue (US$, Mn) and Average Price (USD/Unit) & (2020-2025)
Table 101. Primax Key News & Latest Developments
Table 102. Pelican Imaging Company Summary
Table 103. Pelican Imaging Computational Camera Product Offerings
Table 104. Pelican Imaging Computational Camera Sales (K Units), Revenue (US$, Mn) and Average Price (USD/Unit) & (2020-2025)
Table 105. Pelican Imaging Key News & Latest Developments
Table 106. Computational Camera Capacity of Key Manufacturers in Global Market, 2023-2025 (K Units)
Table 107. Global Computational Camera Capacity Market Share of Key Manufacturers, 2023-2025
Table 108. Global Computational Camera Production by Region, 2020-2025 (K Units)
Table 109. Global Computational Camera Production by Region, 2026-2032 (K Units)
Table 110. Computational Camera Market Opportunities & Trends in Global Market
Table 111. Computational Camera Market Drivers in Global Market
Table 112. Computational Camera Market Restraints in Global Market
Table 113. Computational Camera Raw Materials
Table 114. Computational Camera Raw Materials Suppliers in Global Market
Table 115. Typical Computational Camera Downstream
Table 116. Computational Camera Downstream Clients in Global Market
Table 117. Computational Camera Distributors and Sales Agents in Global Market

List of Figures
Figure 1. Computational Camera Product Picture
Figure 2. Computational Camera Segment by Type in 2024
Figure 3. Computational Camera Segment by Application in 2024
Figure 4. Global Computational Camera Market Overview: 2024
Figure 5. Key Caveats
Figure 6. Global Computational Camera Market Size: 2024 VS 2032 (US$, Mn)
Figure 7. Global Computational Camera Revenue: 2020-2032 (US$, Mn)
Figure 8. Computational Camera Sales in Global Market: 2020-2032 (K Units)
Figure 9. The Top 3 and 5 Players Market Share by Computational Camera Revenue in 2024
Figure 10. Segment by Type – Global Computational Camera Revenue, (US$, Mn), 2024 & 2032
Figure 11. Segment by Type – Global Computational Camera Revenue Market Share, 2020-2032
Figure 12. Segment by Type – Global Computational Camera Sales Market Share, 2020-2032
Figure 13. Segment by Type – Global Computational Camera Price (USD/Unit), 2020-2032
Figure 14. Segment by Application – Global Computational Camera Revenue, (US$, Mn), 2024 & 2032
Figure 15. Segment by Application – Global Computational Camera Revenue Market Share, 2020-2032
Figure 16. Segment by Application – Global Computational Camera Sales Market Share, 2020-2032
Figure 17. Segment by Application -Global Computational Camera Price (USD/Unit), 2020-2032
Figure 18. By Region – Global Computational Camera Revenue, (US$, Mn), 2025 & 2032
Figure 19. By Region – Global Computational Camera Revenue Market Share, 2020 VS 2024 VS 2032
Figure 20. By Region – Global Computational Camera Revenue Market Share, 2020-2032
Figure 21. By Region – Global Computational Camera Sales Market Share, 2020-2032
Figure 22. By Country – North America Computational Camera Revenue Market Share, 2020-2032
Figure 23. By Country – North America Computational Camera Sales Market Share, 2020-2032
Figure 24. United States Computational Camera Revenue, (US$, Mn), 2020-2032
Figure 25. Canada Computational Camera Revenue, (US$, Mn), 2020-2032
Figure 26. Mexico Computational Camera Revenue, (US$, Mn), 2020-2032
Figure 27. By Country – Europe Computational Camera Revenue Market Share, 2020-2032
Figure 28. By Country – Europe Computational Camera Sales Market Share, 2020-2032
Figure 29. Germany Computational Camera Revenue, (US$, Mn), 2020-2032
Figure 30. France Computational Camera Revenue, (US$, Mn), 2020-2032
Figure 31. U.K. Computational Camera Revenue, (US$, Mn), 2020-2032
Figure 32. Italy Computational Camera Revenue, (US$, Mn), 2020-2032
Figure 33. Russia Computational Camera Revenue, (US$, Mn), 2020-2032
Figure 34. Nordic Countries Computational Camera Revenue, (US$, Mn), 2020-2032
Figure 35. Benelux Computational Camera Revenue, (US$, Mn), 2020-2032
Figure 36. By Region – Asia Computational Camera Revenue Market Share, 2020-2032
Figure 37. By Region – Asia Computational Camera Sales Market Share, 2020-2032
Figure 38. China Computational Camera Revenue, (US$, Mn), 2020-2032
Figure 39. Japan Computational Camera Revenue, (US$, Mn), 2020-2032
Figure 40. South Korea Computational Camera Revenue, (US$, Mn), 2020-2032
Figure 41. Southeast Asia Computational Camera Revenue, (US$, Mn), 2020-2032
Figure 42. India Computational Camera Revenue, (US$, Mn), 2020-2032
Figure 43. By Country – South America Computational Camera Revenue Market Share, 2020-2032
Figure 44. By Country – South America Computational Camera Sales, Market Share, 2020-2032
Figure 45. Brazil Computational Camera Revenue, (US$, Mn), 2020-2032
Figure 46. Argentina Computational Camera Revenue, (US$, Mn), 2020-2032
Figure 47. By Country – Middle East & Africa Computational Camera Revenue, Market Share, 2020-2032
Figure 48. By Country – Middle East & Africa Computational Camera Sales, Market Share, 2020-2032
Figure 49. Turkey Computational Camera Revenue, (US$, Mn), 2020-2032
Figure 50. Israel Computational Camera Revenue, (US$, Mn), 2020-2032
Figure 51. Saudi Arabia Computational Camera Revenue, (US$, Mn), 2020-2032
Figure 52. UAE Computational Camera Revenue, (US$, Mn), 2020-2032
Figure 53. Global Computational Camera Production Capacity (K Units), 2020-2032
Figure 54. The Percentage of Production Computational Camera by Region, 2024 VS 2032
Figure 55. Computational Camera Industry Value Chain
Figure 56. Marketing Channels