SEMICONDUCTOR INSIGHT
MARKET RESEARCH REPORT

Copper Busbar Market

2026 to 2034
MARKET INTELLIGENCE
ACROSS KEY REGIONS
2026 EDITION
ELECTRONIC COMPONENTS Semiconductor Market Research

Copper Busbar Market

Trends, Business Strategies 2026-2036

◷
UPDATED 24 September 2026
▤
REPORT LENGTH Detailed Report
▣
REPORT CODE 6f8d724ab668
▯
FORMATS PDF

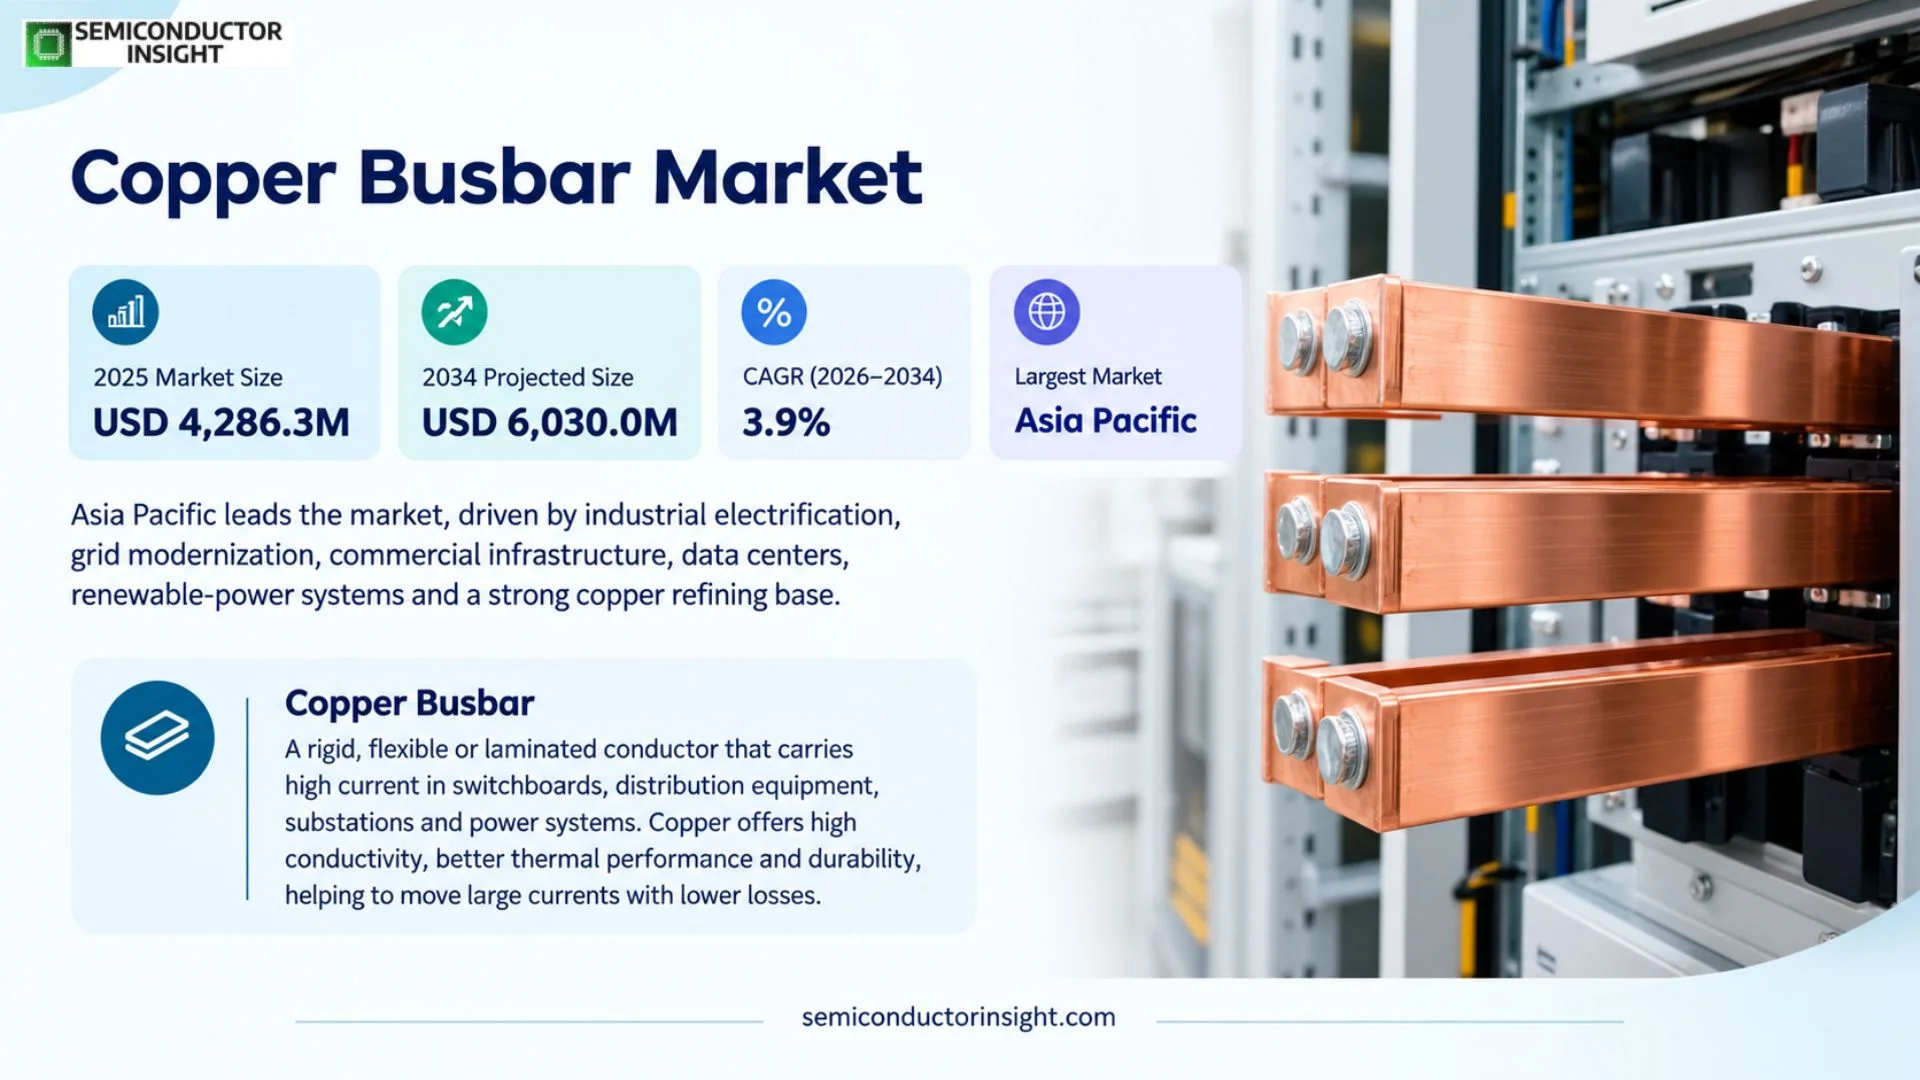
Copper Busbar Market is projected to reach USD 6,030.0 million by 2034, representing a 3.9% CAGR during 2026–2034. Asia Pacific is the largest market, supported by industrial electrification, grid modernization, commercial infrastructure, data centers, renewable-power systems and a large regional copper refining and fabrication base.

Get the sample PDF with study scope, segmentation and methodology details.

Key Statistics

2025 Market Size
USD 4,286.3 million
2034 Projected Size
USD 6,030.0 million
CAGR (2026–2034)
3.9%
Largest Market in 2025
Asia Pacific

Key Takeaways

  • Laminated Busbar is identified as the leading type in the current segment analysis because compact, low-inductance power distribution is increasingly important in converters, high-density electrical systems and modern equipment. Solid busbars remain fundamental where straightforward high-current conduction, mechanical robustness and cost efficiency dominate the design brief.
  • Power Distribution Units are the leading application in the current source segmentation, reflecting the role of busbars in short-distance high-current transfer inside commercial, industrial and digital infrastructure. Data-center growth raises the technical bar because AI racks and high-density electrical rooms require more current in less space, increasing the value of engineered busway, laminated conductors and thermal design.
  • Asia Pacific is the largest market, supported by industrial expansion, grid investment, electric mobility and a deep copper-processing base. USGS data show China refined 14.0 million metric tons of copper in 2025, nearly half of the 29.0 million metric ton world refinery total, giving the region a strong upstream and fabrication ecosystem.
  • Copper price and availability remain the principal margin variables. The USGS projected a 2025 COMEX copper average of USD 4.80 per pound, 14% above 2024, while copper was added to the U.S. critical minerals list. Fabricators therefore need disciplined material pass-through mechanisms and inventory management because raw copper accounts for a large share of finished busbar cost.
  • AI data centers and grid electrification create a higher-value design opportunity rather than only more commodity copper volume. The IEA expects U.S. electricity use to add more than 420 TWh over 2026–2030, with data centers contributing about half of the increase, driving demand for compact, high-current distribution architectures.

Copper Busbar Market Overview

Copper Busbar market is valued at USD 4,286.3 million in 2025 and is projected to reach USD 6,030.0 million by 2034, representing a 3.9% CAGR during 2026–2034. Asia Pacific is the largest market, supported by industrial electrification, grid modernization, commercial infrastructure, data centers, renewable-power systems and a large regional copper refining and fabrication base.

Base year: 2025 · Estimated year: 2026 · Forecast period: 2026–2034 · Historical data: 2020–2025 · Values in USD million unless otherwise stated

A copper busbar is a rigid, flexible or laminated conductor engineered to carry high current across a compact electrical path inside switchboards, distribution equipment, substations, power-conversion systems and other electrical assemblies. Copper is favored because its conductivity, thermal behavior, joining characteristics and mechanical durability allow designers to move large currents with lower resistive loss than a comparable long cable route, while flat profiles can simplify connection geometry and improve heat dissipation.

Busbar demand is determined by both installed electrical capacity and current density inside equipment. A conventional commercial panel may use solid flat conductors sized mainly for ampacity and fault withstand, while a data-center PDU or power converter can require laminated structures that reduce inductance, control switching transients and fit into a tightly constrained enclosure. The value per kilogram therefore varies significantly, and engineered geometry, plating, insulation and assembly can matter as much as the underlying copper content.

The raw-material backdrop is strategically important. The U.S. Geological Survey estimated 29.0 million metric tons of world refined-copper production in 2025, including 14.0 million tons in China, 2.8 million in Congo, 1.7 million in Chile and 1.4 million in Japan. USGS also projected a record 2025 COMEX copper price of USD 4.80 per pound. These figures explain why regional refining access, scrap recovery, inventory policy and customer pass-through clauses have direct effects on busbar margin and lead time.

Segment Analysis: By Type

By type, the current segment analysis divides the market into Solid Busbar and Laminated Busbar. Laminated busbars lead the stated segmentation because they combine compact packaging with low-inductance current paths in power-electronic and high-density distribution systems, while solid busbars retain a very large installed base across switchboards, substations and general high-current electrical equipment.

Type Engineering role Market position and purchasing logic
Solid Busbar Solid busbars use a single copper section, most commonly flat bar but also round or custom profiles, to distribute current through switchgear, panels, substations and industrial equipment. Designers select cross-section, spacing, plating and supports around continuous current, fault withstand, temperature rise and connection resistance. The architecture is straightforward, mechanically robust and easy to inspect, which keeps it central to conventional low- and medium-voltage distribution. Solid busbars compete heavily on copper conversion efficiency, dimensional accuracy, surface quality, plating, machining and delivery reliability. The design is mature, so margin depends on fabrication complexity and customer integration rather than novel topology. Suppliers with local stock, automated punching and bending, and the ability to deliver finished kits can capture more value than companies selling only cut bar.
Laminated Busbar Laminated busbars stack insulated conductive layers into a compact assembly, reducing loop inductance and allowing positive, negative and sometimes control conductors to be integrated in a defined geometry. The technology is particularly valuable in converters, UPS systems, traction electronics, renewable inverters and high-density power systems where fast switching makes parasitic inductance and mechanical packaging important design parameters. Laminated Busbar is identified as the leading type in the current page analysis. Its commercial value comes from electrical design, insulation, precision alignment and integration rather than copper mass alone. Customers often engage suppliers earlier in the design cycle, and once the laminated assembly is validated, switching suppliers is more difficult because mechanical and electrical interfaces are tightly coupled to the equipment architecture.

Additional segmentation: end user, material composition and conductor shape

The current report page also segments the market by end user, material composition and conductor shape. Commercial is identified as the primary end user, electrolytic tough pitch copper as the leading material composition, and flat busbar as the leading conductor shape. These axes clarify why demand is not homogeneous: building distribution prioritizes safe and compact current transfer, material grade changes conductivity and fabrication behavior, and conductor shape affects surface area, cooling and connection layout.

Segmentation axis Sub-segments Commercial significance
By End User Commercial; Industrial; Utilities Commercial is the primary end-user segment in the current page analysis, supported by office, institutional, retail and digital infrastructure that requires compact, efficient distribution. Industrial users place greater emphasis on fault duty, uptime and customization, while utilities use busbars in substations and grid equipment where current rating, corrosion protection and long service life are central purchasing criteria.
By Material Composition Electrolytic Tough Pitch Copper; Oxygen-Free High Conductivity Copper; High-Strength Alloyed Copper Electrolytic tough pitch copper leads because it balances conductivity, mechanical properties, availability and cost. Oxygen-free high-conductivity grades are used where very high conductivity, joining or specialized processing justifies the premium. High-strength alloyed copper trades some conductivity for mechanical performance. The selected grade influences raw-material cost, bendability, temperature rise and allowable current density.
By Conductor Shape Flat Busbar; Round Busbar; Custom-Profile Busbar Flat Busbar leads the current segmentation because its high surface area supports heat dissipation and it interfaces efficiently with switchgear and distribution equipment. Round bars serve selected mechanical or rotating arrangements, while custom profiles allow OEMs to consolidate parts and route current through constrained spaces. Shape complexity increases fabrication value but also tooling, inspection and change-control requirements.

Segment Analysis: By Application

By application, the current report scope covers Power Distribution Units, Switchgear, Substations and Others. Power Distribution Units are identified as the dominant application because commercial and digital infrastructure require dense, safe high-current distribution. Switchgear and substations create a durable infrastructure base, while other applications include converters, transportation, renewable-energy systems and specialized industrial equipment.

Application Demand characteristics and commercial implication
Power Distribution Units PDUs use busbars to collect and distribute high current across breakers, branch circuits and downstream loads while controlling temperature rise and connection resistance. Data centers are increasing current density sharply, and AI systems are pushing facility and rack architectures toward higher power. This raises demand for compact busbar and busway systems, engineered insulation and precise connection geometry, making PDU demand a value-growth opportunity rather than only a copper-volume story.
Switchgear Switchgear requires mechanically robust busbars that can carry continuous current, withstand fault forces and maintain safe clearances over a long service life. The application is specification driven, with dimensions, plating, supports and joint design tailored to the equipment platform. Suppliers benefit from recurring production after qualification, but must maintain tight consistency because a geometry change can affect temperature rise, dielectric clearances and certification of the complete switchgear assembly.
Substations Substation busbars connect transformers, breakers and outgoing feeders at high current, making conductivity, mechanical strength and corrosion performance central to system reliability. Copper competes with aluminum depending on voltage class, cost and design. Grid modernization, renewable interconnection and urban load growth sustain replacement and new-build demand, but projects are long cycle and usually require documentation, type-tested equipment integration and dependable delivery against construction schedules.
Others Other applications include industrial converters, rail and electric-vehicle power systems, energy storage, renewable inverters, welding equipment and specialized high-current machinery. Laminated and custom-profile busbars can carry more engineering value here because electrical inductance, packaging and thermal behavior are tightly linked to switching performance. Suppliers with simulation, insulation design and turnkey assembly capability can win higher-margin programs than commodity bar fabricators.

Copper Busbar Market Growth

Regional Analysis

Asia Pacific leads the Copper Busbar market through a combination of copper refining scale, industrial manufacturing, grid construction and electrification. North America is increasingly shaped by data-center load and domestic electrical-equipment investment, Europe by industrial efficiency, grid modernization and AI infrastructure, South America by copper production and power projects, and Middle East & Africa by utilities, mining, new data centers and large infrastructure programs.

How do copper supply, electricity growth and infrastructure investment change busbar demand by region?

The regional picture is unusually connected to upstream copper geography. USGS estimates for 2025 show China refined 14.0 million metric tons of copper, Chile 1.7 million, Congo 2.8 million, Japan 1.4 million, Germany and South Korea 0.61 million each, India 0.62 million and Zambia 0.27 million. These are refined-copper statistics, not busbar market shares, but they reveal where feedstock, fabrication and industrial demand can coexist.

Region Market position Growth outlook Demand profile Key evidence / access factor
Asia Pacific Largest Strong Industrial, grid and electrification led China refined 14.0 Mt of copper in 2025; Japan 1.4 Mt, India 0.62 Mt and South Korea 0.61 Mt.
North America Major market Strengthening in digital infrastructure Data centers, commercial distribution and grid upgrades U.S. electricity use is forecast to add more than 420 TWh over 2026–2030, with data centers contributing about half of the increase.
Europe Major engineered market Steady Industrial efficiency, grids and AI infrastructure Germany refined 0.61 Mt of copper in 2025; new high-density data-center designs are raising current and power-distribution requirements.
South America Important upstream and project market Selective Mining, renewables and grids Chile mined 5.3 Mt and refined 1.7 Mt of copper in 2025; Peru mined 2.7 Mt and refined 0.34 Mt.
Middle East & Africa Emerging demand, major African feedstock Project led Mining, utilities, industrial and data-center infrastructure Congo mined 3.2 Mt and refined 2.8 Mt in 2025; Zambia mined 0.94 Mt and refined 0.27 Mt.
Asia Pacific LARGEST & SUPPLY-ADVANTAGED

Why does Asia Pacific lead the Copper Busbar market?

Asia Pacific combines large copper refining capacity with the world’s deepest electrical-equipment manufacturing base and strong electricity-demand growth. China refined 14.0 million metric tons of copper in 2025, while Japan, India and South Korea added substantial regional refining output. This upstream scale supports local rolling, plating and fabrication, while industrial plants, grids, renewable power, rail and digital infrastructure create broad downstream demand.

Market positionLargest region
Growth outlookStrong broad-based growth
Demand profileIndustrial and grid led
Market access gateLocal material access, standards compliance and OEM qualification
Country Position in region Demand and commercial logic
China Largest regional market and refining hub China refined 14.0 million metric tons of copper in 2025, nearly half of the world refinery total reported by USGS. Its electrical equipment, renewable energy, electric vehicle, industrial and data-center sectors create large captive demand for solid, laminated and custom busbars. Suppliers compete on material cost, fabrication scale, delivery speed and the ability to integrate finished assemblies directly into OEM power equipment.
India Fast-growing grid and industrial market India refined 0.62 million metric tons of copper in 2025 according to USGS and continues to expand power infrastructure, manufacturing and renewable-energy systems. Busbar demand is concentrated in switchgear, panels, industrial facilities and utility projects. Cost remains critical, but rising current levels and compact equipment designs increase the value of precision fabrication, plating and engineered laminated products.
Japan and South Korea High-specification electrical and electronics demand Japan refined 1.4 million metric tons of copper in 2025 and South Korea 0.61 million. Both markets have advanced electronics, automotive and industrial equipment sectors that use high-quality conductive components. Supplier selection emphasizes dimensional control, surface finish, reliability and long-term OEM qualification, supporting premium fabricated busbars even when overall construction growth is moderate.

Market instances and commercial signals

USGS estimated China’s 2025 refined-copper production at 14.0 million metric tons out of a 29.0 million metric ton world total. That concentration gives regional busbar fabricators strong access to refined feedstock and a dense network of rolling, extrusion, plating and electrical-equipment customers.

India, Japan and South Korea together accounted for more than 2.6 million metric tons of refined copper in 2025. The regional breadth matters because busbars are often fabricated close to switchgear, inverter and distribution-equipment plants, so multiple refining and manufacturing hubs reduce logistics distance between metal supply and downstream OEMs.

Asia added 513.3 GW of renewable power capacity in 2025. Solar, wind and storage systems require switchgear, substations, inverters and collection equipment that use high-current conductors, creating a sustained project pipeline for copper busbars beyond conventional building and factory demand.

Country-level revenue, shipment, supplier and application detail for Asia Pacific is covered in the full Copper Busbar report.
North America DATA-CENTER & GRID UPSHIFT

Why is North American copper busbar demand becoming more power-density driven?

North American demand is shifting toward higher current density as data centers, industrial reshoring, grid upgrades and electric infrastructure expand. The IEA expects U.S. electricity use to add more than 420 TWh over 2026–2030, with data centers contributing about half of the increase. That growth requires more switchgear, PDUs, busway and facility distribution, creating opportunities for engineered copper products with compact geometry and dependable thermal performance.

Market positionMajor market
Growth outlookStrengthening
Demand profileData center, commercial and grid led
Market access gateUL/CSA equipment certification, domestic fabrication and project delivery
Country Position in region Demand and commercial logic
United States Largest North American market The United States is adding data-center, semiconductor, industrial and grid infrastructure that raises demand for busway, PDUs, switchboards and custom copper conductors. The IEA expects data centers to account for about half of U.S. electricity-demand growth through 2030. Buyers value domestic capacity, short project lead times and engineered assemblies that reduce field labor in rapidly deployed facilities.
Mexico Electrical-equipment and automotive manufacturing base Mexico supports North American switchgear, appliance, automotive and industrial supply chains. Busbar demand comes from both local facility investment and components exported inside electrical equipment. The market rewards suppliers that can meet multinational OEM specifications while managing copper price exposure and cross-border logistics, especially where high-current conductors are delivered as machined and plated kits rather than raw bar.
Canada Industrial, utility and resource-sector demand Canada’s busbar demand is driven by utilities, mining, industrial facilities, renewable projects and data infrastructure. Project conditions can be harsh and geographically dispersed, making corrosion protection, reliable joints and long service life important. The supplier base often competes through engineering support and distribution coverage because many orders are project-specific rather than continuous high-volume production.

Market instances and commercial signals

The IEA expects U.S. electricity use to increase by more than 420 TWh in total over 2026–2030, with data centers responsible for about 50% of that growth. More power delivered to digital infrastructure translates into additional switchboards, busway, PDUs and high-current connection systems across both new and retrofitted facilities.

Siemens has disclosed USD 165 million of investment to expand electrical-equipment manufacturing across North and South Carolina for accelerating AI and data-center markets, alongside more than USD 190 million for a new 500,000-square-foot Fort Worth facility producing low-voltage infrastructure. These investments signal rising domestic demand for busbar-intensive equipment.

The 2025 COMEX copper price was projected by USGS to average a record USD 4.80 per pound, 14% higher than 2024. For North American fabricators, the price level increases working-capital exposure and strengthens the need for indexed customer pricing, hedging discipline and efficient scrap recovery.

Country-level revenue, shipment, supplier and application detail for North America is covered in the full Copper Busbar report.
Europe ENGINEERED & REGULATED

What supports European demand for copper busbars?

Europe combines industrial automation, rail, renewable integration, building efficiency and a new wave of high-density AI infrastructure. Germany refined 0.61 million metric tons of copper in 2025, and regional electrical-equipment groups are developing power architectures for much higher rack densities. The market tends to reward engineered busbar assemblies that help reduce loss, footprint and installation complexity while meeting strict equipment safety and sustainability expectations.

Market positionMajor engineered market
Growth outlookSteady with high-density niches
Demand profileIndustrial, grid and digital infrastructure
Market access gateIEC compliance, engineering documentation and low-loss design
Country Position in region Demand and commercial logic
Germany Industrial and electrical-equipment anchor Germany combines switchgear, industrial automation, automotive, rail and machine-building demand with 0.61 million metric tons of refined copper production in 2025. Busbar suppliers serving German OEMs compete on engineering discipline, repeatability, surface treatment and documented thermal performance. Long product lifecycles favor approved suppliers but also make change control and consistent material sourcing particularly important.
France Growing AI and grid infrastructure opportunity France is developing large new digital-infrastructure projects while retaining significant grid, rail and industrial demand. In 2026, SoftBank announced a plan for up to 5 GW of AI data-center capacity in France with Schneider Electric as a strategic technology partner. Such projects raise current density and create demand for busway, switchgear and compact power-distribution architectures.
Italy and Spain Renewable and industrial project demand Italy and Spain combine industrial facilities with large renewable-power fleets, creating demand for switchgear, inverter systems, substations and building distribution. Busbar purchasing is project and OEM driven, with opportunities for regional fabricators able to offer custom dimensions, plating and assemblies quickly. Copper price exposure remains important because project bids may precede metal procurement by many months.

Market instances and commercial signals

Germany refined 610,000 metric tons of copper in 2025 according to USGS. Domestic refining does not determine busbar demand by itself, but it supports a regional material ecosystem serving electrical equipment, automotive and industrial manufacturers that value stable quality and traceable supply.

Schneider Electric and AMD released a 2026 AI-factory reference design supporting 246 kW racks and modular clusters up to 10.4 MW. High rack power increases the current handled by facility and rack distribution systems, favoring compact busbar and busway architectures that can control heat, losses and installation complexity.

In May 2026, Schneider Electric announced participation in a SoftBank-backed French AI-infrastructure plan targeting up to 5 GW of data-center capacity, with an initial 3.1 GW phase. Large projects of this kind amplify demand for high-current electrical distribution, switchgear and busway alongside cooling and digital controls.

Country-level revenue, shipment, supplier and application detail for Europe is covered in the full Copper Busbar report.
South America COPPER-RICH PROJECT MARKET

How does South America combine copper supply with busbar demand?

South America is strategically important upstream and selectively attractive downstream. Chile mined 5.3 million metric tons and refined 1.7 million tons of copper in 2025, while Peru mined 2.7 million tons. Mining, renewable power and transmission projects use substantial electrical infrastructure, but much busbar fabrication remains tied to project cycles and imported equipment. Regional value capture rises where local processors convert copper into finished, plated or machined conductors.

Market positionEmerging demand, major upstream base
Growth outlookSelective
Demand profileMining, renewables and grid projects
Market access gateProject qualification, import economics and copper conversion capability
Country Position in region Demand and commercial logic
Chile Major copper and power-project market Chile was the world’s largest mined-copper producer in USGS 2025 estimates at 5.3 million metric tons and also refined 1.7 million tons. The mining sector itself is a major consumer of high-current drives, substations and distribution equipment, while renewable projects add further demand. Local fabrication opportunities center on converting regional copper into engineered electrical products rather than exporting only primary metal.
Peru Mining-led electrical demand Peru mined 2.7 million metric tons of copper in 2025 but refined only 0.34 million, illustrating the difference between resource production and downstream metal conversion. Mining expansion creates demand for substations, motor-control centers, large drives and distribution equipment. Busbar suppliers serving the market need strong project logistics and corrosion-resistant, maintainable designs suited to remote industrial sites.
Brazil Largest diversified downstream economy Brazil has a more diversified downstream demand base spanning utilities, commercial construction, industrial facilities and renewable energy. Busbar opportunities occur in switchgear, panels, data infrastructure and industrial power systems. Because the country is geographically large and import costs can be high, local or regional fabrication, stocking and technical support can materially improve competitiveness.

Market instances and commercial signals

Chile’s 2025 copper mine production was estimated at 5.3 million metric tons and refinery production at 1.7 million tons. The country’s mining operations also consume high-current electrical equipment, creating a distinctive loop in which a major copper producer is simultaneously a customer for busbar-intensive industrial infrastructure.

Peru produced 2.7 million metric tons of mined copper in 2025 but only 0.34 million tons of refined copper. The gap highlights a downstream-processing opportunity: greater regional refining and fabrication could allow more value to be captured in finished electrical conductors rather than exported concentrates and cathode.

Renewable generation and grid projects across Brazil, Chile and other South American markets add substations, inverters, energy-storage systems and commercial power distribution. Busbar demand is therefore linked to project execution and local electrical-equipment manufacturing, with copper availability providing an upstream advantage but not guaranteeing local finished-product share.

Country-level revenue, shipment, supplier and application detail for South America is covered in the full Copper Busbar report.
Middle East & Africa PROJECT-LED & FEEDSTOCK-RICH

What is the commercial logic for Copper Busbars in Middle East & Africa?

Middle East & Africa combines fast infrastructure growth in Gulf markets with major African copper production. Congo mined 3.2 million metric tons and refined 2.8 million tons of copper in 2025, while Zambia mined 0.94 million and refined 0.27 million. Downstream busbar demand is concentrated in utilities, mining, industrial plants, renewables and data centers, making project approvals and supply reliability central to market access.

Market positionSmaller but strategic
Growth outlookProject led
Demand profileUtilities, mining and digital infrastructure
Market access gateProject vendor approval, import logistics and local fabrication capability
Country Position in region Demand and commercial logic
Congo (Kinshasa) Major copper feedstock center Congo produced 3.2 million metric tons of mined copper and 2.8 million tons of refined copper in 2025 according to USGS. Much of the metal feeds global supply chains, but mining and processing sites also require high-current distribution equipment. Greater local electrical fabrication could increase downstream value capture, although infrastructure, power availability and industrial capability remain constraints.
Zambia Copper producer and industrial demand base Zambia mined 0.94 million metric tons of copper and refined 0.27 million tons in 2025. Mining operations create recurring demand for substations, drives, switchgear and busbar systems, particularly for expansions and modernization. Suppliers must design for harsh environments and long maintenance intervals, and project delivery capability can matter more than broad catalog breadth.
Saudi Arabia and UAE Infrastructure and data-center growth hubs Saudi Arabia and the UAE are investing in industrial, renewable and digital infrastructure, increasing the need for high-current distribution equipment. Data centers and large commercial projects favor compact busway and PDU architectures, while renewable projects require substations and converter systems. Most busbar demand is tied to approved equipment packages, making international OEM relationships and local project support important.

Market instances and commercial signals

Congo’s 2025 refined-copper production was estimated at 2.8 million metric tons, almost ten times Zambia’s 0.27 million tons. The region therefore has major copper feedstock but uneven downstream conversion capability, creating both supply-chain opportunity and dependence on imported finished electrical equipment.

Africa added 11.3 GW of renewable power capacity in 2025, while the Middle East recorded 28.9% renewable-capacity growth. New solar, wind and associated grid infrastructure require substations, switchgear and power conversion, all of which use busbars for compact high-current distribution.

Large Gulf data-center and industrial projects are increasing current density inside electrical systems. As rack and facility power rises, busway and laminated conductors become more attractive because they can move high current through compact routes while reducing installation time compared with large bundles of parallel cables.

Country-level revenue, shipment, supplier and application detail for Middle East & Africa is covered in the full Copper Busbar report.

Key Copper Busbar Manufacturers and Competitive Landscape

The competitive landscape combines integrated electrical-equipment groups, global copper processors and specialist busbar fabricators. Large OEMs use busbars as part of switchgear, busway and power-distribution systems, while specialists compete on custom fabrication, laminated assemblies, plating, flexible connectors and fast engineering response. Copper purchasing scale matters, but finished-product value is increasingly determined by geometry, insulation and integration.

Pentair, Gindre, Luvata and Oriental Copper represent important copper-processing and fabrication capabilities, while Schneider Electric, ABB and Siemens bring system-level access to switchgear, busway, industrial distribution and data-center infrastructure. Watteredge and Storm Power Components compete in custom and specialty conductor applications. The market therefore spans upstream metal conversion and downstream engineered electrical systems rather than a single uniform product category.

Material economics remain a defining competitive factor. When copper prices rise, fabricators with indexed contracts, efficient scrap recovery and disciplined inventory can protect conversion margins better than suppliers carrying fixed-price commitments. USGS projected the 2025 COMEX copper price at USD 4.80 per pound, making working-capital management and purchasing scale commercially significant even before fabrication complexity is considered.

Engineering intensity is rising in laminated and high-density applications. Low-inductance stacks, insulation systems, plating, embedded sensing and custom mechanical interfaces require simulation and close collaboration with power-electronics designers. These programs can generate better margins and longer qualification cycles than solid bar, but they also demand stronger quality systems and more precise process control.

Tier structure

Competitive tier Representative companies How they compete
Integrated electrical-system leaders Schneider Electric; ABB Ltd.; Siemens AG; Pentair These companies compete through complete power-distribution architectures, global project channels and the ability to integrate busbars into switchgear, busway, PDUs and digital infrastructure. Their advantage is system qualification and customer access, particularly in data centers, commercial buildings and utility projects.
Global copper and busbar specialists Gindre; Luvata; Oriental Copper; Aurubis; ElvalHalcor These suppliers compete through copper conversion scale, material expertise, dimensional control and customized profiles. Access to rolling and refining networks can improve material efficiency, while regional fabrication lets them supply OEMs with machined, plated or semi-finished conductors tailored to equipment platforms.
Custom fabrication specialists Watteredge; Storm Power Components; Metal Gems; Gonda Metal; EMS Industrial Specialists create value through short-run engineering, flexible connectors, laminated assemblies, welding, machining and finished kits. They are often strongest where customers need rapid design response or custom geometry rather than a standard catalog bar, although scale and global qualification can limit participation in the largest multinational programs.

Key companies profiled

Pentair, Etablissements Gindre Duchavany (Gindre), Luvata, Oriental Copper, Schneider Electric, ABB Ltd., Siemens AG, Watteredge, Storm Power Components, Aurubis, Metal Gems, Gonda Metal, EMS Industrial, ElvalHalcor Hellenic Copper and Aluminum Industry S.A..

Copper Busbar Production Capacity Analysis

Copper-busbar capacity depends on refined copper availability, rolling or extrusion, straightening, cutting, punching, bending, machining, plating, insulation and assembly. For laminated products, adhesive and dielectric processing, alignment and electrical testing add further steps. The manufacturing footprint tends to cluster near copper-processing hubs and electrical-equipment customers because transporting bulky copper is costly and project lead times favor regional fabrication.

Upstream refining is highly concentrated. USGS estimated China at 14.0 million metric tons of refined copper in 2025 out of a 29.0 million ton world total, followed by significant output in Congo, Chile, Japan, Russia and other countries. Busbar makers do not need to own refining, but access to cathode, rod, strip and bar at competitive conversion premiums can influence lead time and margin during tight markets.

Finished capacity is more fragmented than refining because fabrication can be located close to switchgear, panel and power-electronics customers. Standard solid busbar requires relatively conventional metalworking, but tight-tolerance laminated assemblies need specialized insulation, bonding and test capability. This creates different capacity pools: a region may have ample copper bar production yet limited qualified laminated-busbar capacity for high-frequency power electronics.

Plating and surface finishing can become bottlenecks because tin, silver or nickel coatings may be specified to reduce oxidation, improve joint reliability or support harsh environments. Environmental permitting and quality requirements make plating harder to relocate quickly than cutting and bending. OEMs therefore increasingly assess the complete process chain, including outsourced surface treatment, when qualifying a busbar supplier.

Copper Busbar Market Dynamics: Drivers, Restraints and Opportunities

Copper-busbar demand is supported by electricity growth, data centers, grids, industrial electrification and renewable integration, while metal price volatility, aluminum substitution and project-cycle exposure moderate growth. The strongest margin opportunities are moving toward engineered distribution systems where compact geometry, low inductance, thermal performance and installation speed create value beyond the underlying copper weight.

MARKET DRIVERS

Drivers Impact Analysis*

Factor Direction / Intensity* Commercial transmission mechanism
AI data-center power density High Rising rack and facility loads require more PDUs, busway, switchgear and high-current connections, increasing demand for compact busbar architectures and engineered assemblies.
Grid modernization and electrification High Substations, switchgear, renewable interconnections and industrial load additions expand the installed base of high-current conductors across utilities and large facilities.
Industrial and commercial construction Medium-High Factories, offices, hospitals and institutions require switchboards and distribution equipment, sustaining solid and fabricated copper busbar demand.
Electric mobility and power electronics Medium Vehicles, charging, rail and converters favor laminated and custom busbars where inductance, thermal behavior and packaging are performance-critical.

Data-center electricity growth raises current density

The IEA expects U.S. electricity use to add more than 420 TWh through 2030 and estimates data centers will account for about half of the increase. Higher facility and rack power means more current must move through switchgear, PDUs and busway. This favors copper busbars because they provide compact, predictable high-current paths and can be engineered to reduce voltage drop, heat and installation complexity.

Grid modernization expands the base of busbar-intensive equipment

Renewable interconnection, load growth and aging infrastructure require substations, switchgear and distribution upgrades. Busbars are embedded in these systems as short-distance high-current conductors, so demand follows equipment investment rather than copper consumption alone. Projects also create opportunities for higher-value plating, custom geometry and prefabricated assemblies that reduce field labor and improve connection consistency.

Industrial electrification supports durable replacement demand

Factories are adding automation, electric heating, drives, charging and other high-power loads. Each expansion requires distribution boards, motor-control centers and power-conversion equipment with busbars sized for higher current and fault duty. The installed industrial base also creates recurring retrofit demand, which is less cyclical than greenfield construction and rewards suppliers able to reproduce legacy geometries quickly.

High-frequency power electronics favor laminated architecture

Inverters, UPS systems and traction equipment switch large currents at high frequency, making parasitic inductance and loop area important. Laminated busbars integrate conductors and insulation into a compact stack that can reduce voltage overshoot and simplify assembly. As power density rises, this electrical advantage allows suppliers to sell engineering content rather than competing only on kilograms of copper.

MARKET RESTRAINTS

Restraints Impact Analysis*

Factor Direction / Intensity* Commercial transmission mechanism
Copper price volatility High Raw copper is a large share of product cost, so rapid price changes increase working-capital needs and can compress margin when customer contracts do not include timely pass-through.
Aluminum substitution Medium-High Aluminum can replace copper in selected electrical equipment and cables where lower density and cost outweigh larger cross-section and joining challenges.
Project-cycle volatility Medium Large substations, commercial facilities and data centers create lumpy demand, making utilization and inventory planning difficult for custom fabricators.
Qualification and certification burden Medium Busbar geometry affects temperature rise, fault forces and equipment certification, so changing suppliers or designs can require costly revalidation.

Copper prices create direct margin and working-capital exposure

USGS projected a 2025 COMEX copper average of USD 4.80 per pound, 14% above 2024. Because metal is a major share of a solid busbar’s cost, higher prices increase inventory funding and the value of scrap generated during punching and machining. Suppliers with delayed pass-through clauses or fixed-price bids can see conversion margin squeezed even when order volumes remain healthy.

Aluminum is a credible substitute in selected current-carrying applications

USGS identifies aluminum as a substitute for copper in electrical equipment and power cable. Aluminum requires a larger cross-section for equivalent conductivity and creates different joining and oxidation considerations, but its lower density and often lower material cost can be attractive. Copper busbar suppliers therefore need to defend applications where compact size, conductivity, joint reliability and thermal performance justify the metal premium.

Custom project demand can produce uneven factory utilization

Large commercial, data-center and grid projects release orders in phases, often after long engineering and approval cycles. A fabricator may need to reserve capacity, purchase copper and tooling, then experience schedule changes outside its control. This makes flexible cells, mixed customer exposure and strong backlog management important, particularly for laminated and custom-profile programs with project-specific tooling.

Equipment certification slows design and supplier changes

Busbars are part of tested electrical assemblies, so a change in material, plating, cross-section or support arrangement can affect temperature rise, short-circuit withstand and dielectric clearances. OEMs therefore prefer stable qualified suppliers once a platform is certified. This creates an entry barrier for challengers and can delay adoption of cost-saving design changes even when the new conductor is technically sound.

MARKET OPPORTUNITIES

High-density AI data-center busway

AI racks are pushing current levels far above traditional enterprise computing. New data-center reference designs support rack densities in the hundreds of kilowatts and facility clusters measured in megawatts. Busbar suppliers can capture value through compact busway, laminated conductors, high-current joints and prefabricated distribution that shortens installation time and supports modular facility expansion.

800 VDC and next-generation DC distribution

Data-center and industrial architectures are exploring higher-voltage DC distribution to reduce current for a given power level and improve conversion efficiency. The transition creates new requirements for insulation, clearances, protection and low-inductance conductors. Suppliers that can co-design laminated busbars and interconnects for these architectures can enter higher-value programs before standards and platform designs become commoditized.

Localized fabrication near electrical-equipment plants

OEMs want shorter lead times and resilient supply for heavy copper components. Regional cutting, bending, plating and assembly capacity close to switchgear and busway plants reduces transport and project risk. Fabricators can expand value capture by supplying complete labeled kits, insulated assemblies and joint hardware rather than selling raw bar, increasing customer switching cost and reducing field labor.

Recycled copper and scrap optimization

Copper busbar fabrication generates recoverable offcuts and punch scrap with high material value. Better nesting, closed-loop scrap return and certified recycled-content programs can lower net material cost and support sustainability goals without compromising conductivity. Suppliers able to document material provenance and maintain alloy purity can turn scrap management from a housekeeping issue into a competitive purchasing and environmental advantage.

Copper Busbar Supply Chain Analysis

Stage 1
Mining and refining
Copper concentrate and scrap are converted into refined cathode. Geography, smelter availability, ore grades, scrap flows and metal prices shape the cost and availability of feedstock for downstream busbar production.
Stage 2
Rolling, extrusion and alloy conversion
Cathode or rod is transformed into flat bar, strip, round bar or custom profiles using ETP, oxygen-free or alloyed copper grades. Dimensional control and temper set the starting condition for fabrication.
Stage 3
Fabrication, plating and lamination
Busbars are cut, punched, bent, machined, plated, insulated and assembled. Laminated designs add dielectric films, bonding and precision alignment, increasing engineering content and qualification requirements.
Stage 4
OEM integration and project delivery
Finished busbars are installed in switchgear, PDUs, substations, inverters, vehicles and industrial equipment. Value capture depends on design-in support, project timing, certification and the ability to supply repeatable kits.

The largest value shift occurs after raw copper is converted into an application-specific conductor. A standard flat bar may carry a modest conversion premium, while a plated, machined and laminated assembly can command much more because it replaces customer engineering and assembly work. This difference means busbar profitability should be assessed by fabrication complexity and customer integration rather than market copper tonnage alone.

Supply resilience depends on both metal and process availability. A customer may have access to copper cathode but still face delays in the required profile, plating line, insulation system or qualified fabrication cell. For critical equipment, buyers increasingly qualify alternate plants and suppliers before shortages occur, creating opportunities for manufacturers that can demonstrate equivalent materials, tooling and quality systems across multiple locations.

Recent Developments in the Copper Busbar Market

23 July 2026
Schneider Electric and AMD released a 246 kW rack-scale AI reference design

The jointly validated Helios reference design supports AI racks up to 246 kW and modular clusters up to 10.4 MW. Such densities increase current and fault-energy requirements throughout facility distribution, supporting demand for engineered busway, rack busbars, PDUs and high-current switchgear while raising the value of compact low-loss conductor layouts.

15 June 2026
Schneider Electric and Foxconn announced collaboration on next-generation AI data centers

The companies plan standardized AI-factory architectures spanning power, cooling and modular infrastructure, with production beginning in 2026. Standardized high-density designs can accelerate deployment of repeatable electrical distribution modules, favoring busbar and busway solutions that integrate current paths into prefabricated power systems rather than relying on labor-intensive field cabling.

11 June 2025
Schneider Electric launched high-density AI data-center power and rack infrastructure

The EcoStruxure Pod Data Center platform introduced support for high-power busway, new rack PDUs and high-density rack architectures. The launch is commercially relevant to copper busbar suppliers because it demonstrates a migration toward prefabricated power distribution and in-rack busbar systems as AI loads increase current density and make conventional cable-heavy layouts harder to scale.

REPORT SCOPE & SEGMENTATION

Attribute Coverage
Market Copper Busbar
Base year / forecast 2025 base; 2026 estimate; 2034 forecast; 3.9% CAGR for 2026–2034
By Type Solid Busbar, Laminated Busbar
By Application Power Distribution Units, Switchgear, Substations, Others
By End User Commercial, Industrial, Utilities
By Material Composition Electrolytic Tough Pitch Copper, Oxygen-Free High Conductivity Copper, High-Strength Alloyed Copper
By Conductor Shape Flat Busbar, Round Busbar, Custom-Profile Busbar
Regions North America, Europe, Asia Pacific, South America, Middle East & Africa
Companies profiled Pentair, Etablissements Gindre Duchavany (Gindre), Luvata, Oriental Copper, Schneider Electric, ABB Ltd., Siemens AG, Watteredge, Storm Power Components, Aurubis, Metal Gems, Gonda Metal, EMS Industrial, ElvalHalcor Hellenic Copper and Aluminum Industry S.A.

Frequently Asked Questions

What is the Copper Busbar market size in 2025?

The global Copper Busbar market is valued at USD 4,286.3 million in 2025. The market covers solid and laminated busbars used in power distribution units, switchgear, substations and other high-current systems. Asia Pacific is the largest regional market because it combines a large copper refining base with industrial, utility, commercial and electronics manufacturing demand.

What is the Copper Busbar market forecast for 2034?

The market is projected to reach USD 6,030.0 million by 2034, representing a 3.9% CAGR during 2026–2034. Growth is steady rather than explosive because copper busbar is a mature electrical product, but data-center power density, grid modernization, industrial electrification and renewable integration are increasing both unit demand and the engineering value of laminated and custom assemblies.

Which Copper Busbar type leads the market?

Laminated Busbar is identified as the leading type in the current segment analysis. Laminated designs stack insulated conductive layers to create compact, low-inductance current paths suited to converters and high-density power systems. Solid Busbars retain a large installed base across switchgear and substations where mechanical simplicity, fault withstand and cost efficiency are the dominant purchasing requirements.

Which application leads Copper Busbar demand?

Power Distribution Units are identified as the dominant application in the current source segmentation. PDUs use busbars to distribute large currents safely and efficiently across branch circuits and downstream loads. The application is gaining technical importance as AI data centers raise rack and facility power, increasing demand for compact busway, high-current joints and engineered conductor layouts with controlled temperature rise.

Why is Asia Pacific the largest Copper Busbar market?

Asia Pacific combines large-scale copper refining, electrical-equipment manufacturing, grid expansion and industrial electrification. China refined 14.0 million metric tons of copper in 2025, while Japan, India and South Korea also produced significant refined volumes. This upstream base sits close to switchgear, inverter, renewable-energy and industrial customers, supporting both cost-efficient solid busbar and advanced laminated assemblies.

How do copper prices affect busbar suppliers?

Raw copper represents a large share of finished busbar cost, particularly for standard solid products. USGS projected the 2025 COMEX copper price to average USD 4.80 per pound, 14% above 2024. Higher metal prices increase inventory funding and scrap value, so suppliers need indexed pricing, efficient nesting, scrap recovery and disciplined purchasing to protect conversion margins.

What is driving Copper Busbar growth in data centers?

AI and accelerated computing are increasing power density at rack and facility level. The IEA expects U.S. electricity use to add more than 420 TWh through 2030, with data centers accounting for about half of that increase. Higher current requirements create more demand for busway, PDUs, switchgear and laminated conductors that reduce footprint, losses and installation complexity.

What are the main restraints on the Copper Busbar market?

The main restraints are copper price volatility, aluminum substitution, project-cycle variability and the qualification burden associated with electrical equipment. Aluminum can replace copper in selected current-carrying applications, while large projects can create uneven factory utilization. In addition, changing busbar geometry or material may require equipment retesting because temperature rise, fault forces and clearances can be affected.

Which material and conductor shape lead the market?

Electrolytic Tough Pitch Copper is identified as the leading material composition because it balances conductivity, mechanical properties, availability and cost. Flat Busbar leads the conductor-shape segmentation because its high surface area supports heat dissipation and it integrates efficiently into switchgear and distribution layouts. Oxygen-free copper and custom profiles serve more specialized performance and packaging requirements.

Which companies are profiled in the Copper Busbar market?

The report profiles Pentair, Gindre, Luvata, Oriental Copper, Schneider Electric, ABB, Siemens, Watteredge, Storm Power Components, Aurubis, Metal Gems, Gonda Metal, EMS Industrial and ElvalHalcor. Competition spans integrated electrical-system companies, copper processors and specialist fabricators, with differentiation based on material access, engineering, plating, lamination, custom geometry and global project support.

Research Sources & Evidence Base

View research sources used for this overview.
  1. U.S. Geological Survey. Mineral Commodity Summaries 2026 – Copper, 2025 copper mine and refinery production, price and substitution evidence.
  2. International Energy Agency. Electricity 2026 – Demand, U.S. electricity-demand growth and data-center contribution through 2030.
  3. Siemens. Inside the story of Siemens’ USD 1 billion U.S. manufacturing investment, electrical-equipment manufacturing expansion linked to AI and data centers.
  4. Schneider Electric. AMD Helios AI Factory reference design, July 2026 rack power and facility infrastructure specifications.
  5. Schneider Electric. High-density AI and accelerated compute data-center solutions, June 2025 high-power busway and rack PDU product context.

Copper Busbar Market, Trends, Business Strategies 2026-2036

Get Sample Report PDF for Exclusive Insights

Report Sample Includes

  • Table of Contents
  • List of Tables & Figures
  • Charts, Research Methodology, and more...
Download Sample Report PDF

Download Sample Report

Table of Content

1 Introduction to Research & Analysis Reports
1.1 Copper Busbar Market Definition
1.2 Market Segments
1.2.1 Segment by Type
1.2.2 Segment by Application
1.3 Global Copper Busbar Market Overview
1.4 Features & Benefits of This Report
1.5 Methodology & Sources of Information
1.5.1 Research Methodology
1.5.2 Research Process
1.5.3 Base Year
1.5.4 Report Assumptions & Caveats
2 Global Copper Busbar Overall Market Size
2.1 Global Copper Busbar Market Size: 2024 VS 2032
2.2 Global Copper Busbar Market Size, Prospects & Forecasts: 2020-2032
2.3 Global Copper Busbar Sales: 2020-2032
3 Company Landscape
3.1 Top Copper Busbar Players in Global Market
3.2 Top Global Copper Busbar Companies Ranked by Revenue
3.3 Global Copper Busbar Revenue by Companies
3.4 Global Copper Busbar Sales by Companies
3.5 Global Copper Busbar Price by Manufacturer (2020-2025)
3.6 Top 3 and Top 5 Copper Busbar Companies in Global Market, by Revenue in 2024
3.7 Global Manufacturers Copper Busbar Product Type
3.8 Tier 1, Tier 2, and Tier 3 Copper Busbar Players in Global Market
3.8.1 List of Global Tier 1 Copper Busbar Companies
3.8.2 List of Global Tier 2 and Tier 3 Copper Busbar Companies
4 Sights by Product
4.1 Overview
4.1.1 Segment by Type – Global Copper Busbar Market Size Markets, 2024 & 2032
4.1.2 ETP (Electrolytic Tough Pitch Copper Busbar)
4.1.3 OF (Oxygen-free Copper Busbar)
4.1.4 Others
4.2 Segment by Type – Global Copper Busbar Revenue & Forecasts
4.2.1 Segment by Type – Global Copper Busbar Revenue, 2020-2025
4.2.2 Segment by Type – Global Copper Busbar Revenue, 2026-2032
4.2.3 Segment by Type – Global Copper Busbar Revenue Market Share, 2020-2032
4.3 Segment by Type – Global Copper Busbar Sales & Forecasts
4.3.1 Segment by Type – Global Copper Busbar Sales, 2020-2025
4.3.2 Segment by Type – Global Copper Busbar Sales, 2026-2032
4.3.3 Segment by Type – Global Copper Busbar Sales Market Share, 2020-2032
4.4 Segment by Type – Global Copper Busbar Price (Manufacturers Selling Prices), 2020-2032
5 Sights by Application
5.1 Overview
5.1.1 Segment by Application – Global Copper Busbar Market Size, 2024 & 2032
5.1.2 Industrial Buildings
5.1.3 Commercial Buildings
5.1.4 Civil Buildings
5.1.5 Others
5.2 Segment by Application – Global Copper Busbar Revenue & Forecasts
5.2.1 Segment by Application – Global Copper Busbar Revenue, 2020-2025
5.2.2 Segment by Application – Global Copper Busbar Revenue, 2026-2032
5.2.3 Segment by Application – Global Copper Busbar Revenue Market Share, 2020-2032
5.3 Segment by Application – Global Copper Busbar Sales & Forecasts
5.3.1 Segment by Application – Global Copper Busbar Sales, 2020-2025
5.3.2 Segment by Application – Global Copper Busbar Sales, 2026-2032
5.3.3 Segment by Application – Global Copper Busbar Sales Market Share, 2020-2032
5.4 Segment by Application – Global Copper Busbar Price (Manufacturers Selling Prices), 2020-2032
6 Sights by Region
6.1 By Region – Global Copper Busbar Market Size, 2024 & 2032
6.2 By Region – Global Copper Busbar Revenue & Forecasts
6.2.1 By Region – Global Copper Busbar Revenue, 2020-2025
6.2.2 By Region – Global Copper Busbar Revenue, 2026-2032
6.2.3 By Region – Global Copper Busbar Revenue Market Share, 2020-2032
6.3 By Region – Global Copper Busbar Sales & Forecasts
6.3.1 By Region – Global Copper Busbar Sales, 2020-2025
6.3.2 By Region – Global Copper Busbar Sales, 2026-2032
6.3.3 By Region – Global Copper Busbar Sales Market Share, 2020-2032
6.4 North America
6.4.1 By Country – North America Copper Busbar Revenue, 2020-2032
6.4.2 By Country – North America Copper Busbar Sales, 2020-2032
6.4.3 United States Copper Busbar Market Size, 2020-2032
6.4.4 Canada Copper Busbar Market Size, 2020-2032
6.4.5 Mexico Copper Busbar Market Size, 2020-2032
6.5 Europe
6.5.1 By Country – Europe Copper Busbar Revenue, 2020-2032
6.5.2 By Country – Europe Copper Busbar Sales, 2020-2032
6.5.3 Germany Copper Busbar Market Size, 2020-2032
6.5.4 France Copper Busbar Market Size, 2020-2032
6.5.5 U.K. Copper Busbar Market Size, 2020-2032
6.5.6 Italy Copper Busbar Market Size, 2020-2032
6.5.7 Russia Copper Busbar Market Size, 2020-2032
6.5.8 Nordic Countries Copper Busbar Market Size, 2020-2032
6.5.9 Benelux Copper Busbar Market Size, 2020-2032
6.6 Asia
6.6.1 By Region – Asia Copper Busbar Revenue, 2020-2032
6.6.2 By Region – Asia Copper Busbar Sales, 2020-2032
6.6.3 China Copper Busbar Market Size, 2020-2032
6.6.4 Japan Copper Busbar Market Size, 2020-2032
6.6.5 South Korea Copper Busbar Market Size, 2020-2032
6.6.6 Southeast Asia Copper Busbar Market Size, 2020-2032
6.6.7 India Copper Busbar Market Size, 2020-2032
6.7 South America
6.7.1 By Country – South America Copper Busbar Revenue, 2020-2032
6.7.2 By Country – South America Copper Busbar Sales, 2020-2032
6.7.3 Brazil Copper Busbar Market Size, 2020-2032
6.7.4 Argentina Copper Busbar Market Size, 2020-2032
6.8 Middle East & Africa
6.8.1 By Country – Middle East & Africa Copper Busbar Revenue, 2020-2032
6.8.2 By Country – Middle East & Africa Copper Busbar Sales, 2020-2032
6.8.3 Turkey Copper Busbar Market Size, 2020-2032
6.8.4 Israel Copper Busbar Market Size, 2020-2032
6.8.5 Saudi Arabia Copper Busbar Market Size, 2020-2032
6.8.6 UAE Copper Busbar Market Size, 2020-2032
7 Manufacturers & Brands Profiles
7.1 Oriental Copper
7.1.1 Oriental Copper Company Summary
7.1.2 Oriental Copper Business Overview
7.1.3 Oriental Copper Copper Busbar Major Product Offerings
7.1.4 Oriental Copper Copper Busbar Sales and Revenue in Global (2020-2025)
7.1.5 Oriental Copper Key News & Latest Developments
7.2 Pentair
7.2.1 Pentair Company Summary
7.2.2 Pentair Business Overview
7.2.3 Pentair Copper Busbar Major Product Offerings
7.2.4 Pentair Copper Busbar Sales and Revenue in Global (2020-2025)
7.2.5 Pentair Key News & Latest Developments
7.3 Gindre
7.3.1 Gindre Company Summary
7.3.2 Gindre Business Overview
7.3.3 Gindre Copper Busbar Major Product Offerings
7.3.4 Gindre Copper Busbar Sales and Revenue in Global (2020-2025)
7.3.5 Gindre Key News & Latest Developments
7.4 Schneider
7.4.1 Schneider Company Summary
7.4.2 Schneider Business Overview
7.4.3 Schneider Copper Busbar Major Product Offerings
7.4.4 Schneider Copper Busbar Sales and Revenue in Global (2020-2025)
7.4.5 Schneider Key News & Latest Developments
7.5 Watteredge
7.5.1 Watteredge Company Summary
7.5.2 Watteredge Business Overview
7.5.3 Watteredge Copper Busbar Major Product Offerings
7.5.4 Watteredge Copper Busbar Sales and Revenue in Global (2020-2025)
7.5.5 Watteredge Key News & Latest Developments
7.6 Luvata
7.6.1 Luvata Company Summary
7.6.2 Luvata Business Overview
7.6.3 Luvata Copper Busbar Major Product Offerings
7.6.4 Luvata Copper Busbar Sales and Revenue in Global (2020-2025)
7.6.5 Luvata Key News & Latest Developments
7.7 Baotai
7.7.1 Baotai Company Summary
7.7.2 Baotai Business Overview
7.7.3 Baotai Copper Busbar Major Product Offerings
7.7.4 Baotai Copper Busbar Sales and Revenue in Global (2020-2025)
7.7.5 Baotai Key News & Latest Developments
7.8 Metal Gems
7.8.1 Metal Gems Company Summary
7.8.2 Metal Gems Business Overview
7.8.3 Metal Gems Copper Busbar Major Product Offerings
7.8.4 Metal Gems Copper Busbar Sales and Revenue in Global (2020-2025)
7.8.5 Metal Gems Key News & Latest Developments
7.9 Gonda Metal
7.9.1 Gonda Metal Company Summary
7.9.2 Gonda Metal Business Overview
7.9.3 Gonda Metal Copper Busbar Major Product Offerings
7.9.4 Gonda Metal Copper Busbar Sales and Revenue in Global (2020-2025)
7.9.5 Gonda Metal Key News & Latest Developments
7.10 EMS
7.10.1 EMS Company Summary
7.10.2 EMS Business Overview
7.10.3 EMS Copper Busbar Major Product Offerings
7.10.4 EMS Copper Busbar Sales and Revenue in Global (2020-2025)
7.10.5 EMS Key News & Latest Developments
7.11 Storm Power Components
7.11.1 Storm Power Components Company Summary
7.11.2 Storm Power Components Business Overview
7.11.3 Storm Power Components Copper Busbar Major Product Offerings
7.11.4 Storm Power Components Copper Busbar Sales and Revenue in Global (2020-2025)
7.11.5 Storm Power Components Key News & Latest Developments
8 Global Copper Busbar Production Capacity, Analysis
8.1 Global Copper Busbar Production Capacity, 2020-2032
8.2 Copper Busbar Production Capacity of Key Manufacturers in Global Market
8.3 Global Copper Busbar Production by Region
9 Key Market Trends, Opportunity, Drivers and Restraints
9.1 Market Opportunities & Trends
9.2 Market Drivers
9.3 Market Restraints
10 Copper Busbar Supply Chain Analysis
10.1 Copper Busbar Industry Value Chain
10.2 Copper Busbar Upstream Market
10.3 Copper Busbar Downstream and Clients
10.4 Marketing Channels Analysis
10.4.1 Marketing Channels
10.4.2 Copper Busbar Distributors and Sales Agents in Global
11 Conclusion
12 Appendix
12.1 Note
12.2 Examples of Clients
12.3 DisclaimerList of Tables
Table 1. Key Players of Copper Busbar in Global Market
Table 2. Top Copper Busbar Players in Global Market, Ranking by Revenue (2024)
Table 3. Global Copper Busbar Revenue by Companies, (US$, Mn), 2020-2025
Table 4. Global Copper Busbar Revenue Share by Companies, 2020-2025
Table 5. Global Copper Busbar Sales by Companies, (K Meters), 2020-2025
Table 6. Global Copper Busbar Sales Share by Companies, 2020-2025
Table 7. Key Manufacturers Copper Busbar Price (2020-2025) & (USD/Meter)
Table 8. Global Manufacturers Copper Busbar Product Type
Table 9. List of Global Tier 1 Copper Busbar Companies, Revenue (US$, Mn) in 2024 and Market Share
Table 10. List of Global Tier 2 and Tier 3 Copper Busbar Companies, Revenue (US$, Mn) in 2024 and Market Share
Table 11. Segment by Type – Global Copper Busbar Revenue, (US$, Mn), 2024 & 2032
Table 12. Segment by Type – Global Copper Busbar Revenue (US$, Mn), 2020-2025
Table 13. Segment by Type – Global Copper Busbar Revenue (US$, Mn), 2026-2032
Table 14. Segment by Type – Global Copper Busbar Sales (K Meters), 2020-2025
Table 15. Segment by Type – Global Copper Busbar Sales (K Meters), 2026-2032
Table 16. Segment by Application – Global Copper Busbar Revenue, (US$, Mn), 2024 & 2032
Table 17. Segment by Application – Global Copper Busbar Revenue, (US$, Mn), 2020-2025
Table 18. Segment by Application – Global Copper Busbar Revenue, (US$, Mn), 2026-2032
Table 19. Segment by Application – Global Copper Busbar Sales, (K Meters), 2020-2025
Table 20. Segment by Application – Global Copper Busbar Sales, (K Meters), 2026-2032
Table 21. By Region – Global Copper Busbar Revenue, (US$, Mn), 2025-2032
Table 22. By Region – Global Copper Busbar Revenue, (US$, Mn), 2020-2025
Table 23. By Region – Global Copper Busbar Revenue, (US$, Mn), 2026-2032
Table 24. By Region – Global Copper Busbar Sales, (K Meters), 2020-2025
Table 25. By Region – Global Copper Busbar Sales, (K Meters), 2026-2032
Table 26. By Country – North America Copper Busbar Revenue, (US$, Mn), 2020-2025
Table 27. By Country – North America Copper Busbar Revenue, (US$, Mn), 2026-2032
Table 28. By Country – North America Copper Busbar Sales, (K Meters), 2020-2025
Table 29. By Country – North America Copper Busbar Sales, (K Meters), 2026-2032
Table 30. By Country – Europe Copper Busbar Revenue, (US$, Mn), 2020-2025
Table 31. By Country – Europe Copper Busbar Revenue, (US$, Mn), 2026-2032
Table 32. By Country – Europe Copper Busbar Sales, (K Meters), 2020-2025
Table 33. By Country – Europe Copper Busbar Sales, (K Meters), 2026-2032
Table 34. By Region – Asia Copper Busbar Revenue, (US$, Mn), 2020-2025
Table 35. By Region – Asia Copper Busbar Revenue, (US$, Mn), 2026-2032
Table 36. By Region – Asia Copper Busbar Sales, (K Meters), 2020-2025
Table 37. By Region – Asia Copper Busbar Sales, (K Meters), 2026-2032
Table 38. By Country – South America Copper Busbar Revenue, (US$, Mn), 2020-2025
Table 39. By Country – South America Copper Busbar Revenue, (US$, Mn), 2026-2032
Table 40. By Country – South America Copper Busbar Sales, (K Meters), 2020-2025
Table 41. By Country – South America Copper Busbar Sales, (K Meters), 2026-2032
Table 42. By Country – Middle East & Africa Copper Busbar Revenue, (US$, Mn), 2020-2025
Table 43. By Country – Middle East & Africa Copper Busbar Revenue, (US$, Mn), 2026-2032
Table 44. By Country – Middle East & Africa Copper Busbar Sales, (K Meters), 2020-2025
Table 45. By Country – Middle East & Africa Copper Busbar Sales, (K Meters), 2026-2032
Table 46. Oriental Copper Company Summary
Table 47. Oriental Copper Copper Busbar Product Offerings
Table 48. Oriental Copper Copper Busbar Sales (K Meters), Revenue (US$, Mn) and Average Price (USD/Meter) & (2020-2025)
Table 49. Oriental Copper Key News & Latest Developments
Table 50. Pentair Company Summary
Table 51. Pentair Copper Busbar Product Offerings
Table 52. Pentair Copper Busbar Sales (K Meters), Revenue (US$, Mn) and Average Price (USD/Meter) & (2020-2025)
Table 53. Pentair Key News & Latest Developments
Table 54. Gindre Company Summary
Table 55. Gindre Copper Busbar Product Offerings
Table 56. Gindre Copper Busbar Sales (K Meters), Revenue (US$, Mn) and Average Price (USD/Meter) & (2020-2025)
Table 57. Gindre Key News & Latest Developments
Table 58. Schneider Company Summary
Table 59. Schneider Copper Busbar Product Offerings
Table 60. Schneider Copper Busbar Sales (K Meters), Revenue (US$, Mn) and Average Price (USD/Meter) & (2020-2025)
Table 61. Schneider Key News & Latest Developments
Table 62. Watteredge Company Summary
Table 63. Watteredge Copper Busbar Product Offerings
Table 64. Watteredge Copper Busbar Sales (K Meters), Revenue (US$, Mn) and Average Price (USD/Meter) & (2020-2025)
Table 65. Watteredge Key News & Latest Developments
Table 66. Luvata Company Summary
Table 67. Luvata Copper Busbar Product Offerings
Table 68. Luvata Copper Busbar Sales (K Meters), Revenue (US$, Mn) and Average Price (USD/Meter) & (2020-2025)
Table 69. Luvata Key News & Latest Developments
Table 70. Baotai Company Summary
Table 71. Baotai Copper Busbar Product Offerings
Table 72. Baotai Copper Busbar Sales (K Meters), Revenue (US$, Mn) and Average Price (USD/Meter) & (2020-2025)
Table 73. Baotai Key News & Latest Developments
Table 74. Metal Gems Company Summary
Table 75. Metal Gems Copper Busbar Product Offerings
Table 76. Metal Gems Copper Busbar Sales (K Meters), Revenue (US$, Mn) and Average Price (USD/Meter) & (2020-2025)
Table 77. Metal Gems Key News & Latest Developments
Table 78. Gonda Metal Company Summary
Table 79. Gonda Metal Copper Busbar Product Offerings
Table 80. Gonda Metal Copper Busbar Sales (K Meters), Revenue (US$, Mn) and Average Price (USD/Meter) & (2020-2025)
Table 81. Gonda Metal Key News & Latest Developments
Table 82. EMS Company Summary
Table 83. EMS Copper Busbar Product Offerings
Table 84. EMS Copper Busbar Sales (K Meters), Revenue (US$, Mn) and Average Price (USD/Meter) & (2020-2025)
Table 85. EMS Key News & Latest Developments
Table 86. Storm Power Components Company Summary
Table 87. Storm Power Components Copper Busbar Product Offerings
Table 88. Storm Power Components Copper Busbar Sales (K Meters), Revenue (US$, Mn) and Average Price (USD/Meter) & (2020-2025)
Table 89. Storm Power Components Key News & Latest Developments
Table 90. Copper Busbar Capacity of Key Manufacturers in Global Market, 2023-2025 (K Meters)
Table 91. Global Copper Busbar Capacity Market Share of Key Manufacturers, 2023-2025
Table 92. Global Copper Busbar Production by Region, 2020-2025 (K Meters)
Table 93. Global Copper Busbar Production by Region, 2026-2032 (K Meters)
Table 94. Copper Busbar Market Opportunities & Trends in Global Market
Table 95. Copper Busbar Market Drivers in Global Market
Table 96. Copper Busbar Market Restraints in Global Market
Table 97. Copper Busbar Raw Materials
Table 98. Copper Busbar Raw Materials Suppliers in Global Market
Table 99. Typical Copper Busbar Downstream
Table 100. Copper Busbar Downstream Clients in Global Market
Table 101. Copper Busbar Distributors and Sales Agents in Global Market

List of Figures
Figure 1. Copper Busbar Product Picture
Figure 2. Copper Busbar Segment by Type in 2024
Figure 3. Copper Busbar Segment by Application in 2024
Figure 4. Global Copper Busbar Market Overview: 2024
Figure 5. Key Caveats
Figure 6. Global Copper Busbar Market Size: 2024 VS 2032 (US$, Mn)
Figure 7. Global Copper Busbar Revenue: 2020-2032 (US$, Mn)
Figure 8. Copper Busbar Sales in Global Market: 2020-2032 (K Meters)
Figure 9. The Top 3 and 5 Players Market Share by Copper Busbar Revenue in 2024
Figure 10. Segment by Type – Global Copper Busbar Revenue, (US$, Mn), 2024 & 2032
Figure 11. Segment by Type – Global Copper Busbar Revenue Market Share, 2020-2032
Figure 12. Segment by Type – Global Copper Busbar Sales Market Share, 2020-2032
Figure 13. Segment by Type – Global Copper Busbar Price (USD/Meter), 2020-2032
Figure 14. Segment by Application – Global Copper Busbar Revenue, (US$, Mn), 2024 & 2032
Figure 15. Segment by Application – Global Copper Busbar Revenue Market Share, 2020-2032
Figure 16. Segment by Application – Global Copper Busbar Sales Market Share, 2020-2032
Figure 17. Segment by Application -Global Copper Busbar Price (USD/Meter), 2020-2032
Figure 18. By Region – Global Copper Busbar Revenue, (US$, Mn), 2025 & 2032
Figure 19. By Region – Global Copper Busbar Revenue Market Share, 2020 VS 2024 VS 2032
Figure 20. By Region – Global Copper Busbar Revenue Market Share, 2020-2032
Figure 21. By Region – Global Copper Busbar Sales Market Share, 2020-2032
Figure 22. By Country – North America Copper Busbar Revenue Market Share, 2020-2032
Figure 23. By Country – North America Copper Busbar Sales Market Share, 2020-2032
Figure 24. United States Copper Busbar Revenue, (US$, Mn), 2020-2032
Figure 25. Canada Copper Busbar Revenue, (US$, Mn), 2020-2032
Figure 26. Mexico Copper Busbar Revenue, (US$, Mn), 2020-2032
Figure 27. By Country – Europe Copper Busbar Revenue Market Share, 2020-2032
Figure 28. By Country – Europe Copper Busbar Sales Market Share, 2020-2032
Figure 29. Germany Copper Busbar Revenue, (US$, Mn), 2020-2032
Figure 30. France Copper Busbar Revenue, (US$, Mn), 2020-2032
Figure 31. U.K. Copper Busbar Revenue, (US$, Mn), 2020-2032
Figure 32. Italy Copper Busbar Revenue, (US$, Mn), 2020-2032
Figure 33. Russia Copper Busbar Revenue, (US$, Mn), 2020-2032
Figure 34. Nordic Countries Copper Busbar Revenue, (US$, Mn), 2020-2032
Figure 35. Benelux Copper Busbar Revenue, (US$, Mn), 2020-2032
Figure 36. By Region – Asia Copper Busbar Revenue Market Share, 2020-2032
Figure 37. By Region – Asia Copper Busbar Sales Market Share, 2020-2032
Figure 38. China Copper Busbar Revenue, (US$, Mn), 2020-2032
Figure 39. Japan Copper Busbar Revenue, (US$, Mn), 2020-2032
Figure 40. South Korea Copper Busbar Revenue, (US$, Mn), 2020-2032
Figure 41. Southeast Asia Copper Busbar Revenue, (US$, Mn), 2020-2032
Figure 42. India Copper Busbar Revenue, (US$, Mn), 2020-2032
Figure 43. By Country – South America Copper Busbar Revenue Market Share, 2020-2032
Figure 44. By Country – South America Copper Busbar Sales, Market Share, 2020-2032
Figure 45. Brazil Copper Busbar Revenue, (US$, Mn), 2020-2032
Figure 46. Argentina Copper Busbar Revenue, (US$, Mn), 2020-2032
Figure 47. By Country – Middle East & Africa Copper Busbar Revenue, Market Share, 2020-2032
Figure 48. By Country – Middle East & Africa Copper Busbar Sales, Market Share, 2020-2032
Figure 49. Turkey Copper Busbar Revenue, (US$, Mn), 2020-2032
Figure 50. Israel Copper Busbar Revenue, (US$, Mn), 2020-2032
Figure 51. Saudi Arabia Copper Busbar Revenue, (US$, Mn), 2020-2032
Figure 52. UAE Copper Busbar Revenue, (US$, Mn), 2020-2032
Figure 53. Global Copper Busbar Production Capacity (K Meters), 2020-2032
Figure 54. The Percentage of Production Copper Busbar by Region, 2024 VS 2032
Figure 55. Copper Busbar Industry Value Chain
Figure 56. Marketing Channels