Wireless Handheld Spectrometer Market Trends, Business Strategies 2025-2032

Global Wireless Handheld Spectrometer market size was estimated at USD 1836 million in 2023 and is projected to reach USD 3579.43 million by 2032, exhibiting a CAGR of 7.70% during the forecast period.

PDF Icon Download Sample Report PDF
  • Quick Dispatch

    All Orders

  • Secure Payment

    100% Secure Payment

Compare

$1,500.00$4,250.00

Clear

Wireless Handheld Spectrometer Market Overview

FTIR, NIR and Raman spectrometers are very common in a majority of R&D facilities. Spectrometers are used to for a number of applications that include identification of bulk materials, checking contamination, ensuring intermediates are processing as expected and for confirming that the final product is within the required specifications. However, most of these spectrometers are confined to the lab as they are large but not portable. Thus, it would take at least two days for a sample to be sent to the lab, get processed and reports to be presented. With the introduction of the wireless handheld spectrometers the results can now be available almost instantly on a smart phone.

This report provides a deep insight into the global Wireless Handheld Spectrometer market covering all its essential aspects. This ranges from a macro overview of the market to micro details of the market size, competitive landscape, development trend, niche market, key market drivers and challenges, SWOT analysis, value chain analysis, etc.

The analysis helps the reader to shape the competition within the industries and strategies for the competitive environment to enhance the potential profit. Furthermore, it provides a simple framework for evaluating and accessing the position of the business organization. The report structure also focuses on the competitive landscape of the Global Wireless Handheld Spectrometer Market, this report introduces in detail the market share, market performance, product situation, operation situation, etc. of the main players, which helps the readers in the industry to identify the main competitors and deeply understand the competition pattern of the market.
In a word, this report is a must-read for industry players, investors, researchers, consultants, business strategists, and all those who have any kind of stake or are planning to foray into the Wireless Handheld Spectrometer market in any manner.

Wireless Handheld Spectrometer Market Analysis:

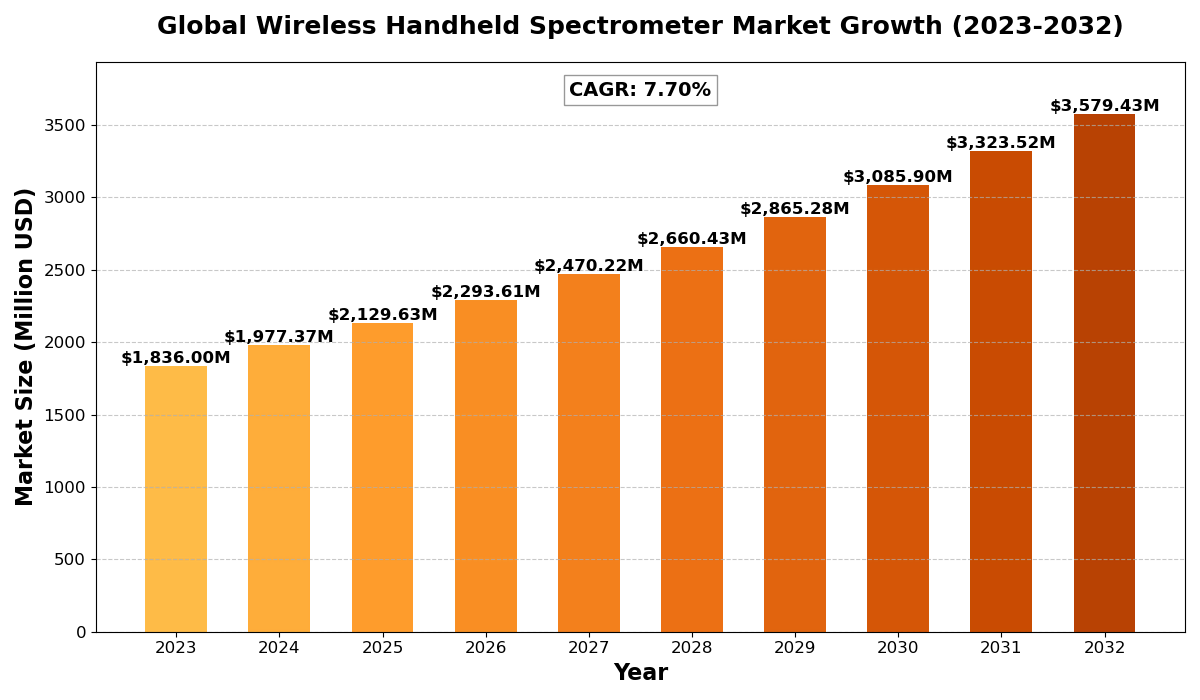
The global Wireless Handheld Spectrometer market size was estimated at USD 1836 million in 2023 and is projected to reach USD 3579.43 million by 2032, exhibiting a CAGR of 7.70% during the forecast period.

North America Wireless Handheld Spectrometer market size was estimated at USD 543.64 million in 2023, at a CAGR of 6.60% during the forecast period of 2025 through 2032.

Wireless Handheld Spectrometer Key Market Trends  :

  1. Rising demand for real-time chemical analysis
    Industries such as pharmaceuticals, food safety, and forensics require instant material identification, driving the adoption of wireless handheld spectrometers.

  2. Integration of AI and machine learning
    Advanced AI-driven spectral analysis improves accuracy, enabling automated substance identification and reducing human error.

  3. Growth in environmental and agricultural applications
    Farmers and environmental agencies use spectrometers for soil analysis, contamination detection, and nutrient assessment, boosting market expansion.

  4. Enhanced wireless connectivity and cloud-based data sharing
    New spectrometer models feature 5G, Bluetooth, and IoT integration, allowing users to share and analyze data remotely.

  5. Miniaturization and improved battery efficiency
    Advances in compact designs and longer battery life enhance usability, making spectrometers more practical for field applications.

Wireless Handheld Spectrometer Market Regional Analysis :

semi insight

  • North America:Strong demand driven by EVs, 5G infrastructure, and renewable energy, with the U.S. leading the market.
  • Europe:Growth fueled by automotive electrification, renewable energy, and strong regulatory support, with Germany as a key player.
  • Asia-Pacific:Dominates the market due to large-scale manufacturing in China and Japan, with growing demand from EVs, 5G, and semiconductors.
  • South America:Emerging market, driven by renewable energy and EV adoption, with Brazil leading growth.
  • Middle East & Africa:Gradual growth, mainly due to investments in renewable energy and EV infrastructure, with Saudi Arabia and UAE as key contributors.

Wireless Handheld Spectrometer Market Segmentation :

The research report includes specific segments by region (country), manufacturers, Type, and Application. Market segmentation creates subsets of a market based on product type, end-user or application, Geographic, and other factors. By understanding the market segments, the decision-maker can leverage this targeting in the product, sales, and marketing strategies. Market segments can power your product development cycles by informing how you create product offerings for different segments.

Key Company

  • Phison Group (UPRtek)
  • Carl Zeiss
  • Thomson Group
  • Thermo Fisher Scientific
  • Pasco Corporation
  • Bruker Daltonics
  • Designs and Prototypes
  • Midac Corporation
  • Grabner Instruments
  • Surface Optics Corp
  • GASMET Technologies

Market Segmentation (by Type)

  • FTRI
  • NIR
  • Raman
  • Others

Market Segmentation (by Application)

  • Material Chemistry
  • Drug Discovery
  • Life Science
  • Forensic Science
  • Environmental Testing
  • Food and Agriculture
  • Others

Drivers

  • Increasing need for portable and on-site analysis
    Industries require immediate, reliable testing without laboratory dependencies, driving demand for handheld spectrometers.

  • Expanding pharmaceutical and food safety regulations
    Strict global regulations mandate rapid quality control and material verification, fueling market growth.

  • Technological advancements in spectroscopy
    Miniaturized sensors, AI integration, and real-time data sharing are making spectrometers more efficient and accessible.

Restraints

  • High initial investment and maintenance costs
    Advanced spectroscopy technology requires significant upfront costs and periodic calibration, limiting adoption in small businesses.

  • Limited spectral range and accuracy in certain models
    Some handheld spectrometers lack the precision of laboratory-grade instruments, affecting their application in high-precision industries.

  • Data security and connectivity concerns
    Cloud-based spectrometer systems face risks of data breaches, requiring strong cybersecurity measures.

Opportunities

  • Rising demand in forensic and law enforcement applications
    Handheld spectrometers aid in drug detection, counterfeit identification, and crime scene analysis, creating new growth opportunities.

  • Adoption in emerging markets
    Developing regions are embracing portable spectrometers for agriculture, mining, and industrial quality control.

  • Development of multi-functional and hybrid spectrometers
    Companies are investing in multi-spectral and hybrid technology, expanding the usability of spectrometers across industries.

Challenges

  • Need for skilled personnel for accurate analysis
    Users must have technical expertise to interpret spectral data correctly, limiting widespread adoption.

  • Competition from benchtop and traditional spectrometers
    Many industries still prefer high-precision, laboratory-grade spectrometers, challenging the growth of handheld models.

  • Regulatory compliance and standardization issues
    Varying industry standards for spectral analysis and material testing create challenges in global adoption.

Key Benefits of This Market Research:

  • Industry drivers, restraints, and opportunities covered in the study
  • Neutral perspective on the market performance
  • Recent industry trends and developments
  • Competitive landscape & strategies of key players
  • Potential & niche segments and regions exhibiting promising growth covered
  • Historical, current, and projected market size, in terms of value
  • In-depth analysis of the Wireless Handheld Spectrometer Market
  • Overview of the regional outlook of the Wireless Handheld Spectrometer Market:

Key Reasons to Buy this Report:

  • Access to date statistics compiled by our researchers. These provide you with historical and forecast data, which is analyzed to tell you why your market is set to change
  • This enables you to anticipate market changes to remain ahead of your competitors
  • You will be able to copy data from the Excel spreadsheet straight into your marketing plans, business presentations, or other strategic documents
  • The concise analysis, clear graph, and table format will enable you to pinpoint the information you require quickly
  • Provision of market value data for each segment and sub-segment
  • Indicates the region and segment that is expected to witness the fastest growth as well as to dominate the market
  • Provides insight into the market through Value Chain
  • Market dynamics scenario, along with growth opportunities of the market in the years to come
  • 6-month post-sales analyst support

Customization of the Report
In case of any queries or customization requirements, please connect with our sales team, who will ensure that your requirements are met.

FAQs

Q: What are the key driving factors and opportunities in the Wireless Handheld Spectrometer market?
A: The market is driven by the demand for real-time chemical analysis, increasing regulatory requirements, and advancements in AI and wireless connectivity. Opportunities include expansion in forensic applications, emerging markets, and multi-functional spectrometer development.


Q: Which region is projected to have the largest market share?
A: North America is expected to lead due to strong adoption in pharmaceuticals, food safety, and forensic science, followed by Asia-Pacific, where industrial and agricultural applications are rising.


Q: Who are the top players in the global Wireless Handheld Spectrometer market?
A: Key players include Thermo Fisher Scientific, Bruker, Agilent Technologies, Metrohm, and SciAps, among others.


Q: What are the latest technological advancements in the industry?
A: Innovations include AI-powered spectral analysis, cloud-based data sharing, enhanced battery efficiency, and hybrid spectrometry combining multiple wavelengths for better accuracy.


Q: What is the current size of the global Wireless Handheld Spectrometer market?
A: The market is expected to grow significantly from 2025-2032, driven by rising demand in pharmaceuticals, food safety, and environmental monitoring.

Wireless Handheld Spectrometer Market Trends, Business Strategies 2025-2032

Get Sample Report PDF for Exclusive Insights

Report Sample Includes

  • Table of Contents
  • List of Tables & Figures
  • Charts, Research Methodology, and more...
PDF Icon Download Sample Report PDF

Download Sample Report

Table of Content

Table of Contents
1 Research Methodology and Statistical Scope
1.1 Market Definition and Statistical Scope of Wireless Handheld Spectrometer
1.2 Key Market Segments
1.2.1 Wireless Handheld Spectrometer Segment by Type
1.2.2 Wireless Handheld Spectrometer Segment by Application
1.3 Methodology & Sources of Information
1.3.1 Research Methodology
1.3.2 Research Process
1.3.3 Market Breakdown and Data Triangulation
1.3.4 Base Year
1.3.5 Report Assumptions & Caveats
2 Wireless Handheld Spectrometer Market Overview
2.1 Global Market Overview
2.1.1 Global Wireless Handheld Spectrometer Market Size (M USD) Estimates and Forecasts (2019-2032)
2.1.2 Global Wireless Handheld Spectrometer Sales Estimates and Forecasts (2019-2032)
2.2 Market Segment Executive Summary
2.3 Global Market Size by Region
3 Wireless Handheld Spectrometer Market Competitive Landscape
3.1 Global Wireless Handheld Spectrometer Sales by Manufacturers (2019-2025)
3.2 Global Wireless Handheld Spectrometer Revenue Market Share by Manufacturers (2019-2025)
3.3 Wireless Handheld Spectrometer Market Share by Company Type (Tier 1, Tier 2, and Tier 3)
3.4 Global Wireless Handheld Spectrometer Average Price by Manufacturers (2019-2025)
3.5 Manufacturers Wireless Handheld Spectrometer Sales Sites, Area Served, Product Type
3.6 Wireless Handheld Spectrometer Market Competitive Situation and Trends
3.6.1 Wireless Handheld Spectrometer Market Concentration Rate
3.6.2 Global 5 and 10 Largest Wireless Handheld Spectrometer Players Market Share by Revenue
3.6.3 Mergers & Acquisitions, Expansion
4 Wireless Handheld Spectrometer Industry Chain Analysis
4.1 Wireless Handheld Spectrometer Industry Chain Analysis
4.2 Market Overview of Key Raw Materials
4.3 Midstream Market Analysis
4.4 Downstream Customer Analysis
5 The Development and Dynamics of Wireless Handheld Spectrometer Market
5.1 Key Development Trends
5.2 Driving Factors
5.3 Market Challenges
5.4 Market Restraints
5.5 Industry News
5.5.1 New Product Developments
5.5.2 Mergers & Acquisitions
5.5.3 Expansions
5.5.4 Collaboration/Supply Contracts
5.6 Industry Policies
6 Wireless Handheld Spectrometer Market Segmentation by Type
6.1 Evaluation Matrix of Segment Market Development Potential (Type)
6.2 Global Wireless Handheld Spectrometer Sales Market Share by Type (2019-2025)
6.3 Global Wireless Handheld Spectrometer Market Size Market Share by Type (2019-2025)
6.4 Global Wireless Handheld Spectrometer Price by Type (2019-2025)
7 Wireless Handheld Spectrometer Market Segmentation by Application
7.1 Evaluation Matrix of Segment Market Development Potential (Application)
7.2 Global Wireless Handheld Spectrometer Market Sales by Application (2019-2025)
7.3 Global Wireless Handheld Spectrometer Market Size (M USD) by Application (2019-2025)
7.4 Global Wireless Handheld Spectrometer Sales Growth Rate by Application (2019-2025)
8 Wireless Handheld Spectrometer Market Consumption by Region
8.1 Global Wireless Handheld Spectrometer Sales by Region
8.1.1 Global Wireless Handheld Spectrometer Sales by Region
8.1.2 Global Wireless Handheld Spectrometer Sales Market Share by Region
8.2 North America
8.2.1 North America Wireless Handheld Spectrometer Sales by Country
8.2.2 U.S.
8.2.3 Canada
8.2.4 Mexico
8.3 Europe
8.3.1 Europe Wireless Handheld Spectrometer Sales by Country
8.3.2 Germany
8.3.3 France
8.3.4 U.K.
8.3.5 Italy
8.3.6 Russia
8.4 Asia Pacific
8.4.1 Asia Pacific Wireless Handheld Spectrometer Sales by Region
8.4.2 China
8.4.3 Japan
8.4.4 South Korea
8.4.5 India
8.4.6 Southeast Asia
8.5 South America
8.5.1 South America Wireless Handheld Spectrometer Sales by Country
8.5.2 Brazil
8.5.3 Argentina
8.5.4 Columbia
8.6 Middle East and Africa
8.6.1 Middle East and Africa Wireless Handheld Spectrometer Sales by Region
8.6.2 Saudi Arabia
8.6.3 UAE
8.6.4 Egypt
8.6.5 Nigeria
8.6.6 South Africa
9 Wireless Handheld Spectrometer Market Production by Region
9.1 Global Production of Wireless Handheld Spectrometer by Region (2019-2025)
9.2 Global Wireless Handheld Spectrometer Revenue Market Share by Region (2019-2025)
9.3 Global Wireless Handheld Spectrometer Production, Revenue, Price and Gross Margin (2019-2025)
9.4 North America Wireless Handheld Spectrometer Production
9.4.1 North America Wireless Handheld Spectrometer Production Growth Rate (2019-2025)
9.4.2 North America Wireless Handheld Spectrometer Production, Revenue, Price and Gross Margin (2019-2025)
9.5 Europe Wireless Handheld Spectrometer Production
9.5.1 Europe Wireless Handheld Spectrometer Production Growth Rate (2019-2025)
9.5.2 Europe Wireless Handheld Spectrometer Production, Revenue, Price and Gross Margin (2019-2025)
9.6 Japan Wireless Handheld Spectrometer Production (2019-2025)
9.6.1 Japan Wireless Handheld Spectrometer Production Growth Rate (2019-2025)
9.6.2 Japan Wireless Handheld Spectrometer Production, Revenue, Price and Gross Margin (2019-2025)
9.7 China Wireless Handheld Spectrometer Production (2019-2025)
9.7.1 China Wireless Handheld Spectrometer Production Growth Rate (2019-2025)
9.7.2 China Wireless Handheld Spectrometer Production, Revenue, Price and Gross Margin (2019-2025)
10 Key Companies Profile
10.1 Phison Group (UPRtek)
10.1.1 Phison Group (UPRtek) Wireless Handheld Spectrometer Basic Information
10.1.2 Phison Group (UPRtek) Wireless Handheld Spectrometer Product Overview
10.1.3 Phison Group (UPRtek) Wireless Handheld Spectrometer Product Market Performance
10.1.4 Phison Group (UPRtek) Business Overview
10.1.5 Phison Group (UPRtek) Wireless Handheld Spectrometer SWOT Analysis
10.1.6 Phison Group (UPRtek) Recent Developments
10.2 Carl Zeiss
10.2.1 Carl Zeiss Wireless Handheld Spectrometer Basic Information
10.2.2 Carl Zeiss Wireless Handheld Spectrometer Product Overview
10.2.3 Carl Zeiss Wireless Handheld Spectrometer Product Market Performance
10.2.4 Carl Zeiss Business Overview
10.2.5 Carl Zeiss Wireless Handheld Spectrometer SWOT Analysis
10.2.6 Carl Zeiss Recent Developments
10.3 Thomson Group
10.3.1 Thomson Group Wireless Handheld Spectrometer Basic Information
10.3.2 Thomson Group Wireless Handheld Spectrometer Product Overview
10.3.3 Thomson Group Wireless Handheld Spectrometer Product Market Performance
10.3.4 Thomson Group Wireless Handheld Spectrometer SWOT Analysis
10.3.5 Thomson Group Business Overview
10.3.6 Thomson Group Recent Developments
10.4 Thermo Fisher Scientific
10.4.1 Thermo Fisher Scientific Wireless Handheld Spectrometer Basic Information
10.4.2 Thermo Fisher Scientific Wireless Handheld Spectrometer Product Overview
10.4.3 Thermo Fisher Scientific Wireless Handheld Spectrometer Product Market Performance
10.4.4 Thermo Fisher Scientific Business Overview
10.4.5 Thermo Fisher Scientific Recent Developments
10.5 Pasco Corporation
10.5.1 Pasco Corporation Wireless Handheld Spectrometer Basic Information
10.5.2 Pasco Corporation Wireless Handheld Spectrometer Product Overview
10.5.3 Pasco Corporation Wireless Handheld Spectrometer Product Market Performance
10.5.4 Pasco Corporation Business Overview
10.5.5 Pasco Corporation Recent Developments
10.6 Bruker Daltonics
10.6.1 Bruker Daltonics Wireless Handheld Spectrometer Basic Information
10.6.2 Bruker Daltonics Wireless Handheld Spectrometer Product Overview
10.6.3 Bruker Daltonics Wireless Handheld Spectrometer Product Market Performance
10.6.4 Bruker Daltonics Business Overview
10.6.5 Bruker Daltonics Recent Developments
10.7 Designs and Prototypes
10.7.1 Designs and Prototypes Wireless Handheld Spectrometer Basic Information
10.7.2 Designs and Prototypes Wireless Handheld Spectrometer Product Overview
10.7.3 Designs and Prototypes Wireless Handheld Spectrometer Product Market Performance
10.7.4 Designs and Prototypes Business Overview
10.7.5 Designs and Prototypes Recent Developments
10.8 Midac Corporation
10.8.1 Midac Corporation Wireless Handheld Spectrometer Basic Information
10.8.2 Midac Corporation Wireless Handheld Spectrometer Product Overview
10.8.3 Midac Corporation Wireless Handheld Spectrometer Product Market Performance
10.8.4 Midac Corporation Business Overview
10.8.5 Midac Corporation Recent Developments
10.9 Grabner Instruments
10.9.1 Grabner Instruments Wireless Handheld Spectrometer Basic Information
10.9.2 Grabner Instruments Wireless Handheld Spectrometer Product Overview
10.9.3 Grabner Instruments Wireless Handheld Spectrometer Product Market Performance
10.9.4 Grabner Instruments Business Overview
10.9.5 Grabner Instruments Recent Developments
10.10 Surface Optics Corp
10.10.1 Surface Optics Corp Wireless Handheld Spectrometer Basic Information
10.10.2 Surface Optics Corp Wireless Handheld Spectrometer Product Overview
10.10.3 Surface Optics Corp Wireless Handheld Spectrometer Product Market Performance
10.10.4 Surface Optics Corp Business Overview
10.10.5 Surface Optics Corp Recent Developments
10.11 GASMET Technologies
10.11.1 GASMET Technologies Wireless Handheld Spectrometer Basic Information
10.11.2 GASMET Technologies Wireless Handheld Spectrometer Product Overview
10.11.3 GASMET Technologies Wireless Handheld Spectrometer Product Market Performance
10.11.4 GASMET Technologies Business Overview
10.11.5 GASMET Technologies Recent Developments
11 Wireless Handheld Spectrometer Market Forecast by Region
11.1 Global Wireless Handheld Spectrometer Market Size Forecast
11.2 Global Wireless Handheld Spectrometer Market Forecast by Region
11.2.1 North America Market Size Forecast by Country
11.2.2 Europe Wireless Handheld Spectrometer Market Size Forecast by Country
11.2.3 Asia Pacific Wireless Handheld Spectrometer Market Size Forecast by Region
11.2.4 South America Wireless Handheld Spectrometer Market Size Forecast by Country
11.2.5 Middle East and Africa Forecasted Consumption of Wireless Handheld Spectrometer by Country
12 Forecast Market by Type and by Application (2025-2032)
12.1 Global Wireless Handheld Spectrometer Market Forecast by Type (2025-2032)
12.1.1 Global Forecasted Sales of Wireless Handheld Spectrometer by Type (2025-2032)
12.1.2 Global Wireless Handheld Spectrometer Market Size Forecast by Type (2025-2032)
12.1.3 Global Forecasted Price of Wireless Handheld Spectrometer by Type (2025-2032)
12.2 Global Wireless Handheld Spectrometer Market Forecast by Application (2025-2032)
12.2.1 Global Wireless Handheld Spectrometer Sales (K Units) Forecast by Application
12.2.2 Global Wireless Handheld Spectrometer Market Size (M USD) Forecast by Application (2025-2032)
13 Conclusion and Key FindingsList of Tables
Table 1. Introduction of the Type
Table 2. Introduction of the Application
Table 3. Market Size (M USD) Segment Executive Summary
Table 4. Wireless Handheld Spectrometer Market Size Comparison by Region (M USD)
Table 5. Global Wireless Handheld Spectrometer Sales (K Units) by Manufacturers (2019-2025)
Table 6. Global Wireless Handheld Spectrometer Sales Market Share by Manufacturers (2019-2025)
Table 7. Global Wireless Handheld Spectrometer Revenue (M USD) by Manufacturers (2019-2025)
Table 8. Global Wireless Handheld Spectrometer Revenue Share by Manufacturers (2019-2025)
Table 9. Company Type (Tier 1, Tier 2, and Tier 3) & (based on the Revenue in Wireless Handheld Spectrometer as of 2022)
Table 10. Global Market Wireless Handheld Spectrometer Average Price (USD/Unit) of Key Manufacturers (2019-2025)
Table 11. Manufacturers Wireless Handheld Spectrometer Sales Sites and Area Served
Table 12. Manufacturers Wireless Handheld Spectrometer Product Type
Table 13. Global Wireless Handheld Spectrometer Manufacturers Market Concentration Ratio (CR5 and HHI)
Table 14. Mergers & Acquisitions, Expansion Plans
Table 15. Industry Chain Map of Wireless Handheld Spectrometer
Table 16. Market Overview of Key Raw Materials
Table 17. Midstream Market Analysis
Table 18. Downstream Customer Analysis
Table 19. Key Development Trends
Table 20. Driving Factors
Table 21. Wireless Handheld Spectrometer Market Challenges
Table 22. Global Wireless Handheld Spectrometer Sales by Type (K Units)
Table 23. Global Wireless Handheld Spectrometer Market Size by Type (M USD)
Table 24. Global Wireless Handheld Spectrometer Sales (K Units) by Type (2019-2025)
Table 25. Global Wireless Handheld Spectrometer Sales Market Share by Type (2019-2025)
Table 26. Global Wireless Handheld Spectrometer Market Size (M USD) by Type (2019-2025)
Table 27. Global Wireless Handheld Spectrometer Market Size Share by Type (2019-2025)
Table 28. Global Wireless Handheld Spectrometer Price (USD/Unit) by Type (2019-2025)
Table 29. Global Wireless Handheld Spectrometer Sales (K Units) by Application
Table 30. Global Wireless Handheld Spectrometer Market Size by Application
Table 31. Global Wireless Handheld Spectrometer Sales by Application (2019-2025) & (K Units)
Table 32. Global Wireless Handheld Spectrometer Sales Market Share by Application (2019-2025)
Table 33. Global Wireless Handheld Spectrometer Sales by Application (2019-2025) & (M USD)
Table 34. Global Wireless Handheld Spectrometer Market Share by Application (2019-2025)
Table 35. Global Wireless Handheld Spectrometer Sales Growth Rate by Application (2019-2025)
Table 36. Global Wireless Handheld Spectrometer Sales by Region (2019-2025) & (K Units)
Table 37. Global Wireless Handheld Spectrometer Sales Market Share by Region (2019-2025)
Table 38. North America Wireless Handheld Spectrometer Sales by Country (2019-2025) & (K Units)
Table 39. Europe Wireless Handheld Spectrometer Sales by Country (2019-2025) & (K Units)
Table 40. Asia Pacific Wireless Handheld Spectrometer Sales by Region (2019-2025) & (K Units)
Table 41. South America Wireless Handheld Spectrometer Sales by Country (2019-2025) & (K Units)
Table 42. Middle East and Africa Wireless Handheld Spectrometer Sales by Region (2019-2025) & (K Units)
Table 43. Global Wireless Handheld Spectrometer Production (K Units) by Region (2019-2025)
Table 44. Global Wireless Handheld Spectrometer Revenue (US$ Million) by Region (2019-2025)
Table 45. Global Wireless Handheld Spectrometer Revenue Market Share by Region (2019-2025)
Table 46. Global Wireless Handheld Spectrometer Production (K Units), Revenue (US$ Million), Price (USD/Unit) and Gross Margin (2019-2025)
Table 47. North America Wireless Handheld Spectrometer Production (K Units), Revenue (US$ Million), Price (USD/Unit) and Gross Margin (2019-2025)
Table 48. Europe Wireless Handheld Spectrometer Production (K Units), Revenue (US$ Million), Price (USD/Unit) and Gross Margin (2019-2025)
Table 49. Japan Wireless Handheld Spectrometer Production (K Units), Revenue (US$ Million), Price (USD/Unit) and Gross Margin (2019-2025)
Table 50. China Wireless Handheld Spectrometer Production (K Units), Revenue (US$ Million), Price (USD/Unit) and Gross Margin (2019-2025)
Table 51. Phison Group (UPRtek) Wireless Handheld Spectrometer Basic Information
Table 52. Phison Group (UPRtek) Wireless Handheld Spectrometer Product Overview
Table 53. Phison Group (UPRtek) Wireless Handheld Spectrometer Sales (K Units), Revenue (M USD), Price (USD/Unit) and Gross Margin (2019-2025)
Table 54. Phison Group (UPRtek) Business Overview
Table 55. Phison Group (UPRtek) Wireless Handheld Spectrometer SWOT Analysis
Table 56. Phison Group (UPRtek) Recent Developments
Table 57. Carl Zeiss Wireless Handheld Spectrometer Basic Information
Table 58. Carl Zeiss Wireless Handheld Spectrometer Product Overview
Table 59. Carl Zeiss Wireless Handheld Spectrometer Sales (K Units), Revenue (M USD), Price (USD/Unit) and Gross Margin (2019-2025)
Table 60. Carl Zeiss Business Overview
Table 61. Carl Zeiss Wireless Handheld Spectrometer SWOT Analysis
Table 62. Carl Zeiss Recent Developments
Table 63. Thomson Group Wireless Handheld Spectrometer Basic Information
Table 64. Thomson Group Wireless Handheld Spectrometer Product Overview
Table 65. Thomson Group Wireless Handheld Spectrometer Sales (K Units), Revenue (M USD), Price (USD/Unit) and Gross Margin (2019-2025)
Table 66. Thomson Group Wireless Handheld Spectrometer SWOT Analysis
Table 67. Thomson Group Business Overview
Table 68. Thomson Group Recent Developments
Table 69. Thermo Fisher Scientific Wireless Handheld Spectrometer Basic Information
Table 70. Thermo Fisher Scientific Wireless Handheld Spectrometer Product Overview
Table 71. Thermo Fisher Scientific Wireless Handheld Spectrometer Sales (K Units), Revenue (M USD), Price (USD/Unit) and Gross Margin (2019-2025)
Table 72. Thermo Fisher Scientific Business Overview
Table 73. Thermo Fisher Scientific Recent Developments
Table 74. Pasco Corporation Wireless Handheld Spectrometer Basic Information
Table 75. Pasco Corporation Wireless Handheld Spectrometer Product Overview
Table 76. Pasco Corporation Wireless Handheld Spectrometer Sales (K Units), Revenue (M USD), Price (USD/Unit) and Gross Margin (2019-2025)
Table 77. Pasco Corporation Business Overview
Table 78. Pasco Corporation Recent Developments
Table 79. Bruker Daltonics Wireless Handheld Spectrometer Basic Information
Table 80. Bruker Daltonics Wireless Handheld Spectrometer Product Overview
Table 81. Bruker Daltonics Wireless Handheld Spectrometer Sales (K Units), Revenue (M USD), Price (USD/Unit) and Gross Margin (2019-2025)
Table 82. Bruker Daltonics Business Overview
Table 83. Bruker Daltonics Recent Developments
Table 84. Designs and Prototypes Wireless Handheld Spectrometer Basic Information
Table 85. Designs and Prototypes Wireless Handheld Spectrometer Product Overview
Table 86. Designs and Prototypes Wireless Handheld Spectrometer Sales (K Units), Revenue (M USD), Price (USD/Unit) and Gross Margin (2019-2025)
Table 87. Designs and Prototypes Business Overview
Table 88. Designs and Prototypes Recent Developments
Table 89. Midac Corporation Wireless Handheld Spectrometer Basic Information
Table 90. Midac Corporation Wireless Handheld Spectrometer Product Overview
Table 91. Midac Corporation Wireless Handheld Spectrometer Sales (K Units), Revenue (M USD), Price (USD/Unit) and Gross Margin (2019-2025)
Table 92. Midac Corporation Business Overview
Table 93. Midac Corporation Recent Developments
Table 94. Grabner Instruments Wireless Handheld Spectrometer Basic Information
Table 95. Grabner Instruments Wireless Handheld Spectrometer Product Overview
Table 96. Grabner Instruments Wireless Handheld Spectrometer Sales (K Units), Revenue (M USD), Price (USD/Unit) and Gross Margin (2019-2025)
Table 97. Grabner Instruments Business Overview
Table 98. Grabner Instruments Recent Developments
Table 99. Surface Optics Corp Wireless Handheld Spectrometer Basic Information
Table 100. Surface Optics Corp Wireless Handheld Spectrometer Product Overview
Table 101. Surface Optics Corp Wireless Handheld Spectrometer Sales (K Units), Revenue (M USD), Price (USD/Unit) and Gross Margin (2019-2025)
Table 102. Surface Optics Corp Business Overview
Table 103. Surface Optics Corp Recent Developments
Table 104. GASMET Technologies Wireless Handheld Spectrometer Basic Information
Table 105. GASMET Technologies Wireless Handheld Spectrometer Product Overview
Table 106. GASMET Technologies Wireless Handheld Spectrometer Sales (K Units), Revenue (M USD), Price (USD/Unit) and Gross Margin (2019-2025)
Table 107. GASMET Technologies Business Overview
Table 108. GASMET Technologies Recent Developments
Table 109. Global Wireless Handheld Spectrometer Sales Forecast by Region (2025-2032) & (K Units)
Table 110. Global Wireless Handheld Spectrometer Market Size Forecast by Region (2025-2032) & (M USD)
Table 111. North America Wireless Handheld Spectrometer Sales Forecast by Country (2025-2032) & (K Units)
Table 112. North America Wireless Handheld Spectrometer Market Size Forecast by Country (2025-2032) & (M USD)
Table 113. Europe Wireless Handheld Spectrometer Sales Forecast by Country (2025-2032) & (K Units)
Table 114. Europe Wireless Handheld Spectrometer Market Size Forecast by Country (2025-2032) & (M USD)
Table 115. Asia Pacific Wireless Handheld Spectrometer Sales Forecast by Region (2025-2032) & (K Units)
Table 116. Asia Pacific Wireless Handheld Spectrometer Market Size Forecast by Region (2025-2032) & (M USD)
Table 117. South America Wireless Handheld Spectrometer Sales Forecast by Country (2025-2032) & (K Units)
Table 118. South America Wireless Handheld Spectrometer Market Size Forecast by Country (2025-2032) & (M USD)
Table 119. Middle East and Africa Wireless Handheld Spectrometer Consumption Forecast by Country (2025-2032) & (Units)
Table 120. Middle East and Africa Wireless Handheld Spectrometer Market Size Forecast by Country (2025-2032) & (M USD)
Table 121. Global Wireless Handheld Spectrometer Sales Forecast by Type (2025-2032) & (K Units)
Table 122. Global Wireless Handheld Spectrometer Market Size Forecast by Type (2025-2032) & (M USD)
Table 123. Global Wireless Handheld Spectrometer Price Forecast by Type (2025-2032) & (USD/Unit)
Table 124. Global Wireless Handheld Spectrometer Sales (K Units) Forecast by Application (2025-2032)
Table 125. Global Wireless Handheld Spectrometer Market Size Forecast by Application (2025-2032) & (M USD)
List of Figures
Figure 1. Product Picture of Wireless Handheld Spectrometer
Figure 2. Data Triangulation
Figure 3. Key Caveats
Figure 4. Global Wireless Handheld Spectrometer Market Size (M USD), 2019-2032
Figure 5. Global Wireless Handheld Spectrometer Market Size (M USD) (2019-2032)
Figure 6. Global Wireless Handheld Spectrometer Sales (K Units) & (2019-2032)
Figure 7. Evaluation Matrix of Segment Market Development Potential (Type)
Figure 8. Evaluation Matrix of Segment Market Development Potential (Application)
Figure 9. Evaluation Matrix of Regional Market Development Potential
Figure 10. Wireless Handheld Spectrometer Market Size by Country (M USD)
Figure 11. Wireless Handheld Spectrometer Sales Share by Manufacturers in 2023
Figure 12. Global Wireless Handheld Spectrometer Revenue Share by Manufacturers in 2023
Figure 13. Wireless Handheld Spectrometer Market Share by Company Type (Tier 1, Tier 2 and Tier 3): 2023
Figure 14. Global Market Wireless Handheld Spectrometer Average Price (USD/Unit) of Key Manufacturers in 2023
Figure 15. The Global 5 and 10 Largest Players: Market Share by Wireless Handheld Spectrometer Revenue in 2023
Figure 16. Evaluation Matrix of Segment Market Development Potential (Type)
Figure 17. Global Wireless Handheld Spectrometer Market Share by Type
Figure 18. Sales Market Share of Wireless Handheld Spectrometer by Type (2019-2025)
Figure 19. Sales Market Share of Wireless Handheld Spectrometer by Type in 2023
Figure 20. Market Size Share of Wireless Handheld Spectrometer by Type (2019-2025)
Figure 21. Market Size Market Share of Wireless Handheld Spectrometer by Type in 2023
Figure 22. Evaluation Matrix of Segment Market Development Potential (Application)
Figure 23. Global Wireless Handheld Spectrometer Market Share by Application
Figure 24. Global Wireless Handheld Spectrometer Sales Market Share by Application (2019-2025)
Figure 25. Global Wireless Handheld Spectrometer Sales Market Share by Application in 2023
Figure 26. Global Wireless Handheld Spectrometer Market Share by Application (2019-2025)
Figure 27. Global Wireless Handheld Spectrometer Market Share by Application in 2023
Figure 28. Global Wireless Handheld Spectrometer Sales Growth Rate by Application (2019-2025)
Figure 29. Global Wireless Handheld Spectrometer Sales Market Share by Region (2019-2025)
Figure 30. North America Wireless Handheld Spectrometer Sales and Growth Rate (2019-2025) & (K Units)
Figure 31. North America Wireless Handheld Spectrometer Sales Market Share by Country in 2023
Figure 32. U.S. Wireless Handheld Spectrometer Sales and Growth Rate (2019-2025) & (K Units)
Figure 33. Canada Wireless Handheld Spectrometer Sales (K Units) and Growth Rate (2019-2025)
Figure 34. Mexico Wireless Handheld Spectrometer Sales (Units) and Growth Rate (2019-2025)
Figure 35. Europe Wireless Handheld Spectrometer Sales and Growth Rate (2019-2025) & (K Units)
Figure 36. Europe Wireless Handheld Spectrometer Sales Market Share by Country in 2023
Figure 37. Germany Wireless Handheld Spectrometer Sales and Growth Rate (2019-2025) & (K Units)
Figure 38. France Wireless Handheld Spectrometer Sales and Growth Rate (2019-2025) & (K Units)
Figure 39. U.K. Wireless Handheld Spectrometer Sales and Growth Rate (2019-2025) & (K Units)
Figure 40. Italy Wireless Handheld Spectrometer Sales and Growth Rate (2019-2025) & (K Units)
Figure 41. Russia Wireless Handheld Spectrometer Sales and Growth Rate (2019-2025) & (K Units)
Figure 42. Asia Pacific Wireless Handheld Spectrometer Sales and Growth Rate (K Units)
Figure 43. Asia Pacific Wireless Handheld Spectrometer Sales Market Share by Region in 2023
Figure 44. China Wireless Handheld Spectrometer Sales and Growth Rate (2019-2025) & (K Units)
Figure 45. Japan Wireless Handheld Spectrometer Sales and Growth Rate (2019-2025) & (K Units)
Figure 46. South Korea Wireless Handheld Spectrometer Sales and Growth Rate (2019-2025) & (K Units)
Figure 47. India Wireless Handheld Spectrometer Sales and Growth Rate (2019-2025) & (K Units)
Figure 48. Southeast Asia Wireless Handheld Spectrometer Sales and Growth Rate (2019-2025) & (K Units)
Figure 49. South America Wireless Handheld Spectrometer Sales and Growth Rate (K Units)
Figure 50. South America Wireless Handheld Spectrometer Sales Market Share by Country in 2023
Figure 51. Brazil Wireless Handheld Spectrometer Sales and Growth Rate (2019-2025) & (K Units)
Figure 52. Argentina Wireless Handheld Spectrometer Sales and Growth Rate (2019-2025) & (K Units)
Figure 53. Columbia Wireless Handheld Spectrometer Sales and Growth Rate (2019-2025) & (K Units)
Figure 54. Middle East and Africa Wireless Handheld Spectrometer Sales and Growth Rate (K Units)
Figure 55. Middle East and Africa Wireless Handheld Spectrometer Sales Market Share by Region in 2023
Figure 56. Saudi Arabia Wireless Handheld Spectrometer Sales and Growth Rate (2019-2025) & (K Units)
Figure 57. UAE Wireless Handheld Spectrometer Sales and Growth Rate (2019-2025) & (K Units)
Figure 58. Egypt Wireless Handheld Spectrometer Sales and Growth Rate (2019-2025) & (K Units)
Figure 59. Nigeria Wireless Handheld Spectrometer Sales and Growth Rate (2019-2025) & (K Units)
Figure 60. South Africa Wireless Handheld Spectrometer Sales and Growth Rate (2019-2025) & (K Units)
Figure 61. Global Wireless Handheld Spectrometer Production Market Share by Region (2019-2025)
Figure 62. North America Wireless Handheld Spectrometer Production (K Units) Growth Rate (2019-2025)
Figure 63. Europe Wireless Handheld Spectrometer Production (K Units) Growth Rate (2019-2025)
Figure 64. Japan Wireless Handheld Spectrometer Production (K Units) Growth Rate (2019-2025)
Figure 65. China Wireless Handheld Spectrometer Production (K Units) Growth Rate (2019-2025)
Figure 66. Global Wireless Handheld Spectrometer Sales Forecast by Volume (2019-2032) & (K Units)
Figure 67. Global Wireless Handheld Spectrometer Market Size Forecast by Value (2019-2032) & (M USD)
Figure 68. Global Wireless Handheld Spectrometer Sales Market Share Forecast by Type (2025-2032)
Figure 69. Global Wireless Handheld Spectrometer Market Share Forecast by Type (2025-2032)
Figure 70. Global Wireless Handheld Spectrometer Sales Forecast by Application (2025-2032)
Figure 71. Global Wireless Handheld Spectrometer Market Share Forecast by Application (2025-2032)