Virtual Mobile Infrastructure (VMI) Market, Size, Trends, Business Strategies 2025-2032

Global Virtual Mobile Infrastructure (VMI) market size was estimated at USD 129.40 million in 2023 and is projected to reach USD 202.41 million by 2030, exhibiting a CAGR of 6.60% during the forecast period.

PDF Icon Download Sample Report PDF
  • Quick Dispatch

    All Orders

  • Secure Payment

    100% Secure Payment

Compare

$1,500.00$4,250.00

Clear

Virtual Mobile Infrastructure (VMI) Market Overview

VMI refers to the method of hosting a mobile operating system on a server in a data center or the cloud. Mobile operating system environments are executed remotely and they are rendered via Mobile Optimized Display protocols through the network.

This report provides a deep insight into the global Virtual Mobile Infrastructure (VMI) market covering all its essential aspects. This ranges from a macro overview of the market to micro details of the market size, competitive landscape, development trend, niche market, key market drivers and challenges, SWOT analysis, value chain analysis, etc.

The analysis helps the reader to shape the competition within the industries and strategies for the competitive environment to enhance the potential profit. Furthermore, it provides a simple framework for evaluating and accessing the position of the business organization. The report structure also focuses on the competitive landscape of the Global Virtual Mobile Infrastructure (VMI) Market, this report introduces in detail the market share, market performance, product situation, operation situation, etc. of the main players, which helps the readers in the industry to identify the main competitors and deeply understand the competition pattern of the market.
In a word, this report is a must-read for industry players, investors, researchers, consultants, business strategists, and all those who have any kind of stake or are planning to foray into the Virtual Mobile Infrastructure (VMI) market in any manner.

Virtual Mobile Infrastructure (VMI) Market Analysis:

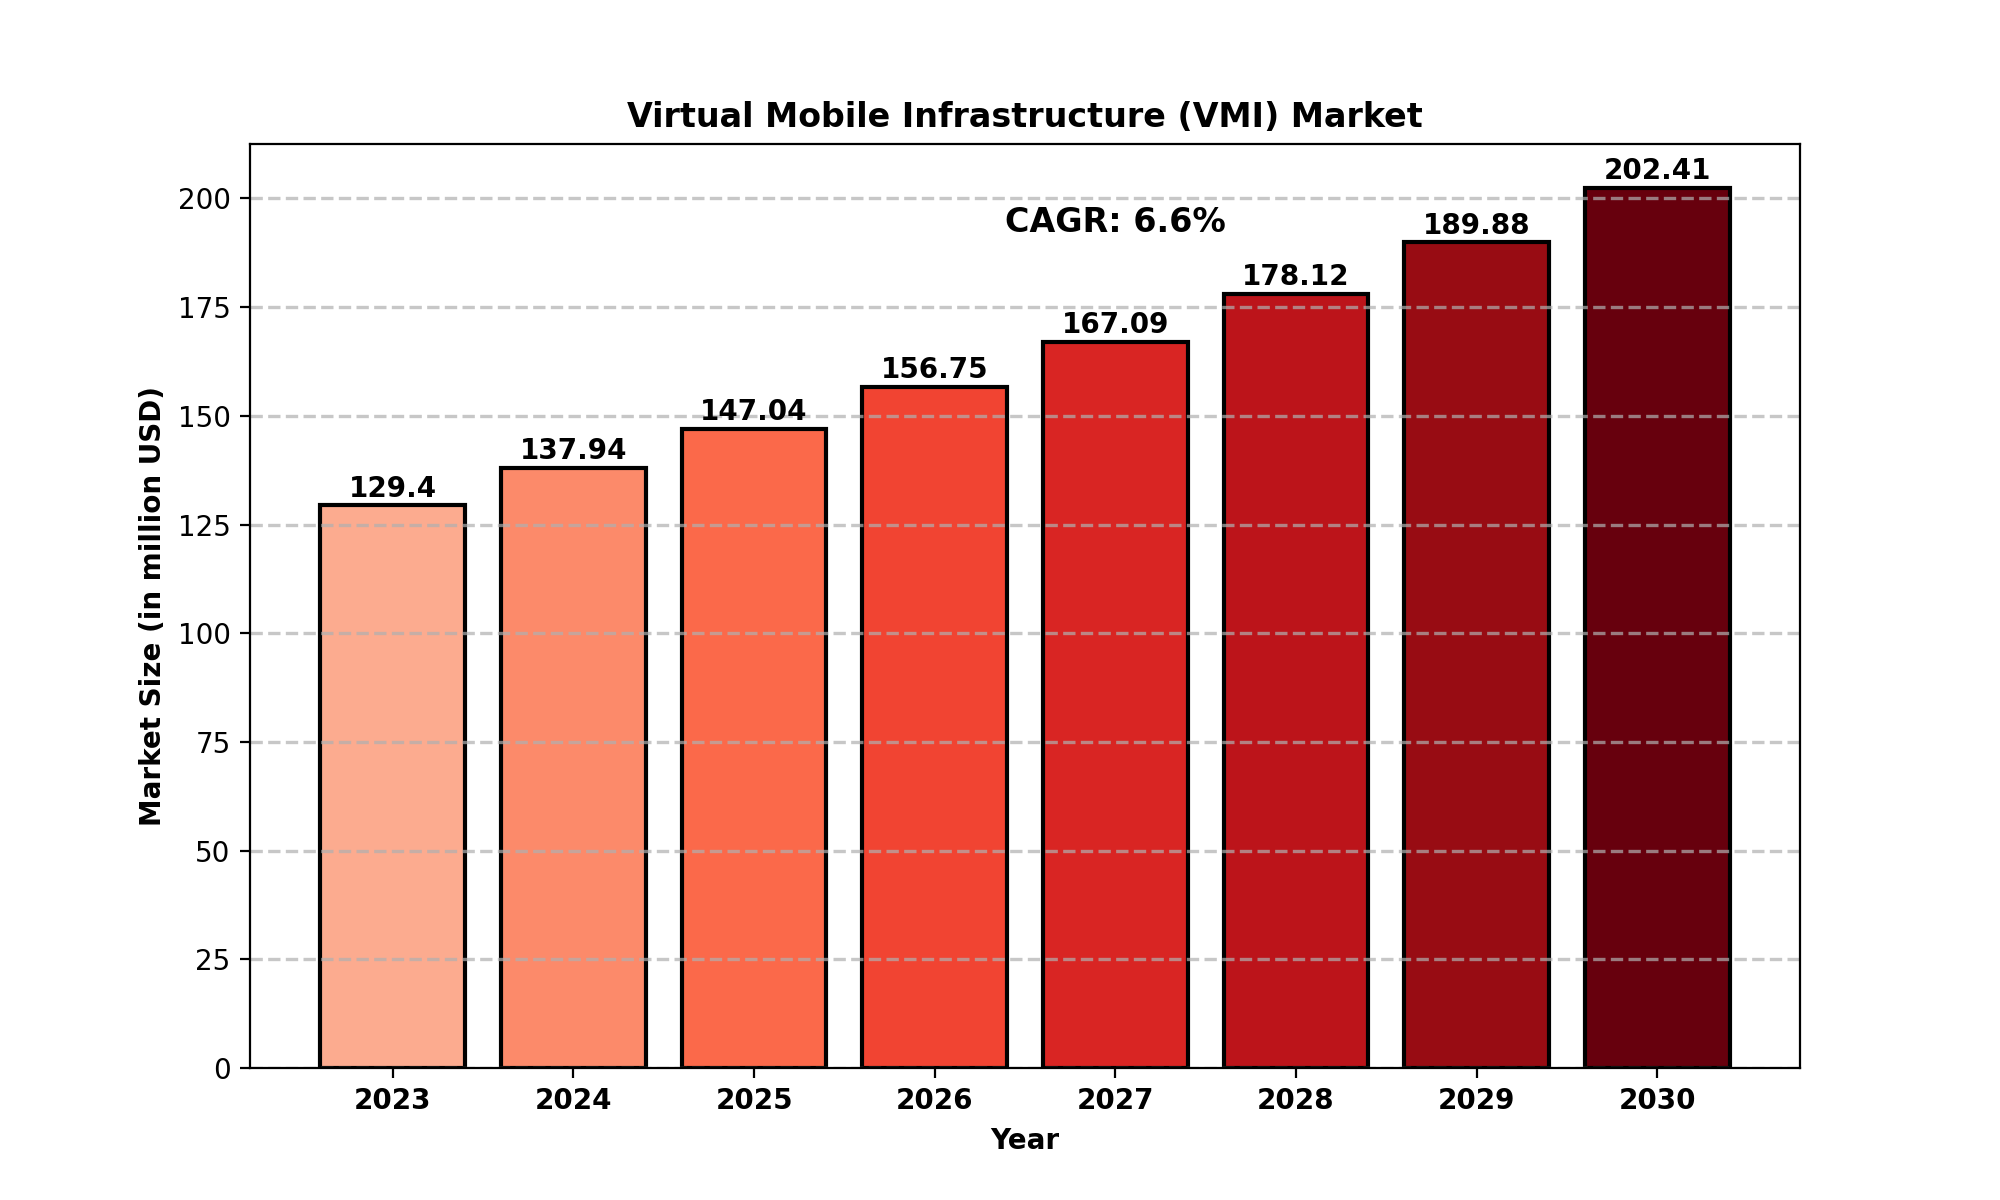
The global Virtual Mobile Infrastructure (VMI) market size was estimated at USD 129.40 million in 2023 and is projected to reach USD 202.41 million by 2030, exhibiting a CAGR of 6.60% during the forecast period.

North America Virtual Mobile Infrastructure (VMI) market size was USD 33.72 million in 2023, at a CAGR of 5.66% during the forecast period of 2025 through 2030.

Virtual Mobile Infrastructure (VMI) Market Analysis

Virtual Mobile Infrastructure (VMI) Key Market Trends  

  1. Increasing Adoption of Cloud-Based VMI Solutions
    Cloud-based VMI solutions are gaining traction due to their scalability, flexibility, and cost-effectiveness compared to on-premises deployments.

  2. Rising Demand for Secure Enterprise Mobility
    With the growing adoption of remote work, enterprises are turning to VMI solutions to enhance mobile security while enabling seamless access to corporate applications.

  3. Integration of AI and Automation in VMI Platforms
    AI-powered security and automation features are being integrated into VMI solutions to enhance user experience and improve threat detection.

  4. Growing Popularity of BYOD (Bring Your Own Device) Policies
    VMI is being widely adopted in organizations implementing BYOD policies, as it enables secure remote access without storing data on personal devices.

  5. Expansion into Healthcare and Government Sectors
    Industries like healthcare and government are leveraging VMI to secure sensitive data and comply with regulatory requirements.

Virtual Mobile Infrastructure (VMI) Market Regional Analysis :

semi insight

  • North America:Strong demand driven by EVs, 5G infrastructure, and renewable energy, with the U.S. leading the market.
  • Europe:Growth fueled by automotive electrification, renewable energy, and strong regulatory support, with Germany as a key player.
  • Asia-Pacific:Dominates the market due to large-scale manufacturing in China and Japan, with growing demand from EVs, 5G, and semiconductors.
  • South America:Emerging market, driven by renewable energy and EV adoption, with Brazil leading growth.
  • Middle East & Africa:Gradual growth, mainly due to investments in renewable energy and EV infrastructure, with Saudi Arabia and UAE as key contributors.

Virtual Mobile Infrastructure (VMI) Market Segmentation

The research report includes specific segments by region (country), manufacturers, Type, and Application. Market segmentation creates subsets of a market based on product type, end-user or application, Geographic, and other factors. By understanding the market segments, the decision-maker can leverage this targeting in the product, sales, and marketing strategies. Market segments can power your product development cycles by informing how you create product offerings for different segments.

The analysis helps the reader to shape the competition within the industries and strategies for the competitive environment to enhance the potential profit. Furthermore, it provides a simple framework for evaluating and accessing the position of the business organization. The report structure also focuses on the competitive landscape of the Global Virtual Mobile Infrastructure (VMI) Market, this report introduces in detail the market share, market performance, product situation, operation situation, etc. of the main players, which helps the readers in the industry to identify the main competitors and deeply understand the competition pattern of the market.
In a word, this report is a must-read for industry players, investors, researchers, consultants, business strategists, and all those who have any kind of stake or are planning to foray into the Virtual Mobile Infrastructure (VMI) market in any manner.

Key Company

  • Trend Micro
  • Avast Software
  • Sierraware
  • Raytheon
  • Prescient Solutions
  • Fortinet
  • Genymobile
  • Nubo
  • Intelligent Waves
  • Pulse Secure

Market Segmentation (by Type)

  • Cloud
  • On-premises

Market Segmentation (by Application)

  • BFSI
  • Healthcare
  • Manufacturing
  • IT and Telecom
  • Government
  • Others

Drivers

  1. Rising Concerns Over Mobile Security Threats
    Enterprises are increasingly adopting VMI to mitigate the risks of cyber threats, data breaches, and unauthorized access.

  2. Cost Savings and Simplified IT Management
    VMI reduces the need for expensive hardware upgrades and streamlines IT management by centralizing mobile applications.

  3. Growing Remote Workforce and Demand for Virtualization
    The shift towards remote and hybrid work models is fueling the demand for VMI solutions that provide secure mobile access to enterprise resources.

Restraints

  1. High Initial Implementation Costs
    The cost of setting up VMI infrastructure, especially for on-premises solutions, can be a challenge for small and medium-sized enterprises.

  2. Limited Network Bandwidth and Latency Issues
    Performance issues such as latency and network dependency can affect user experience, especially in cloud-based VMI solutions.

  3. Compatibility Challenges with Legacy Systems
    Integrating VMI with existing enterprise applications and legacy systems can be complex and require additional investment.

Opportunities

  1. Expansion of VMI into IoT and Edge Computing
    The increasing use of IoT devices and edge computing presents opportunities for VMI providers to enhance mobile security and virtualization.

  2. Development of AI-Driven Security Features
    AI-powered threat detection and automated security responses can enhance VMI capabilities and attract more enterprise customers.

  3. Growing Demand in BFSI and Healthcare Sectors
    The financial and healthcare industries require secure mobile access to critical applications, presenting significant growth potential for VMI solutions.

Challenges

  1. Ensuring Seamless User Experience Across Devices
    Maintaining high performance and responsiveness across different mobile devices and operating systems remains a challenge.

  2. Managing Compliance and Regulatory Requirements
    VMI providers must ensure compliance with data protection regulations such as GDPR, HIPAA, and CCPA, which can vary across regions.

  3. Balancing Security with Accessibility
    Striking the right balance between stringent security measures and seamless user access is crucial for VMI adoption.

Key Benefits of This Market Research:

  • Industry drivers, restraints, and opportunities covered in the study
  • Neutral perspective on the market performance
  • Recent industry trends and developments
  • Competitive landscape & strategies of key players
  • Potential & niche segments and regions exhibiting promising growth covered
  • Historical, current, and projected market size, in terms of value
  • In-depth analysis of the Virtual Mobile Infrastructure (VMI) Market
  • Overview of the regional outlook of the Virtual Mobile Infrastructure (VMI) Market:

Key Reasons to Buy this Report:

  • Access to date statistics compiled by our researchers. These provide you with historical and forecast data, which is analyzed to tell you why your market is set to change
  • This enables you to anticipate market changes to remain ahead of your competitors
  • You will be able to copy data from the Excel spreadsheet straight into your marketing plans, business presentations, or other strategic documents
  • The concise analysis, clear graph, and table format will enable you to pinpoint the information you require quickly
  • Provision of market value data for each segment and sub-segment
  • Indicates the region and segment that is expected to witness the fastest growth as well as to dominate the market
  • Provides insight into the market through Value Chain
  • Market dynamics scenario, along with growth opportunities of the market in the years to come
  • 6-month post-sales analyst support

Customization of the Report
In case of any queries or customization requirements, please connect with our sales team, who will ensure that your requirements are met.

FAQs

What are the key driving factors and opportunities in the market?
The market is driven by increasing mobile security concerns, the adoption of BYOD policies, and cost-saving benefits. Opportunities include AI-powered security enhancements, expansion into IoT, and rising demand in BFSI and healthcare sectors.


Which region is projected to have the largest share?
North America is expected to dominate the market due to strong investments in enterprise mobility, cybersecurity solutions, and cloud adoption.


Who are the top players in the global market?
Key players include Trend Micro, Avast Software, Sierraware, Raytheon, Prescient Solutions, Fortinet, Genymobile, Nubo, Intelligent Waves, and Pulse Secure.


What are the latest technological advancements in the industry?
Recent innovations include AI-driven security for mobile applications, cloud-based VMI solutions with enhanced performance, and integration with IoT and edge computing.


What is the current size of the global market?
The global Virtual Mobile Infrastructure (VMI) market was valued at USD 129.40 million in 2023 and is projected to reach USD 202.41 million by 2030, growing at a CAGR of 6.60% during the forecast period.

Virtual Mobile Infrastructure (VMI) Market, Size, Trends, Business Strategies 2025-2032

Get Sample Report PDF for Exclusive Insights

Report Sample Includes

  • Table of Contents
  • List of Tables & Figures
  • Charts, Research Methodology, and more...
PDF Icon Download Sample Report PDF

Download Sample Report

Table of Content

Table of Contents
1 Research Methodology and Statistical Scope
1.1 Market Definition and Statistical Scope of Virtual Mobile Infrastructure (VMI)
1.2 Key Market Segments
1.2.1 Virtual Mobile Infrastructure (VMI) Segment by Type
1.2.2 Virtual Mobile Infrastructure (VMI) Segment by Application
1.3 Methodology & Sources of Information
1.3.1 Research Methodology
1.3.2 Research Process
1.3.3 Market Breakdown and Data Triangulation
1.3.4 Base Year
1.3.5 Report Assumptions & Caveats
2 Virtual Mobile Infrastructure (VMI) Market Overview
2.1 Global Market Overview
2.1.1 Global Virtual Mobile Infrastructure (VMI) Market Size (M USD) Estimates and Forecasts (2019-2030)
2.1.2 Global Virtual Mobile Infrastructure (VMI) Sales Estimates and Forecasts (2019-2030)
2.2 Market Segment Executive Summary
2.3 Global Market Size by Region
3 Virtual Mobile Infrastructure (VMI) Market Competitive Landscape
3.1 Global Virtual Mobile Infrastructure (VMI) Sales by Manufacturers (2019-2025)
3.2 Global Virtual Mobile Infrastructure (VMI) Revenue Market Share by Manufacturers (2019-2025)
3.3 Virtual Mobile Infrastructure (VMI) Market Share by Company Type (Tier 1, Tier 2, and Tier 3)
3.4 Global Virtual Mobile Infrastructure (VMI) Average Price by Manufacturers (2019-2025)
3.5 Manufacturers Virtual Mobile Infrastructure (VMI) Sales Sites, Area Served, Product Type
3.6 Virtual Mobile Infrastructure (VMI) Market Competitive Situation and Trends
3.6.1 Virtual Mobile Infrastructure (VMI) Market Concentration Rate
3.6.2 Global 5 and 10 Largest Virtual Mobile Infrastructure (VMI) Players Market Share by Revenue
3.6.3 Mergers & Acquisitions, Expansion
4 Virtual Mobile Infrastructure (VMI) Industry Chain Analysis
4.1 Virtual Mobile Infrastructure (VMI) Industry Chain Analysis
4.2 Market Overview of Key Raw Materials
4.3 Midstream Market Analysis
4.4 Downstream Customer Analysis
5 The Development and Dynamics of Virtual Mobile Infrastructure (VMI) Market
5.1 Key Development Trends
5.2 Driving Factors
5.3 Market Challenges
5.4 Market Restraints
5.5 Industry News
5.5.1 New Product Developments
5.5.2 Mergers & Acquisitions
5.5.3 Expansions
5.5.4 Collaboration/Supply Contracts
5.6 Industry Policies
6 Virtual Mobile Infrastructure (VMI) Market Segmentation by Type
6.1 Evaluation Matrix of Segment Market Development Potential (Type)
6.2 Global Virtual Mobile Infrastructure (VMI) Sales Market Share by Type (2019-2025)
6.3 Global Virtual Mobile Infrastructure (VMI) Market Size Market Share by Type (2019-2025)
6.4 Global Virtual Mobile Infrastructure (VMI) Price by Type (2019-2025)
7 Virtual Mobile Infrastructure (VMI) Market Segmentation by Application
7.1 Evaluation Matrix of Segment Market Development Potential (Application)
7.2 Global Virtual Mobile Infrastructure (VMI) Market Sales by Application (2019-2025)
7.3 Global Virtual Mobile Infrastructure (VMI) Market Size (M USD) by Application (2019-2025)
7.4 Global Virtual Mobile Infrastructure (VMI) Sales Growth Rate by Application (2019-2025)
8 Virtual Mobile Infrastructure (VMI) Market Segmentation by Region
8.1 Global Virtual Mobile Infrastructure (VMI) Sales by Region
8.1.1 Global Virtual Mobile Infrastructure (VMI) Sales by Region
8.1.2 Global Virtual Mobile Infrastructure (VMI) Sales Market Share by Region
8.2 North America
8.2.1 North America Virtual Mobile Infrastructure (VMI) Sales by Country
8.2.2 U.S.
8.2.3 Canada
8.2.4 Mexico
8.3 Europe
8.3.1 Europe Virtual Mobile Infrastructure (VMI) Sales by Country
8.3.2 Germany
8.3.3 France
8.3.4 U.K.
8.3.5 Italy
8.3.6 Russia
8.4 Asia Pacific
8.4.1 Asia Pacific Virtual Mobile Infrastructure (VMI) Sales by Region
8.4.2 China
8.4.3 Japan
8.4.4 South Korea
8.4.5 India
8.4.6 Southeast Asia
8.5 South America
8.5.1 South America Virtual Mobile Infrastructure (VMI) Sales by Country
8.5.2 Brazil
8.5.3 Argentina
8.5.4 Columbia
8.6 Middle East and Africa
8.6.1 Middle East and Africa Virtual Mobile Infrastructure (VMI) Sales by Region
8.6.2 Saudi Arabia
8.6.3 UAE
8.6.4 Egypt
8.6.5 Nigeria
8.6.6 South Africa
9 Key Companies Profile
9.1 Trend Micro
9.1.1 Trend Micro Virtual Mobile Infrastructure (VMI) Basic Information
9.1.2 Trend Micro Virtual Mobile Infrastructure (VMI) Product Overview
9.1.3 Trend Micro Virtual Mobile Infrastructure (VMI) Product Market Performance
9.1.4 Trend Micro Business Overview
9.1.5 Trend Micro Virtual Mobile Infrastructure (VMI) SWOT Analysis
9.1.6 Trend Micro Recent Developments
9.2 Avast Software
9.2.1 Avast Software Virtual Mobile Infrastructure (VMI) Basic Information
9.2.2 Avast Software Virtual Mobile Infrastructure (VMI) Product Overview
9.2.3 Avast Software Virtual Mobile Infrastructure (VMI) Product Market Performance
9.2.4 Avast Software Business Overview
9.2.5 Avast Software Virtual Mobile Infrastructure (VMI) SWOT Analysis
9.2.6 Avast Software Recent Developments
9.3 Sierraware
9.3.1 Sierraware Virtual Mobile Infrastructure (VMI) Basic Information
9.3.2 Sierraware Virtual Mobile Infrastructure (VMI) Product Overview
9.3.3 Sierraware Virtual Mobile Infrastructure (VMI) Product Market Performance
9.3.4 Sierraware Virtual Mobile Infrastructure (VMI) SWOT Analysis
9.3.5 Sierraware Business Overview
9.3.6 Sierraware Recent Developments
9.4 Raytheon
9.4.1 Raytheon Virtual Mobile Infrastructure (VMI) Basic Information
9.4.2 Raytheon Virtual Mobile Infrastructure (VMI) Product Overview
9.4.3 Raytheon Virtual Mobile Infrastructure (VMI) Product Market Performance
9.4.4 Raytheon Business Overview
9.4.5 Raytheon Recent Developments
9.5 Prescient Solutions
9.5.1 Prescient Solutions Virtual Mobile Infrastructure (VMI) Basic Information
9.5.2 Prescient Solutions Virtual Mobile Infrastructure (VMI) Product Overview
9.5.3 Prescient Solutions Virtual Mobile Infrastructure (VMI) Product Market Performance
9.5.4 Prescient Solutions Business Overview
9.5.5 Prescient Solutions Recent Developments
9.6 Fortinet
9.6.1 Fortinet Virtual Mobile Infrastructure (VMI) Basic Information
9.6.2 Fortinet Virtual Mobile Infrastructure (VMI) Product Overview
9.6.3 Fortinet Virtual Mobile Infrastructure (VMI) Product Market Performance
9.6.4 Fortinet Business Overview
9.6.5 Fortinet Recent Developments
9.7 Genymobile
9.7.1 Genymobile Virtual Mobile Infrastructure (VMI) Basic Information
9.7.2 Genymobile Virtual Mobile Infrastructure (VMI) Product Overview
9.7.3 Genymobile Virtual Mobile Infrastructure (VMI) Product Market Performance
9.7.4 Genymobile Business Overview
9.7.5 Genymobile Recent Developments
9.8 Nubo
9.8.1 Nubo Virtual Mobile Infrastructure (VMI) Basic Information
9.8.2 Nubo Virtual Mobile Infrastructure (VMI) Product Overview
9.8.3 Nubo Virtual Mobile Infrastructure (VMI) Product Market Performance
9.8.4 Nubo Business Overview
9.8.5 Nubo Recent Developments
9.9 Intelligent Waves
9.9.1 Intelligent Waves Virtual Mobile Infrastructure (VMI) Basic Information
9.9.2 Intelligent Waves Virtual Mobile Infrastructure (VMI) Product Overview
9.9.3 Intelligent Waves Virtual Mobile Infrastructure (VMI) Product Market Performance
9.9.4 Intelligent Waves Business Overview
9.9.5 Intelligent Waves Recent Developments
9.10 Pulse Secure
9.10.1 Pulse Secure Virtual Mobile Infrastructure (VMI) Basic Information
9.10.2 Pulse Secure Virtual Mobile Infrastructure (VMI) Product Overview
9.10.3 Pulse Secure Virtual Mobile Infrastructure (VMI) Product Market Performance
9.10.4 Pulse Secure Business Overview
9.10.5 Pulse Secure Recent Developments
10 Virtual Mobile Infrastructure (VMI) Market Forecast by Region
10.1 Global Virtual Mobile Infrastructure (VMI) Market Size Forecast
10.2 Global Virtual Mobile Infrastructure (VMI) Market Forecast by Region
10.2.1 North America Market Size Forecast by Country
10.2.2 Europe Virtual Mobile Infrastructure (VMI) Market Size Forecast by Country
10.2.3 Asia Pacific Virtual Mobile Infrastructure (VMI) Market Size Forecast by Region
10.2.4 South America Virtual Mobile Infrastructure (VMI) Market Size Forecast by Country
10.2.5 Middle East and Africa Forecasted Consumption of Virtual Mobile Infrastructure (VMI) by Country
11 Forecast Market by Type and by Application (2025-2030)
11.1 Global Virtual Mobile Infrastructure (VMI) Market Forecast by Type (2025-2030)
11.1.1 Global Forecasted Sales of Virtual Mobile Infrastructure (VMI) by Type (2025-2030)
11.1.2 Global Virtual Mobile Infrastructure (VMI) Market Size Forecast by Type (2025-2030)
11.1.3 Global Forecasted Price of Virtual Mobile Infrastructure (VMI) by Type (2025-2030)
11.2 Global Virtual Mobile Infrastructure (VMI) Market Forecast by Application (2025-2030)
11.2.1 Global Virtual Mobile Infrastructure (VMI) Sales (K Units) Forecast by Application
11.2.2 Global Virtual Mobile Infrastructure (VMI) Market Size (M USD) Forecast by Application (2025-2030)
12 Conclusion and Key FindingsList of Tables
Table 1. Introduction of the Type
Table 2. Introduction of the Application
Table 3. Market Size (M USD) Segment Executive Summary
Table 4. Virtual Mobile Infrastructure (VMI) Market Size Comparison by Region (M USD)
Table 5. Global Virtual Mobile Infrastructure (VMI) Sales (K Units) by Manufacturers (2019-2025)
Table 6. Global Virtual Mobile Infrastructure (VMI) Sales Market Share by Manufacturers (2019-2025)
Table 7. Global Virtual Mobile Infrastructure (VMI) Revenue (M USD) by Manufacturers (2019-2025)
Table 8. Global Virtual Mobile Infrastructure (VMI) Revenue Share by Manufacturers (2019-2025)
Table 9. Company Type (Tier 1, Tier 2, and Tier 3) & (based on the Revenue in Virtual Mobile Infrastructure (VMI) as of 2022)
Table 10. Global Market Virtual Mobile Infrastructure (VMI) Average Price (USD/Unit) of Key Manufacturers (2019-2025)
Table 11. Manufacturers Virtual Mobile Infrastructure (VMI) Sales Sites and Area Served
Table 12. Manufacturers Virtual Mobile Infrastructure (VMI) Product Type
Table 13. Global Virtual Mobile Infrastructure (VMI) Manufacturers Market Concentration Ratio (CR5 and HHI)
Table 14. Mergers & Acquisitions, Expansion Plans
Table 15. Industry Chain Map of Virtual Mobile Infrastructure (VMI)
Table 16. Market Overview of Key Raw Materials
Table 17. Midstream Market Analysis
Table 18. Downstream Customer Analysis
Table 19. Key Development Trends
Table 20. Driving Factors
Table 21. Virtual Mobile Infrastructure (VMI) Market Challenges
Table 22. Global Virtual Mobile Infrastructure (VMI) Sales by Type (K Units)
Table 23. Global Virtual Mobile Infrastructure (VMI) Market Size by Type (M USD)
Table 24. Global Virtual Mobile Infrastructure (VMI) Sales (K Units) by Type (2019-2025)
Table 25. Global Virtual Mobile Infrastructure (VMI) Sales Market Share by Type (2019-2025)
Table 26. Global Virtual Mobile Infrastructure (VMI) Market Size (M USD) by Type (2019-2025)
Table 27. Global Virtual Mobile Infrastructure (VMI) Market Size Share by Type (2019-2025)
Table 28. Global Virtual Mobile Infrastructure (VMI) Price (USD/Unit) by Type (2019-2025)
Table 29. Global Virtual Mobile Infrastructure (VMI) Sales (K Units) by Application
Table 30. Global Virtual Mobile Infrastructure (VMI) Market Size by Application
Table 31. Global Virtual Mobile Infrastructure (VMI) Sales by Application (2019-2025) & (K Units)
Table 32. Global Virtual Mobile Infrastructure (VMI) Sales Market Share by Application (2019-2025)
Table 33. Global Virtual Mobile Infrastructure (VMI) Sales by Application (2019-2025) & (M USD)
Table 34. Global Virtual Mobile Infrastructure (VMI) Market Share by Application (2019-2025)
Table 35. Global Virtual Mobile Infrastructure (VMI) Sales Growth Rate by Application (2019-2025)
Table 36. Global Virtual Mobile Infrastructure (VMI) Sales by Region (2019-2025) & (K Units)
Table 37. Global Virtual Mobile Infrastructure (VMI) Sales Market Share by Region (2019-2025)
Table 38. North America Virtual Mobile Infrastructure (VMI) Sales by Country (2019-2025) & (K Units)
Table 39. Europe Virtual Mobile Infrastructure (VMI) Sales by Country (2019-2025) & (K Units)
Table 40. Asia Pacific Virtual Mobile Infrastructure (VMI) Sales by Region (2019-2025) & (K Units)
Table 41. South America Virtual Mobile Infrastructure (VMI) Sales by Country (2019-2025) & (K Units)
Table 42. Middle East and Africa Virtual Mobile Infrastructure (VMI) Sales by Region (2019-2025) & (K Units)
Table 43. Trend Micro Virtual Mobile Infrastructure (VMI) Basic Information
Table 44. Trend Micro Virtual Mobile Infrastructure (VMI) Product Overview
Table 45. Trend Micro Virtual Mobile Infrastructure (VMI) Sales (K Units), Revenue (M USD), Price (USD/Unit) and Gross Margin (2019-2025)
Table 46. Trend Micro Business Overview
Table 47. Trend Micro Virtual Mobile Infrastructure (VMI) SWOT Analysis
Table 48. Trend Micro Recent Developments
Table 49. Avast Software Virtual Mobile Infrastructure (VMI) Basic Information
Table 50. Avast Software Virtual Mobile Infrastructure (VMI) Product Overview
Table 51. Avast Software Virtual Mobile Infrastructure (VMI) Sales (K Units), Revenue (M USD), Price (USD/Unit) and Gross Margin (2019-2025)
Table 52. Avast Software Business Overview
Table 53. Avast Software Virtual Mobile Infrastructure (VMI) SWOT Analysis
Table 54. Avast Software Recent Developments
Table 55. Sierraware Virtual Mobile Infrastructure (VMI) Basic Information
Table 56. Sierraware Virtual Mobile Infrastructure (VMI) Product Overview
Table 57. Sierraware Virtual Mobile Infrastructure (VMI) Sales (K Units), Revenue (M USD), Price (USD/Unit) and Gross Margin (2019-2025)
Table 58. Sierraware Virtual Mobile Infrastructure (VMI) SWOT Analysis
Table 59. Sierraware Business Overview
Table 60. Sierraware Recent Developments
Table 61. Raytheon Virtual Mobile Infrastructure (VMI) Basic Information
Table 62. Raytheon Virtual Mobile Infrastructure (VMI) Product Overview
Table 63. Raytheon Virtual Mobile Infrastructure (VMI) Sales (K Units), Revenue (M USD), Price (USD/Unit) and Gross Margin (2019-2025)
Table 64. Raytheon Business Overview
Table 65. Raytheon Recent Developments
Table 66. Prescient Solutions Virtual Mobile Infrastructure (VMI) Basic Information
Table 67. Prescient Solutions Virtual Mobile Infrastructure (VMI) Product Overview
Table 68. Prescient Solutions Virtual Mobile Infrastructure (VMI) Sales (K Units), Revenue (M USD), Price (USD/Unit) and Gross Margin (2019-2025)
Table 69. Prescient Solutions Business Overview
Table 70. Prescient Solutions Recent Developments
Table 71. Fortinet Virtual Mobile Infrastructure (VMI) Basic Information
Table 72. Fortinet Virtual Mobile Infrastructure (VMI) Product Overview
Table 73. Fortinet Virtual Mobile Infrastructure (VMI) Sales (K Units), Revenue (M USD), Price (USD/Unit) and Gross Margin (2019-2025)
Table 74. Fortinet Business Overview
Table 75. Fortinet Recent Developments
Table 76. Genymobile Virtual Mobile Infrastructure (VMI) Basic Information
Table 77. Genymobile Virtual Mobile Infrastructure (VMI) Product Overview
Table 78. Genymobile Virtual Mobile Infrastructure (VMI) Sales (K Units), Revenue (M USD), Price (USD/Unit) and Gross Margin (2019-2025)
Table 79. Genymobile Business Overview
Table 80. Genymobile Recent Developments
Table 81. Nubo Virtual Mobile Infrastructure (VMI) Basic Information
Table 82. Nubo Virtual Mobile Infrastructure (VMI) Product Overview
Table 83. Nubo Virtual Mobile Infrastructure (VMI) Sales (K Units), Revenue (M USD), Price (USD/Unit) and Gross Margin (2019-2025)
Table 84. Nubo Business Overview
Table 85. Nubo Recent Developments
Table 86. Intelligent Waves Virtual Mobile Infrastructure (VMI) Basic Information
Table 87. Intelligent Waves Virtual Mobile Infrastructure (VMI) Product Overview
Table 88. Intelligent Waves Virtual Mobile Infrastructure (VMI) Sales (K Units), Revenue (M USD), Price (USD/Unit) and Gross Margin (2019-2025)
Table 89. Intelligent Waves Business Overview
Table 90. Intelligent Waves Recent Developments
Table 91. Pulse Secure Virtual Mobile Infrastructure (VMI) Basic Information
Table 92. Pulse Secure Virtual Mobile Infrastructure (VMI) Product Overview
Table 93. Pulse Secure Virtual Mobile Infrastructure (VMI) Sales (K Units), Revenue (M USD), Price (USD/Unit) and Gross Margin (2019-2025)
Table 94. Pulse Secure Business Overview
Table 95. Pulse Secure Recent Developments
Table 96. Global Virtual Mobile Infrastructure (VMI) Sales Forecast by Region (2025-2030) & (K Units)
Table 97. Global Virtual Mobile Infrastructure (VMI) Market Size Forecast by Region (2025-2030) & (M USD)
Table 98. North America Virtual Mobile Infrastructure (VMI) Sales Forecast by Country (2025-2030) & (K Units)
Table 99. North America Virtual Mobile Infrastructure (VMI) Market Size Forecast by Country (2025-2030) & (M USD)
Table 100. Europe Virtual Mobile Infrastructure (VMI) Sales Forecast by Country (2025-2030) & (K Units)
Table 101. Europe Virtual Mobile Infrastructure (VMI) Market Size Forecast by Country (2025-2030) & (M USD)
Table 102. Asia Pacific Virtual Mobile Infrastructure (VMI) Sales Forecast by Region (2025-2030) & (K Units)
Table 103. Asia Pacific Virtual Mobile Infrastructure (VMI) Market Size Forecast by Region (2025-2030) & (M USD)
Table 104. South America Virtual Mobile Infrastructure (VMI) Sales Forecast by Country (2025-2030) & (K Units)
Table 105. South America Virtual Mobile Infrastructure (VMI) Market Size Forecast by Country (2025-2030) & (M USD)
Table 106. Middle East and Africa Virtual Mobile Infrastructure (VMI) Consumption Forecast by Country (2025-2030) & (Units)
Table 107. Middle East and Africa Virtual Mobile Infrastructure (VMI) Market Size Forecast by Country (2025-2030) & (M USD)
Table 108. Global Virtual Mobile Infrastructure (VMI) Sales Forecast by Type (2025-2030) & (K Units)
Table 109. Global Virtual Mobile Infrastructure (VMI) Market Size Forecast by Type (2025-2030) & (M USD)
Table 110. Global Virtual Mobile Infrastructure (VMI) Price Forecast by Type (2025-2030) & (USD/Unit)
Table 111. Global Virtual Mobile Infrastructure (VMI) Sales (K Units) Forecast by Application (2025-2030)
Table 112. Global Virtual Mobile Infrastructure (VMI) Market Size Forecast by Application (2025-2030) & (M USD)
List of Figures
Figure 1. Product Picture of Virtual Mobile Infrastructure (VMI)
Figure 2. Data Triangulation
Figure 3. Key Caveats
Figure 4. Global Virtual Mobile Infrastructure (VMI) Market Size (M USD), 2019-2030
Figure 5. Global Virtual Mobile Infrastructure (VMI) Market Size (M USD) (2019-2030)
Figure 6. Global Virtual Mobile Infrastructure (VMI) Sales (K Units) & (2019-2030)
Figure 7. Evaluation Matrix of Segment Market Development Potential (Type)
Figure 8. Evaluation Matrix of Segment Market Development Potential (Application)
Figure 9. Evaluation Matrix of Regional Market Development Potential
Figure 10. Virtual Mobile Infrastructure (VMI) Market Size by Country (M USD)
Figure 11. Virtual Mobile Infrastructure (VMI) Sales Share by Manufacturers in 2023
Figure 12. Global Virtual Mobile Infrastructure (VMI) Revenue Share by Manufacturers in 2023
Figure 13. Virtual Mobile Infrastructure (VMI) Market Share by Company Type (Tier 1, Tier 2 and Tier 3): 2023
Figure 14. Global Market Virtual Mobile Infrastructure (VMI) Average Price (USD/Unit) of Key Manufacturers in 2023
Figure 15. The Global 5 and 10 Largest Players: Market Share by Virtual Mobile Infrastructure (VMI) Revenue in 2023
Figure 16. Evaluation Matrix of Segment Market Development Potential (Type)
Figure 17. Global Virtual Mobile Infrastructure (VMI) Market Share by Type
Figure 18. Sales Market Share of Virtual Mobile Infrastructure (VMI) by Type (2019-2025)
Figure 19. Sales Market Share of Virtual Mobile Infrastructure (VMI) by Type in 2023
Figure 20. Market Size Share of Virtual Mobile Infrastructure (VMI) by Type (2019-2025)
Figure 21. Market Size Market Share of Virtual Mobile Infrastructure (VMI) by Type in 2023
Figure 22. Evaluation Matrix of Segment Market Development Potential (Application)
Figure 23. Global Virtual Mobile Infrastructure (VMI) Market Share by Application
Figure 24. Global Virtual Mobile Infrastructure (VMI) Sales Market Share by Application (2019-2025)
Figure 25. Global Virtual Mobile Infrastructure (VMI) Sales Market Share by Application in 2023
Figure 26. Global Virtual Mobile Infrastructure (VMI) Market Share by Application (2019-2025)
Figure 27. Global Virtual Mobile Infrastructure (VMI) Market Share by Application in 2023
Figure 28. Global Virtual Mobile Infrastructure (VMI) Sales Growth Rate by Application (2019-2025)
Figure 29. Global Virtual Mobile Infrastructure (VMI) Sales Market Share by Region (2019-2025)
Figure 30. North America Virtual Mobile Infrastructure (VMI) Sales and Growth Rate (2019-2025) & (K Units)
Figure 31. North America Virtual Mobile Infrastructure (VMI) Sales Market Share by Country in 2023
Figure 32. U.S. Virtual Mobile Infrastructure (VMI) Sales and Growth Rate (2019-2025) & (K Units)
Figure 33. Canada Virtual Mobile Infrastructure (VMI) Sales (K Units) and Growth Rate (2019-2025)
Figure 34. Mexico Virtual Mobile Infrastructure (VMI) Sales (Units) and Growth Rate (2019-2025)
Figure 35. Europe Virtual Mobile Infrastructure (VMI) Sales and Growth Rate (2019-2025) & (K Units)
Figure 36. Europe Virtual Mobile Infrastructure (VMI) Sales Market Share by Country in 2023
Figure 37. Germany Virtual Mobile Infrastructure (VMI) Sales and Growth Rate (2019-2025) & (K Units)
Figure 38. France Virtual Mobile Infrastructure (VMI) Sales and Growth Rate (2019-2025) & (K Units)
Figure 39. U.K. Virtual Mobile Infrastructure (VMI) Sales and Growth Rate (2019-2025) & (K Units)
Figure 40. Italy Virtual Mobile Infrastructure (VMI) Sales and Growth Rate (2019-2025) & (K Units)
Figure 41. Russia Virtual Mobile Infrastructure (VMI) Sales and Growth Rate (2019-2025) & (K Units)
Figure 42. Asia Pacific Virtual Mobile Infrastructure (VMI) Sales and Growth Rate (K Units)
Figure 43. Asia Pacific Virtual Mobile Infrastructure (VMI) Sales Market Share by Region in 2023
Figure 44. China Virtual Mobile Infrastructure (VMI) Sales and Growth Rate (2019-2025) & (K Units)
Figure 45. Japan Virtual Mobile Infrastructure (VMI) Sales and Growth Rate (2019-2025) & (K Units)
Figure 46. South Korea Virtual Mobile Infrastructure (VMI) Sales and Growth Rate (2019-2025) & (K Units)
Figure 47. India Virtual Mobile Infrastructure (VMI) Sales and Growth Rate (2019-2025) & (K Units)
Figure 48. Southeast Asia Virtual Mobile Infrastructure (VMI) Sales and Growth Rate (2019-2025) & (K Units)
Figure 49. South America Virtual Mobile Infrastructure (VMI) Sales and Growth Rate (K Units)
Figure 50. South America Virtual Mobile Infrastructure (VMI) Sales Market Share by Country in 2023
Figure 51. Brazil Virtual Mobile Infrastructure (VMI) Sales and Growth Rate (2019-2025) & (K Units)
Figure 52. Argentina Virtual Mobile Infrastructure (VMI) Sales and Growth Rate (2019-2025) & (K Units)
Figure 53. Columbia Virtual Mobile Infrastructure (VMI) Sales and Growth Rate (2019-2025) & (K Units)
Figure 54. Middle East and Africa Virtual Mobile Infrastructure (VMI) Sales and Growth Rate (K Units)
Figure 55. Middle East and Africa Virtual Mobile Infrastructure (VMI) Sales Market Share by Region in 2023
Figure 56. Saudi Arabia Virtual Mobile Infrastructure (VMI) Sales and Growth Rate (2019-2025) & (K Units)
Figure 57. UAE Virtual Mobile Infrastructure (VMI) Sales and Growth Rate (2019-2025) & (K Units)
Figure 58. Egypt Virtual Mobile Infrastructure (VMI) Sales and Growth Rate (2019-2025) & (K Units)
Figure 59. Nigeria Virtual Mobile Infrastructure (VMI) Sales and Growth Rate (2019-2025) & (K Units)
Figure 60. South Africa Virtual Mobile Infrastructure (VMI) Sales and Growth Rate (2019-2025) & (K Units)
Figure 61. Global Virtual Mobile Infrastructure (VMI) Sales Forecast by Volume (2019-2030) & (K Units)
Figure 62. Global Virtual Mobile Infrastructure (VMI) Market Size Forecast by Value (2019-2030) & (M USD)
Figure 63. Global Virtual Mobile Infrastructure (VMI) Sales Market Share Forecast by Type (2025-2030)
Figure 64. Global Virtual Mobile Infrastructure (VMI) Market Share Forecast by Type (2025-2030)
Figure 65. Global Virtual Mobile Infrastructure (VMI) Sales Forecast by Application (2025-2030)
Figure 66. Global Virtual Mobile Infrastructure (VMI) Market Share Forecast by Application (2025-2030)