Enterprise SSD for AI Market Insights
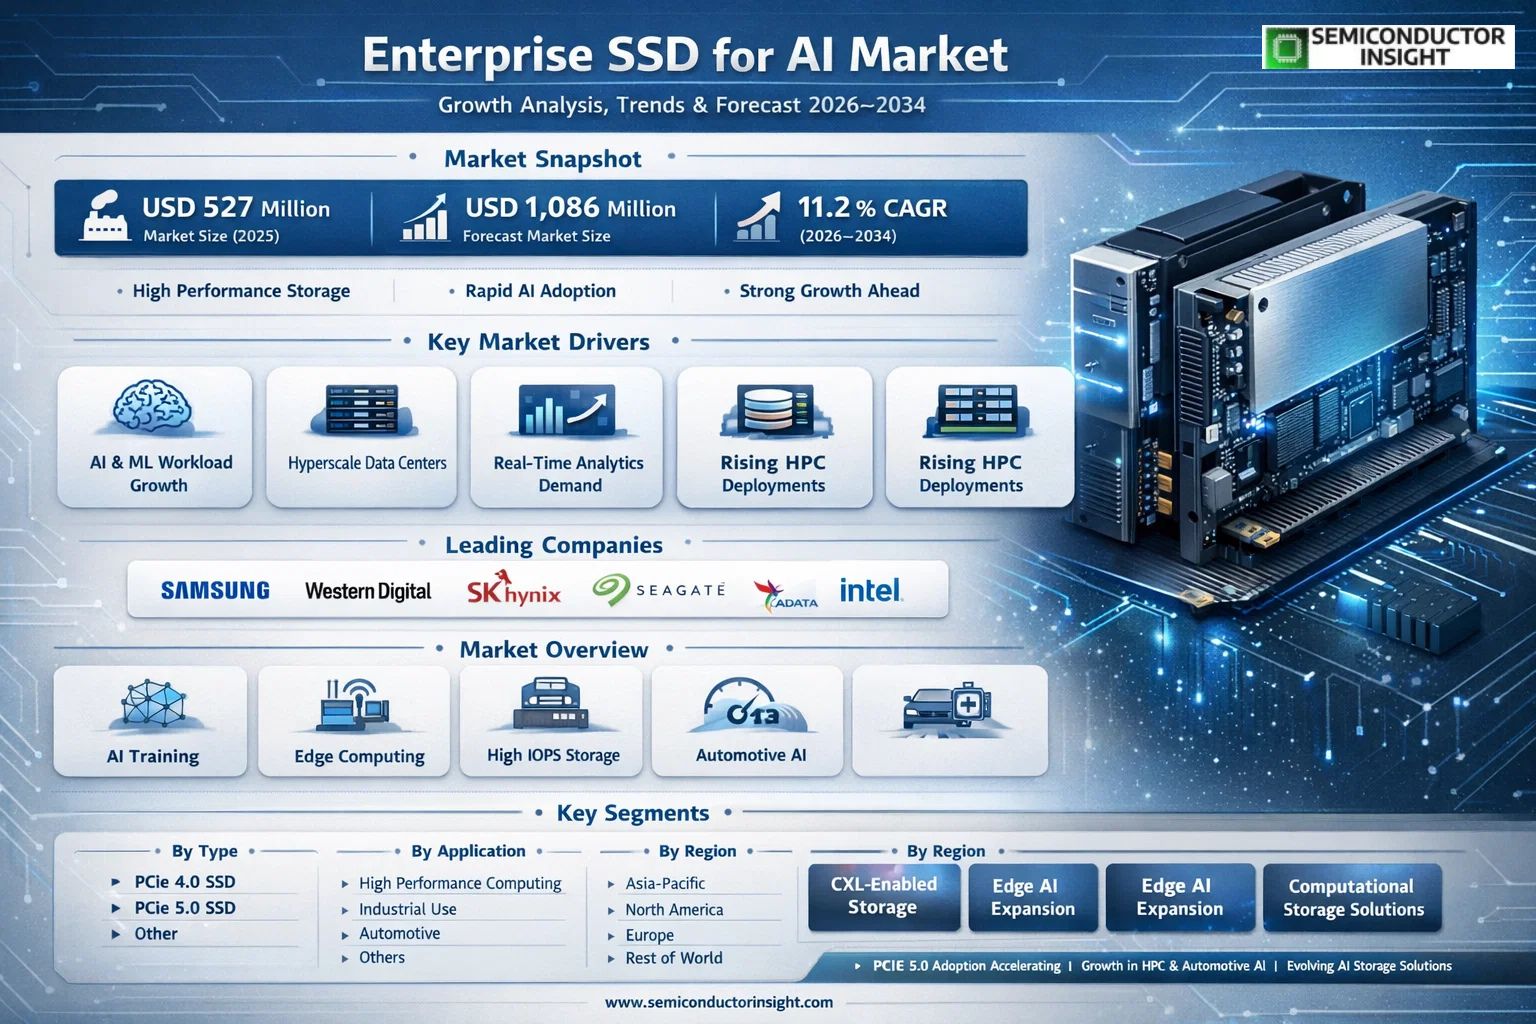
Global Enterprise SSD for AI market size was valued at USD 527 million in 2025. The market is projected to grow from USD 585.99 million in 2026 to USD 1,086 million by 2034, exhibiting a CAGR of 11.2% during the forecast period.
Enterprise SSDs for AI are specialized solid-state drives designed to meet the high-performance requirements of artificial intelligence (AI) and machine learning (ML) workloads in data centers and enterprise environments. Unlike standard SSDs, these drives are engineered to handle the immense data throughput, low latency, and high IOPS (Input/Output Operations Per Second) demands of AI applications such as deep learning, neural network training, and real-time data analytics. The product landscape encompasses key interface types including PCIe 4.0 SSDs, PCIe 5.0 SSDs, and other emerging variants, each offering distinct performance tiers suited to varying AI infrastructure requirements.
The market is experiencing robust growth driven by several converging factors, including the rapid proliferation of AI workloads across hyperscale data centers, rising enterprise adoption of machine learning frameworks, and increasing demand for high-throughput storage in High Performance Computing (HPC) environments. Furthermore, the expanding deployment of AI in industrial and automotive applications is broadening the addressable market considerably. Key manufacturers actively shaping the competitive landscape include Samsung, Western Digital, Kingston, SK Hynix, Seagate Technology, ADATA, Micron Technology, Gigabyte, KIOXIA, and Intel, among others, all of whom maintain extensive product portfolios catering to diverse enterprise AI storage needs.
MARKET DRIVERS
Surging AI Workload Demands Accelerating Enterprise SSD Adoption
The rapid proliferation of artificial intelligence and machine learning workloads across industries is fundamentally reshaping storage infrastructure requirements within enterprise environments. Enterprise SSD for AI Market is experiencing substantial momentum as organizations deploy large language models, deep learning pipelines, and real-time inference engines that demand storage solutions capable of delivering consistently high throughput and ultra-low latency. Unlike traditional spinning disk technologies, enterprise-grade SSDs provide the random read/write performance profiles essential to feeding data-hungry GPU and NPU clusters without creating I/O bottlenecks that would otherwise compromise model training efficiency and inference response times.
Hyperscale Data Center Expansion Fueling Enterprise SSD Procurement
Hyperscale cloud service providers and colocation operators continue to aggressively expand their data center footprints to accommodate the compute-intensive requirements of generative AI services and AI-as-a-Service platforms. This expansion directly translates into large-scale procurement cycles for high-capacity enterprise SSDs, particularly NVMe-based drives conforming to the PCIe Gen 4 and PCIe Gen 5 interface standards. The transition toward composable and disaggregated infrastructure architectures further reinforces the strategic importance of enterprise SSD solutions optimized specifically for AI market deployments, where predictable latency and endurance under sustained mixed workloads are non-negotiable operational requirements.
➤ The convergence of generative AI adoption, vector database deployments, and real-time analytics is positioning enterprise SSDs as mission-critical infrastructure components rather than peripheral storage upgrades within modern AI-centric data centers.
Beyond hyperscalers, enterprise organizations across financial services, healthcare, autonomous systems, and telecommunications are integrating AI-driven decision-making platforms that place continuous and intensive demands on storage subsystems. This broader enterprise digitization wave is creating a diverse and expanding customer base for enterprise SSD for AI solutions, as IT procurement teams increasingly recognize that storage performance is a first-order constraint on overall AI system throughput and cost-efficiency.
MARKET CHALLENGES
Thermal Management and Sustained Performance Degradation Under AI Workloads
One of the most technically significant challenges confronting Enterprise SSD for AI Market is the management of heat accumulation during sustained, high-intensity operations characteristic of AI training and continuous inference workloads. Enterprise SSDs deployed in dense server configurations often encounter thermal throttling conditions that can meaningfully reduce sustained sequential and random I/O performance, undermining the consistent low-latency characteristics that AI pipelines require. Drive vendors and system integrators are investing in advanced thermal dissipation technologies and firmware-level thermal management algorithms, but the challenge remains particularly acute as flash storage densities continue to increase and form factors become increasingly compact within high-density server chassis designs.
Other Challenges
Supply Chain Complexity and NAND Flash Pricing Volatility
The enterprise SSD supply chain remains subject to periodic NAND flash memory pricing cycles driven by imbalances between wafer fabrication capacity and end-market demand. For enterprises planning large-scale AI infrastructure deployments, this pricing volatility introduces budgetary uncertainty that can delay procurement decisions or compress vendor margins. The concentration of advanced NAND flash production among a limited number of leading-edge fabrication facilities also introduces geopolitical and logistics risk dimensions that procurement and supply chain teams must actively manage within their sourcing strategies.
Qualification and Validation Cycles for Mission-Critical AI Environments
Enterprise buyers operating AI infrastructure in regulated industries or mission-critical environments typically require extensive qualification and validation cycles before new enterprise SSD platforms can be approved for production deployment. These processes, while necessary to ensure reliability and compatibility, can extend time-to-deployment by several months and limit the ability of organizations to rapidly adopt next-generation storage technologies that could meaningfully improve their AI workload performance profiles. Vendors serving Enterprise SSD for AI Market must therefore maintain robust qualification support programs and long-term product availability commitments to satisfy enterprise procurement requirements.
MARKET RESTRAINTS
High Total Cost of Ownership Limiting Broad Enterprise Deployment
Despite the clear performance advantages that enterprise SSDs offer for AI workloads, the significantly elevated acquisition cost relative to high-capacity hard disk drives and hybrid storage alternatives remains a meaningful restraint on market penetration, particularly among mid-market enterprises and organizations in cost-sensitive verticals. The economics of deploying all-flash storage architectures exclusively optimized for AI workloads require careful total cost of ownership modeling that accounts for drive endurance, warranty terms, and the operational cost of data center power and cooling. For organizations where AI workloads coexist with large-volume cold storage or archival requirements, the cost justification for enterprise SSD adoption across all storage tiers becomes more complex and requires a tiered storage strategy that balances performance against cost per usable terabyte.
Endurance and Write Amplification Constraints in Continuous AI Training Environments
AI model training workloads, particularly those involving iterative gradient descent operations with frequent checkpoint writes, impose write amplification patterns that can accelerate NAND flash cell wear beyond the rated drive write endurance specifications if storage architectures are not carefully designed. This endurance constraint represents a technical restraint on Enterprise SSD for AI Market, as organizations must either invest in higher-endurance SLC or MLC-class enterprise drives at considerable cost premium, implement sophisticated wear-leveling and data placement strategies, or accept more frequent drive replacement cycles that elevate operational expenditure. Until next-generation non-volatile memory technologies mature to commercial viability at enterprise scale, write endurance will continue to represent a structural restraint on total addressable deployments within the most write-intensive AI infrastructure use cases.
MARKET OPPORTUNITIES
Emergence of CXL-Enabled Storage Architectures Opening New Enterprise SSD Use Cases
The progressive commercialization of Compute Express Link (CXL) interconnect technology is creating a compelling new architectural opportunity within Enterprise SSD for AI Market. CXL enables memory-semantic access to large pools of flash-based storage, effectively allowing enterprise SSDs to participate in expanded memory hierarchies that bridge the latency and capacity gap between DRAM and conventional NVMe storage. For AI inference workloads requiring rapid access to large model parameter sets and embedding tables that exceed practical DRAM capacities, CXL-attached enterprise SSD solutions offer a technically and economically attractive alternative that vendors with strong NVMe expertise are well-positioned to address through purpose-built product lines targeting AI infrastructure deployments.
Edge AI Infrastructure Expansion Creating Distributed Enterprise SSD Demand
The accelerating deployment of AI inferencing capabilities at the network edge — spanning industrial automation facilities, retail environments, healthcare delivery sites, and telecommunications network nodes — is generating a geographically distributed demand profile for ruggedized, enterprise-grade SSDs optimized for edge AI platforms. Unlike centralized data center deployments, edge AI installations prioritize compact form factors, wide operating temperature ranges, and enhanced vibration resistance alongside the performance and endurance characteristics required by local inference engines. This edge AI expansion represents a structurally additive growth vector for Enterprise SSD for AI Market, as it draws in customer segments and deployment environments that were historically underserved by traditional enterprise storage product lines, thereby broadening the total addressable market beyond hyperscale and large enterprise data center boundaries.
AI-Optimized Firmware and Computational Storage Development as Competitive Differentiation
Storage vendors are actively developing firmware intelligence and computational storage capabilities that allow enterprise SSDs to perform data preprocessing, filtering, and compression operations directly within the storage device, reducing the volume of raw data transferred across system interconnects to AI accelerator resources. This in-storage computing paradigm represents a significant product differentiation opportunity within Enterprise SSD for AI Market, enabling vendors to command premium positioning by demonstrating measurable reductions in total system latency, interconnect bandwidth consumption, and host CPU utilization for common AI data preparation operations. As AI pipeline architectures mature and enterprise IT teams develop greater sophistication in storage-compute co-design, demand for enterprise SSDs with embedded computational intelligence capabilities is expected to grow as a distinct and strategically important market segment.
MAIN TITLE HERE () Trends
Rising Demand for High-Performance Storage in AI Workloads Drives Enterprise SSD for AI Market Growth
Enterprise SSD for AI Market is experiencing robust momentum as data centers and enterprise environments increasingly adopt artificial intelligence and machine learning workloads. Enterprise SSDs for AI are purpose-built solid-state drives engineered to handle the extreme data throughput, low latency, and high IOPS demands of applications such as deep learning, neural network training, and real-time data analytics. Unlike conventional SSDs, these drives are optimized to sustain the continuous, intensive read and write cycles characteristic of AI inference and training pipelines, making them indispensable infrastructure components across modern enterprise computing environments.
Other Trends
Accelerated Adoption of PCIe 5.0 Interface Technology
One of the most significant trends reshaping Enterprise SSD for AI Market is the rapid transition toward PCIe 5.0 SSD technology. PCIe 5.0 delivers substantially higher bandwidth compared to its predecessor, enabling faster data transfer rates critical for feeding AI accelerators and GPUs with the continuous data streams they require. Enterprise customers investing in next-generation AI infrastructure are increasingly specifying PCIe 5.0 SSDs in new server deployments, as the performance gains directly translate to reduced model training times and improved inference latency. PCIe 4.0 SSDs continue to hold a significant installed base, particularly in cost-sensitive deployments and industrial AI applications, while PCIe 5.0 adoption accelerates among hyperscalers and high-performance computing environments.
Expansion Across High Performance Computing and Industrial Applications
Enterprise SSD for AI Market is witnessing growing diversification across application segments including High Performance Computing, industrial use, and automotive sectors. HPC environments remain the dominant application, driven by large-scale AI model training and simulation workloads that require sustained high IOPS performance. Industrial AI applications, including predictive maintenance, quality inspection, and autonomous process control, are emerging as a rapidly expanding segment as manufacturers integrate AI-driven analytics at the edge. The automotive sector is also contributing to demand growth, with AI-powered autonomous driving systems and in-vehicle data processing requiring ruggedized, high-endurance enterprise-grade storage solutions capable of operating across demanding environmental conditions.
Competitive Landscape and Regional Market Dynamics Shaping Enterprise SSD for AI Trends
The competitive landscape of Enterprise SSD for AI Market is defined by the presence of established global technology leaders including Samsung, Western Digital, SK Hynix, Micron Technology, KIOXIA, Intel, Seagate Technology, Kingston, ADATA, and Gigabyte, among others. These manufacturers are actively investing in next-generation NAND flash technology, advanced controller architectures, and enterprise firmware optimizations to differentiate their offerings for AI-specific workloads. Geographically, North America leads enterprise SSD adoption for AI, supported by the concentration of hyperscale data center operators and AI research institutions. Asia-Pacific, particularly China, Japan, and South Korea, represents a high-growth regional market driven by large-scale digital transformation initiatives and domestic AI infrastructure investments. As enterprise AI deployments scale globally, Enterprise SSD for AI Market continues to evolve with a strong emphasis on endurance, thermal management, and total cost of ownership optimization.
COMPETITIVE LANDSCAPE
Key Industry Players
Enterprise SSD for AI Market — Competitive Dynamics and Strategic Positioning of Leading Manufacturers
Global Enterprise SSD for AI market, valued at approximately USD 527 million in 2025 and projected to reach USD 1,086 million by 2034 at a CAGR of 11.2%, is characterized by the dominant presence of a few technology-intensive incumbents alongside a growing cadre of agile challengers. Samsung Electronics holds a commanding position in this space, leveraging its vertically integrated NAND flash manufacturing capabilities and cutting-edge PCIe 5.0 SSD portfolio tailored for high-performance AI and deep learning workloads in hyperscale data centers. Western Digital and Micron Technology closely follow, each capitalizing on robust R&D investments in 3D NAND architecture and NVMe protocol optimization to deliver ultra-low latency and high IOPS solutions demanded by neural network training and real-time data analytics applications. SK Hynix has significantly strengthened its enterprise SSD footprint through strategic partnerships and its advanced HBM and NAND integration roadmap, while KIOXIA — formerly Toshiba Memory — continues to be a formidable force with its BiCS FLASH technology. Intel, with its Optane-influenced storage heritage and deep ties to data center OEMs, also maintains a notable presence despite its evolving storage strategy.
Beyond the dominant tier, several niche yet significant players are actively shaping the competitive contours of Enterprise SSD for AI Market. Seagate Technology has pivoted aggressively toward AI-optimized storage, integrating computational storage capabilities into its enterprise SSD offerings to reduce data movement overhead in AI pipelines. Kingston Technology continues to expand its enterprise-grade SSD lineup with a focus on cost-performance balance suitable for industrial AI deployments. ADATA has carved a niche in high-endurance enterprise SSDs targeting automotive AI and edge computing applications. Gigabyte, primarily known for compute hardware, has extended its footprint into AI-ready storage infrastructure. Together, these players contribute to a highly competitive landscape where differentiation is driven by interface generation (PCIe 4.0 vs. PCIe 5.0), endurance ratings, thermal management, and deep integration with AI accelerator ecosystems such as NVIDIA GPUs and custom AI ASICs. The market’s evolution is further shaped by increasing consolidation, strategic acquisitions, and intensifying competition from emerging Asian manufacturers seeking to capture share in the fast-growing HPC, industrial, and automotive AI segments.
List of Key Enterprise SSD for AI Companies Profiled
- Samsung Electronics
- Western Digital
- Micron Technology
- SK Hynix
- KIOXIA Corporation
- Intel Corporation
- Seagate Technology
- Kingston Technology
- ADATA Technology
- Gigabyte Technology
- Solidigm (formerly Intel NAND Business)
- Phison Electronics
- Innodisk Corporation
- Silicon Motion Technology
- Transcend Information
Segment Analysis:
| Segment Category | Sub-Segments | Key Insights |
| By Type |
|
PCIe 5.0 SSD is rapidly emerging as the leading and most strategically important segment within Enterprise SSD for AI Market, driven by the insatiable bandwidth and throughput demands of modern AI and machine learning workloads.
|
| By Application |
|
High Performance Computing (HPC) stands as the dominant application segment for Enterprise SSDs in AI environments, underpinned by the exponential growth in compute-intensive AI research, large language model development, and scientific simulation workloads.
|
| By End User |
|
Cloud Service Providers & Hyperscalers represent the most influential and voluminous end-user segment in Enterprise SSD for AI Market, driven by their continuous investment in AI-optimized infrastructure at unprecedented scale.
|
| By Interface Protocol |
|
NVMe (Non-Volatile Memory Express) is the overwhelmingly dominant interface protocol segment in Enterprise SSD for AI Market, having fundamentally redefined the performance expectations of enterprise storage for AI-intensive applications.
|
| By NAND Flash Technology |
|
TLC (Triple-Level Cell) NAND currently holds the leading position in Enterprise SSD for AI Market, striking an optimal balance between storage density, write endurance, and cost efficiency that aligns well with the diverse performance and capacity requirements of enterprise AI workloads.
|
Regional Analysis: Enterprise SSD for AI Market
North America
North America’s enterprise SSD for AI market is strongly anchored by the relentless expansion of hyperscale data centers operated by major cloud providers. These facilities demand storage architectures capable of sustaining extreme throughput with minimal latency, making enterprise-grade SSDs a foundational component. The region’s data center buildout pace remains unmatched globally, directly translating into consistent and large-scale procurement of AI-optimized solid-state storage solutions.
Enterprises across North America are diversifying AI workloads beyond traditional compute-heavy tasks into real-time inferencing, edge AI deployment, and autonomous systems. This diversification is creating layered demand for enterprise SSDs optimized across different performance tiers. From financial institutions running algorithmic trading models to healthcare providers deploying diagnostic AI, the breadth of use cases is strengthening the overall enterprise SSD for AI market across the region.
The North American semiconductor design ecosystem, encompassing both established players and emerging fabless firms, actively develops NAND flash controllers and SSD firmware optimized for AI-specific access patterns. This indigenous innovation advantage allows North American enterprises to gain early access to cutting-edge storage technologies. The close proximity of chipset designers, system integrators, and enterprise buyers accelerates product iteration cycles and reduces deployment timelines significantly.
Government-backed initiatives supporting domestic AI infrastructure development, combined with private capital flowing into AI-ready data centers, are creating a highly conducive environment for enterprise SSD adoption across North America. Policy frameworks emphasizing data residency and security compliance further incentivize enterprises to invest in high-performance, locally managed storage solutions, reinforcing demand for enterprise SSDs purpose-built for AI infrastructure requirements.
Europe
Europe represents a significant and steadily maturing region within Enterprise SSD for AI Market, characterized by a distinctive combination of stringent data governance frameworks and growing enterprise AI ambitions. The European Union’s comprehensive regulatory environment, including data protection mandates and AI accountability legislation, is shaping procurement strategies that favor secure, high-performance enterprise SSDs capable of meeting compliance requirements. Countries such as Germany, France, the Netherlands, and the Nordic nations are making notable strides in building sovereign AI infrastructure, stimulating demand for locally deployed enterprise storage solutions. European financial services, manufacturing, and automotive sectors are among the most active adopters of AI-driven analytics platforms, each requiring reliable and high-endurance solid-state storage. While Europe’s enterprise SSD for AI market may trail North America in absolute scale, its emphasis on responsible AI deployment and data sovereignty is cultivating a premium segment that prioritizes quality, security certification, and long-term reliability over cost considerations alone. The region is expected to exhibit consistent growth momentum throughout the forecast period.
Asia-Pacific
Asia-Pacific is emerging as the most dynamically evolving region in Enterprise SSD for AI Market, propelled by the aggressive digitalization agendas of China, Japan, South Korea, India, and Southeast Asian nations. China’s state-backed push toward AI self-sufficiency is generating enormous internal demand for enterprise storage infrastructure, including high-performance SSDs designed for AI training clusters. South Korea and Japan contribute through globally influential semiconductor manufacturing capabilities, enabling local enterprises to access cutting-edge storage solutions at competitive terms. India’s rapidly expanding technology services sector and its growing base of AI-native startups are creating new demand pockets for enterprise SSD solutions. The region’s sheer scale of data generation, combined with accelerating cloud infrastructure investments from both domestic and international operators, positions Asia-Pacific as a high-growth market for enterprise SSDs tailored to AI workloads. Cultural and governmental emphasis on digital transformation ensures this growth trajectory remains sustained across the forecast horizon.
South America
South America occupies a developing but increasingly relevant position in Enterprise SSD for AI Market, with Brazil serving as the primary engine of regional growth. Brazil’s expanding financial technology sector, agricultural analytics platforms, and e-commerce infrastructure are generating rising demand for AI-capable storage solutions. The country’s growing investment in data center capacity, partly driven by hyperscale operators establishing regional presences, is creating structured opportunities for enterprise SSD adoption. Other South American economies, including Chile, Colombia, and Argentina, are beginning to invest in AI-ready digital infrastructure as part of broader economic modernization programs. While the region faces challenges related to import tariffs on technology components and constrained IT budgets in certain sectors, the long-term trajectory for enterprise SSD for AI market growth remains positive. As cloud penetration deepens and local AI use cases mature, South America is expected to transition from an emerging to a progressively established participant in Global enterprise SSD landscape.
Middle East & Africa
The Middle East and Africa region presents a uniquely bifurcated landscape within Enterprise SSD for AI Market. Gulf Cooperation Council nations, particularly the United Arab Emirates and Saudi Arabia, are making landmark investments in AI infrastructure as part of ambitious national digitalization strategies. Sovereign AI initiatives, smart city programs, and the development of regional hyperscale data centers are generating tangible demand for enterprise-grade SSDs optimized for AI workloads. These markets are demonstrating a willingness to invest in premium storage solutions that can support demanding AI inferencing and analytics applications. In contrast, much of the African continent remains in the early stages of enterprise digital infrastructure development, with AI adoption still concentrated among large financial institutions and telecommunications operators in key economies such as South Africa, Nigeria, and Kenya. As connectivity improves and cloud services proliferate, the broader Middle East and Africa region is expected to gradually build a more substantial presence in Enterprise SSD for AI Market over the forecast period.
Report Scope
This market research report provides a comprehensive analysis of Enterprise SSD for AI Market, covering the forecast period 2026–2034. It offers detailed insights into market dynamics, technological advancements, competitive landscape, and key trends shaping the industry.
Key focus areas of the report include:
- Market Overview: The report begins with an overview outlining its current market scenario, key growth indicators, and industry transformation drivers. It discusses macroeconomic factors, demand–supply balance, regulatory landscape, and the strategic role of enterprise SSDs in powering advancements across industries such as high performance computing, data centers, automotive, and industrial automation.
- Market Size & Forecast: Historical data and future projections for revenue, unit shipments, and market value across major regions and segments.
- Segmentation Analysis: Detailed breakdown by product type (PCIe 4.0 SSD, PCIe 5.0 SSD, and others), application, and end-user industry to identify high-growth segments and investment opportunities.
- Regional Insights: Insights into market performance across North America, Europe, Asia-Pacific, Latin America, and the Middle East & Africa, including country-level analysis where relevant.
- Competitive Landscape: Profiles of leading market participants, including their product offerings, R&D focus, manufacturing capacity, pricing strategies, and recent developments such as mergers, acquisitions, and partnerships.
- Technology Trends & Innovation: Assessment of emerging technologies, integration of AI/ML workloads, semiconductor design trends, fabrication techniques, and evolving industry standards.
- Market Drivers & Restraints: Evaluation of factors driving market growth along with challenges, supply chain constraints, regulatory issues, and market-entry barriers.
- Stakeholder Insights: Insights for component suppliers, OEMs, system integrators, investors, and policymakers regarding the evolving ecosystem and strategic opportunities.
Primary and secondary research methods are employed, including interviews with industry experts, data from verified sources, and real-time market intelligence to ensure the accuracy and reliability of the insights presented.
FREQUENTLY ASKED QUESTIONS:
What is the current market size of Enterprise SSD for AI Market?
-> Enterprise SSD for AI Market was valued at USD 527 million in 2025 and is expected to reach USD 1086 million by 2034, growing at a CAGR of 11.2% during the forecast period.
Which key companies operate in Enterprise SSD for AI Market?
-> Key players include Samsung, Western Digital, Kingston, SK Hynix, Seagate Technology, ADATA, Micron Technology, Gigabyte, KIOXIA, and Intel, among others.
What are the key growth drivers?
-> Key growth drivers include rising demand for AI and machine learning workloads in data centers, the need for high IOPS and low-latency storage solutions, growth in deep learning and neural network training applications, and increasing adoption of real-time data analytics across enterprise environments.
Which region dominates the market?
-> Asia is a significant and fast-growing region in Enterprise SSD for AI Market, with major contributions from China, Japan, South Korea, and Southeast Asia, while North America remains a dominant market driven by strong data center investments and AI infrastructure development.
What are the emerging trends?
-> Emerging trends include adoption of PCIe 5.0 SSDs for next-generation AI workloads, integration of enterprise SSDs in high performance computing (HPC) environments, growing use in automotive AI applications, and increasing demand for purpose-built storage solutions optimized for deep learning and neural network training.

Get Sample Report PDF for Exclusive Insights
Report Sample Includes
- Table of Contents
- List of Tables & Figures
- Charts, Research Methodology, and more...


