Unattended Ground Sensor Market, Global Business Strategies 2026-2034

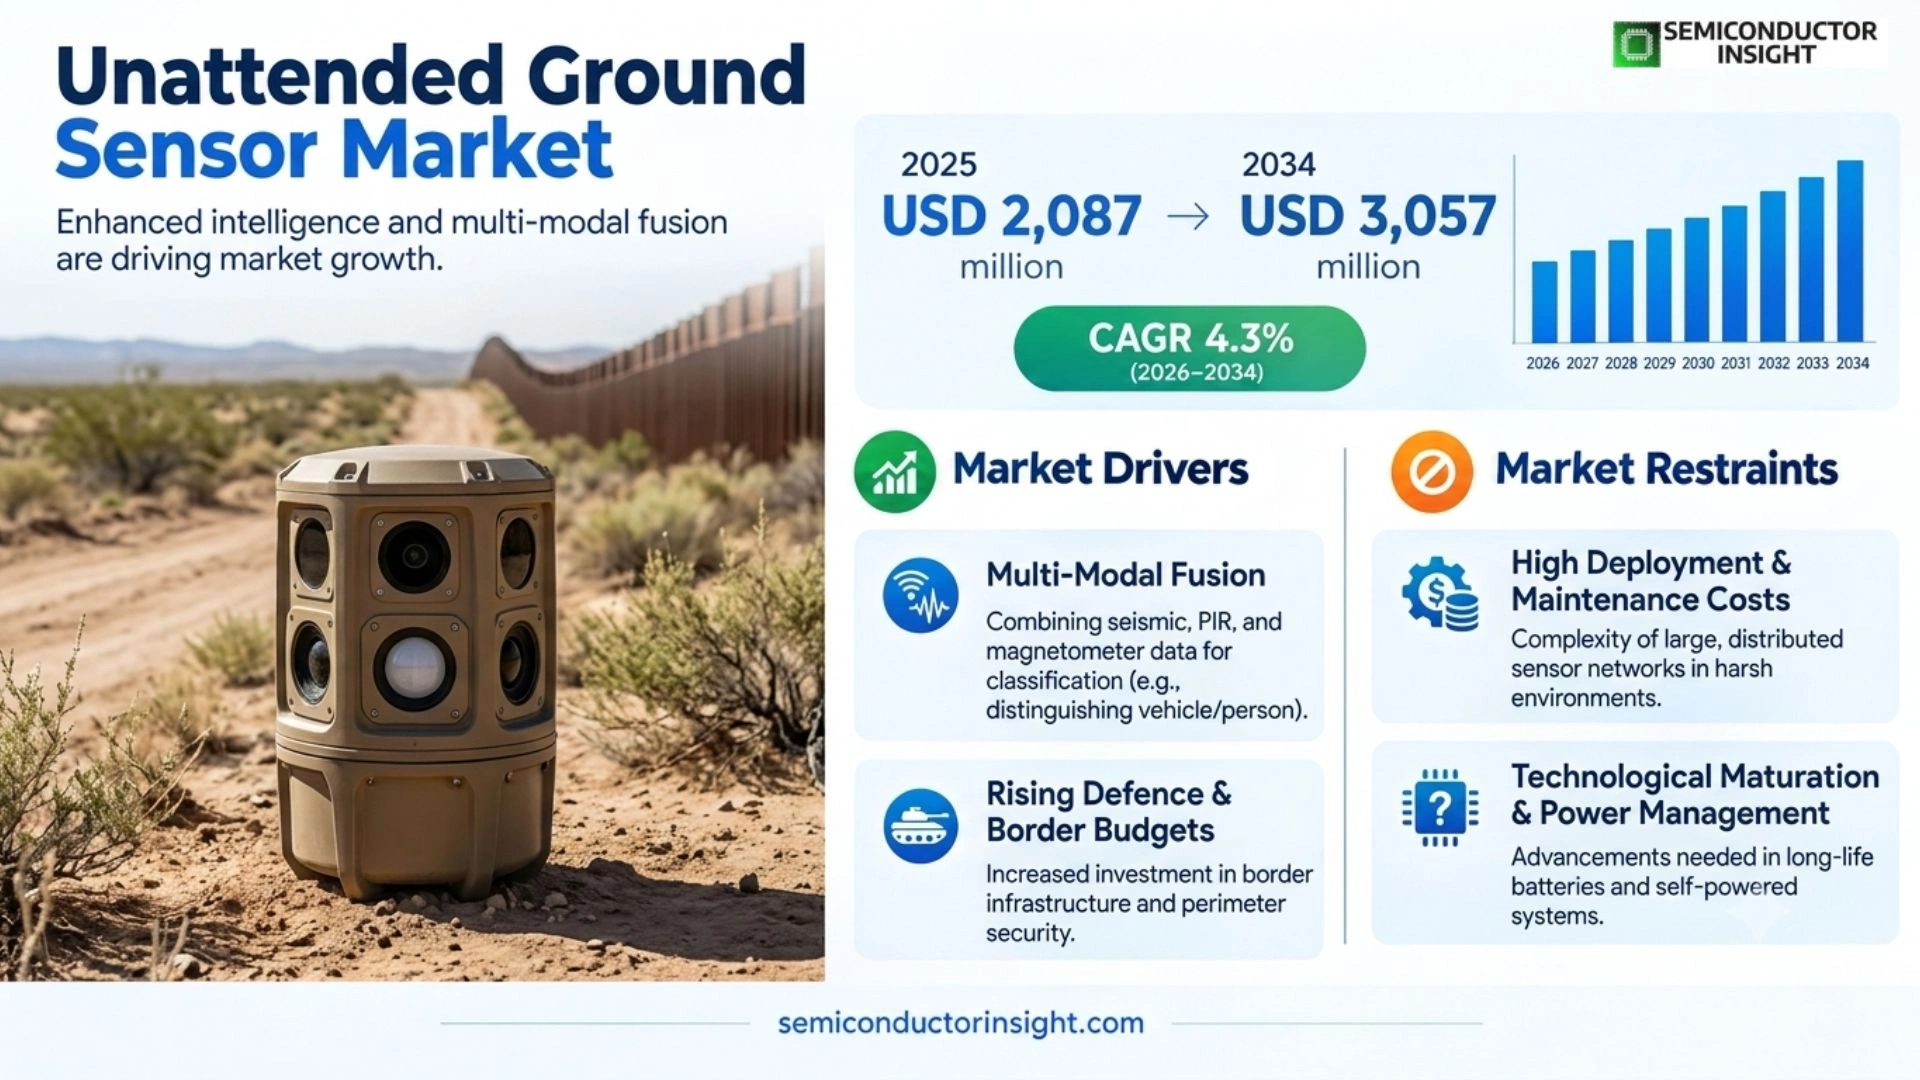
Unattended Ground Sensor Market was valued at USD 2,087 million in 2025 and is projected to reach USD 3,057 million by 2034, expanding at a CAGR of 4.3% across the 2026–2034 forecast period. North America held approximately 40% of the market in 2025 and remains the largest region, while Asia-Pacific is the fastest-growing on rising defence budgets and border infrastructure investment.

PDF Icon Download Sample Report PDF
  • Quick Dispatch

    All Orders

  • Secure Payment

    100% Secure Payment

Price range: $1,500.00 through $4,250.00

Clear

Key Statistics

2025 Market Size
USD 2,087 million
2034 Projected Size
USD 3,057 million
CAGR (2026–2034)
4.3%
Largest Market in 2025
North America (≈40% share)

Key Takeaways

  • Seismic sensors hold the largest share at approximately 35% of the market in 2025, because geophone-based detection consumes minimal power, works without line of sight and can be buried out of view – the combination that defines a covert, long-endurance ground sensor.
  • Military use accounts for more than 60% of the market, but border and critical infrastructure protection is the faster-growing application, driven by homeland security programmes that deploy sensors in far greater unit numbers than tactical military use requires.
  • North America holds approximately 40% share in 2025 and remains the largest regional market, while Asia-Pacific is the fastest-growing region on the back of border infrastructure programmes and rising regional defence budgets.
  • Multi-modal fusion is displacing single-phenomenology sensors. US Border Patrol’s northern border sensors combine seismic, magnetic and passive infrared detection, and roughly 60% now add imaging that transmits photographs or video – a shift from detection alone toward classification at the sensor.
  • Defence spending is at a post-Cold-War high but concentrated elsewhere. SIPRI recorded world military expenditure of USD 2,887 billion in 2025, up 2.9% and 2.5% of global GDP, with Europe up 14% to USD 864 billion and Germany up 24% to USD 114 billion – yet ground sensors compete for funding against munitions, air defence and counter-drone priorities.
  • The binding constraint is analysts, not sensors. GAO found US Border Patrol’s Law Enforcement Information Systems Specialists staffed at just 77% – 88 of 115 authorised positions – after 1,450 additional sensors were deployed on the northern border, and reported no agency plan to close the gap.

Unattended Ground Sensor Market Overview

Unattended Ground Sensor Market was valued at USD 2,087 million in 2025 and is projected to reach USD 3,057 million by 2034, expanding at a CAGR of 4.3% across the 2026–2034 forecast period. North America held approximately 40% of the market in 2025 and remains the largest region, while Asia-Pacific is the fastest-growing on rising defence budgets and border infrastructure investment.

Base year: 2025 · Forecast period: 2026–2034 · Historical data: 2021–2025 · Values in USD, volumes in thousand units

An unattended ground sensor is a self-contained detection device emplaced on or below the ground surface to monitor an area without an operator present. It detects the seismic, acoustic, magnetic or thermal signature of people, vehicles and animals passing nearby, classifies what it has detected, and reports over a radio or wired link to a remote monitoring position. The defining engineering constraint is energy: the device must run for months or years on a battery that cannot be replaced without exposing its location.

That constraint shapes every design decision in the category. Detection processing runs on the lowest-power silicon that will do the job, radios transmit briefly and infrequently, and the sensor spends the overwhelming majority of its life asleep, woken only when a threshold is crossed. It is the reason seismic detection dominates – a geophone draws almost nothing while idle – and the reason adding a camera to a ground sensor is a significant engineering decision rather than a component choice.

Scope covers the sensing devices themselves across seismic, acoustic, magnetic and infrared phenomenologies, together with their gateways, relays and communication subsystems, the classification and monitoring software that interprets their output, and the integration, installation and sustainment services that accompany a deployed network. Fixed surveillance towers, airborne and space-based sensing, perimeter fence detection systems and general-purpose video surveillance sit outside the definition.

The demand backdrop is unusual: defence spending is at its highest level in decades, yet this market grows at only mid-single digits. SIPRI recorded world military expenditure of USD 2,887 billion in 2025, up 2.9% in real terms and equal to 2.5% of global GDP, the highest share since 2009. Europe rose 14% to USD 864 billion, Asia and Oceania 8.1% to USD 681 billion, and Germany alone 24% to USD 114 billion.

The reason for the divergence is competition for budget rather than weak demand. Ground sensors are inexpensive relative to the platforms and munitions dominating current procurement, and the rearmament cycle is concentrated on air defence, long-range fires, ammunition stockpiles and counter-drone capability. A category priced in thousands of dollars per unit does not scale its revenue with a budget increase driven by systems priced in millions.

Where the category does grow strongly is in homeland security and border monitoring, because those missions deploy sensors in unit quantities that tactical military use never requires. GAO reported that US Border Patrol added 1,450 sensors across the eight northern border sectors between fiscal years 2019 and 2024, with individual sector holdings reaching 1,393 in Swanton, 908 in Spokane and 674 in Blaine – deployment densities that are a persistent monitoring architecture rather than an operational emplacement.

Segment Analysis: By Type

By sensing phenomenology, the market is segmented into seismic, acoustic, magnetic, infrared and other sensors. Seismic sensors hold the largest share at approximately 35% in 2025 on their minimal power draw and covert emplacement, while infrared and multi-modal configurations are growing fastest as buyers shift from detecting that something passed to classifying what it actually was.

Type Function Market position
Seismic UGS Geophones or accelerometers detect ground vibration from footsteps, vehicle movement and machinery, with signal processing distinguishing signature patterns Largest share at approximately 35% in 2025. The workhorse of the category and the reason unattended sensing is practical at all: a geophone draws negligible power while idle, needs no line of sight, and can be fully buried, making it both covert and long-endurance. Its weakness is discrimination – distinguishing a person from livestock or a passing truck from a nearby road depends on processing quality, which is where suppliers actually compete.
Infrared UGS Passive infrared detects thermal contrast from a body moving across the field of view; active variants use a beam break across a monitored line Among the fastest-growing types. Passive infrared confirms that a heat-emitting body passed, which materially reduces false alarms when fused with seismic detection. It is also the natural bridge to imaging: US Border Patrol’s northern border sensors combine seismic, magnetic and passive infrared, and roughly 60% now include imaging that transmits photographs or video. Line-of-sight dependence and vulnerability to thermal clutter are the constraints.
Magnetic UGS Magnetometers detect disturbance in the local magnetic field caused by ferrous mass moving nearby A smaller but analytically valuable segment, because it answers a question the other phenomenologies cannot: whether the object carries significant ferrous material. That distinguishes a vehicle from a group on foot, and an armed individual from an unarmed one. Rarely deployed alone; almost always used as a discriminating input within a multi-modal device, which is exactly how it appears in the northern border deployment.
Acoustic UGS Microphone arrays detect and classify sound signatures, and where multiple nodes are networked, bearing and location can be derived Effective for vehicle, aircraft and gunshot detection at greater range than seismic sensing permits, and capable of classification that seismic detection alone cannot achieve. Its costs are power and environment: continuous audio processing consumes far more energy than threshold-triggered seismic detection, and wind and rain degrade performance substantially in exposed terrain.
Others Chemical, radiological and nuclear detection nodes, radar-based ground sensors and fibre-optic distributed acoustic sensing Specialised segments serving specific mission requirements rather than general surveillance. Distributed fibre sensing is the most structurally interesting: a single buried cable acts as a continuous line of virtual sensors, which suits long linear assets such as pipelines and borders and competes with discrete nodes on a fundamentally different cost basis.

Why multi-modal fusion is displacing single-phenomenology devices

A single sensing mode produces detections; combining modes produces classifications. Seismic detection establishes that something passed, passive infrared confirms it was warm-bodied, and a magnetometer indicates whether it carried ferrous mass – together they distinguish a vehicle, a person and an animal with far greater confidence than any one input allows. The US Border Patrol deployment is explicitly built this way, and false alarm reduction is the operational reason it matters.

Segmentation by technology, component and end user

Segmentation axis Categories Commercial significance
By technology Wired · Wireless · Hybrid Wireless dominates tactical and rapidly deployed applications because emplacement time is measured in minutes and no trenching is required, but it inherits the power budget and radio-detectability problems that define the category. Wired networks suit permanent installations at fixed sites where power and communications infrastructure already exist. Hybrid architectures – wired backbone with wireless leaf nodes – are increasingly the default for persistent border and infrastructure monitoring.
By component Hardware · Software · Services Hardware remains the largest component but software is the fastest-growing, and the GAO finding explains why: deploying sensors faster than analysts can monitor them creates direct commercial demand for automated classification and alert triage. Services – installation, maintenance, battery replacement and network sustainment – generate recurring revenue across a deployed network’s life and are frequently more valuable than the original hardware award.
By end user Defense agencies · Homeland security · Commercial enterprises Defence agencies buy for tactical and force-protection missions in modest unit quantities at high specification. Homeland security buys for persistent border monitoring in far greater quantities at lower unit cost – the volume engine of the category. Commercial buyers, protecting pipelines, utilities, mines and remote sites, are the smallest group but the least constrained by procurement cycles.

Segment Analysis: By Application

By application, the market is segmented into military use, critical infrastructure protection and civil use. Military applications account for more than 60% of the market in 2025, while border security and critical infrastructure protection is the faster-growing area because persistent monitoring missions deploy sensors in unit quantities that tactical military use does not require.

Application Demand characteristics
Military Use More than 60% of the market. Perimeter defence for forward operating bases, route and choke-point monitoring, early warning screens along likely approaches, and special operations reconnaissance. Requirements are specification-led rather than price-led: covert emplacement, months of unattended endurance, encrypted and low-probability-of-intercept communications, and survivability in extreme temperature and humidity. Unit quantities per programme are modest, procurement cycles are long, and qualification barriers are high – which makes each programme win durable but slow to convert.
Critical Infrastructure Protection The fastest-growing application. Pipelines, electrical transmission corridors, substations, water infrastructure, ports, airports and remote industrial sites. Growth is driven by the recognition that dispersed linear assets cannot be protected by fixed cameras and patrols alone, and by regulatory and insurance pressure on operators to demonstrate monitoring capability. Buyers are less constrained by defence procurement cycles and more sensitive to false alarm rates, since every false alert consumes an operational response.
Civil and Border Security Use Border monitoring, wildlife and anti-poaching protection, disaster monitoring and law enforcement surveillance. Border deployment is the volume driver: GAO recorded 1,450 additional sensors added across US northern border sectors between fiscal 2019 and 2024, with Swanton alone holding 1,393 sensors as of 30 September 2024. Deployment at this density represents a permanent monitoring architecture, generating sustained replacement, battery and service demand rather than one-time procurement.

What actually triggers a purchase

Purchases in this category are almost never driven by technologyhttps://semiconductorinsight.com/report/semiconductor-photolithography-equipment-market/https://semiconductorinsight.com/report/floating-board-to-board-connector-market/ refresh. They follow a specific event: a mission requirement that existing surveillance cannot cover, a documented incident or intrusion, a regulatory obligation placed on an infrastructure operator, or a funded programme with a defined delivery schedule. Understanding which of those four applies is more useful to a supplier than any growth rate, because each carries a different sales cycle, budget owner and evaluation criterion.
Unattended Ground Sensor Market Outlook

Regional Analysis

North America holds approximately 40% of the unattended ground sensor market in 2025, the largest regional share, on the strength of sustained border monitoring deployment and a deep domestic supplier base. Asia-Pacific is the fastest-growing region, supported by regional defence spending that SIPRI recorded at USD 681 billion in 2025, up 8.1%, and by extensive contested land borders requiring persistent monitoring.

How does regional demand differ across the unattended ground sensor market?

The regions buy for genuinely different missions. North America’s demand is dominated by a single persistent border monitoring programme operating at scale. Europe’s is rearmament-driven and oriented toward eastern flank surveillance and critical infrastructure protection after documented sabotage incidents. Asia-Pacific’s is border-security-driven across long contested land frontiers. The Middle East buys for site and energy infrastructure protection. Each mission implies a different sensor mix and a different procurement route.

Region Position Growth outlook Demand profile What decides supplier selection
North America Largest (≈40%) Moderate Border monitoring led Programme qualification, sustainment capability, domestic content and security clearance
Asia-Pacific Second largest Highest in market Border security led Local content and offset requirements, price, ruggedisation for climate extremes
Europe Third largest High Rearmament and infrastructure led NATO interoperability, sovereign supply, eastern flank delivery timelines
Middle East & Africa Fourth Moderate Site and energy protection led Project delivery, environmental ruggedisation, integration with existing security systems
South America Smallest Emerging Resource and border led Delivered cost, distributor presence, ease of maintenance

North America LARGEST

Why does North America lead the unattended ground sensor market?

North America leads because it operates the world’s largest persistent ground sensor deployment. GAO reported that US Border Patrol added 1,450 sensors across eight northern border sectors between fiscal 2019 and 2024 – with Swanton holding 1,393, Spokane 908 and Blaine 674 as of 30 September 2024 – alongside 28 additional camera towers. The region also hosts most of the supplier base, including L3Harris, Northrop Grumman, Textron Systems, Applied Research Associates, McQ, Qual-Tron and Quantum Technology Sciences.

Market positionLargest region (≈40%)
Growth outlookModerate
Demand profileBorder monitoring led
Market access gateProgramme qualification, domestic content, clearances
Country Position in region What drives demand
United States Dominant Operates both the largest homeland security sensor deployment and the largest military programme base, with SIPRI recording US military expenditure of USD 954 billion in 2025. Northern border sector holdings alone reached 1,393 sensors in Swanton, 908 in Spokane, 674 in Blaine, 645 in Houlton, 462 in Havre, 349 in Grand Forks, 300 in Buffalo and 261 in Detroit.
Canada Established Northern border monitoring conducted in coordination with US agencies, plus remote infrastructure and resource site protection across large sparsely populated territory. Extreme cold performance and long battery endurance are governing specifications rather than secondary considerations.
Mexico Emerging Border monitoring and critical infrastructure protection, particularly for energy and pipeline assets. Procurement is project-linked and price-sensitive relative to US practice, with integration into existing security operations centres a frequent requirement.

Market instances

  • US northern border sensor holdings are the clearest published evidence of deployment scale anywhere. GAO recorded 1,450 additional sensors placed across eight sectors between fiscal 2019 and 2024, describing devices that detect, track and differentiate humans, animals and vehicles using seismic, magnetic and passive infrared capabilities, with approximately 60% featuring imaging that transmits photographs or video feeds.
  • The binding constraint on the region’s largest programme is people, not equipment. GAO found Law Enforcement Information Systems Specialists – the personnel who monitor sensor and camera feeds – staffed at 77%, with 88 of 115 authorised positions filled and sector rates ranging from 57% in Swanton to 92% in Spokane, and reported that Border Patrol has no plan to address the gap.
  • Availability of deployed surveillance is measurably degrading in some sectors. GAO recorded camera availability falling from 90% to 76% in Detroit and from 98% to 86% in Swanton between fiscal 2021 and 2024. Sustainment – battery replacement, repair and network maintenance – is therefore a live commercial requirement rather than an assumed background service.
  • The supplier base is unusually concentrated and defence-anchored. L3Harris reported 2025 revenue of USD 21.9 billion, up 3%, with orders of USD 27.5 billion and a 1.3x book-to-bill ratio, and its Communication Systems segment generated USD 5.7 billion at a 25.2% margin. Ground sensors sit within portfolios of this scale, which shapes how much dedicated development attention the category receives.
In the full report: country-level market size, unit shipments, average selling price and CAGR for every market listed above across 2021–2034, plus phenomenology, component and end-user splits.

Asia-Pacific FASTEST-GROWING

Why is Asia-Pacific the fastest-growing unattended ground sensor market?

Asia-Pacific grows fastest because it combines rising defence budgets with the longest contested land borders in the world. SIPRI recorded regional military expenditure of USD 681 billion in 2025, up 8.1%, with China at USD 336 billion and India at USD 92.1 billion, up 8.9%. Extended mountain and jungle frontiers are precisely the terrain where fixed towers and patrols are impractical and emplaced sensors are the only viable persistent monitoring option.

Market positionSecond largest
Growth outlookHighest in market
Demand profileBorder security led
Market access gateLocal content and offset requirements
Country Position in region What drives demand
China Largest by expenditure SIPRI recorded military spending of USD 336 billion in 2025, up 7.4%. Border monitoring across extensive land frontiers and critical infrastructure protection are served overwhelmingly by domestic suppliers, making the market large but substantially closed to international vendors.
India Fastest growing Military expenditure reached USD 92.1 billion in 2025, up 8.9%. Long contested mountain borders in difficult terrain create demand for emplaced sensing where towers and patrols cannot operate, and indigenous content requirements steer procurement toward domestic manufacture or local partnership.
South Korea Established Persistent monitoring of a heavily instrumented demarcation line, one of the most sensor-dense border environments anywhere. Requirements emphasise reliability and false alarm suppression, since every alert triggers a defined operational response.
Japan & Australia High specification Remote installation monitoring, maritime approach surveillance and critical infrastructure protection across dispersed geography. Both markets favour established international suppliers and interoperability with allied systems over lowest unit cost.
Southeast Asia Emerging, high growth Border monitoring, anti-smuggling operations and increasingly conservation and anti-poaching applications, where sensor networks protect wildlife across areas too large to patrol.

Market instances

  • Regional military expenditure reached USD 681 billion in 2025, up 8.1% – the second-largest regional total after the Americas and among the fastest-growing. Unlike Europe’s rearmament, which is weighted toward air defence and munitions, a meaningful share of Asian spending addresses land border surveillance, which maps more directly onto ground sensor demand.
  • Terrain is the region’s defining commercial driver. Mountain, jungle and riverine borders defeat fixed tower surveillance and are dangerous and expensive to patrol continuously. Emplaced sensors are frequently the only practical persistent monitoring option, which makes this a requirement-led rather than a budget-led market.
  • Local content and offset requirements shape who wins. India, China and several Southeast Asian markets condition defence procurement on domestic manufacture or technology partnership, which means international suppliers compete through joint ventures and licensed production rather than through direct export – a materially different commercial model.
  • Conservation applications are a genuine and growing civil segment. Anti-poaching sensor networks across Southeast Asian and, separately, African protected areas apply the same seismic and acoustic detection technology to a civil mission with different funding sources – conservation trusts and international programmes rather than defence budgets.
In the full report: country-level market size, unit shipments, average selling price and CAGR for every market listed above across 2021–2034, plus phenomenology, component and end-user splits.

Europe HIGH GROWTH

What is driving unattended ground sensor demand in Europe?

European demand is rearmament-driven and has changed character since 2022. SIPRI recorded European military expenditure of USD 864 billion in 2025, up 14%, with Germany rising 24% to USD 114 billion. Two requirements dominate: persistent surveillance of the eastern flank across terrain too extensive to patrol, and protection of critical energy, communications and transport infrastructure following documented sabotage incidents.

Market positionThird largest
Growth outlookHigh
Demand profileRearmament and infrastructure led
Market access gateNATO interoperability, sovereign supply
Country Position in region What drives demand
Germany Largest by expenditure SIPRI recorded military spending of USD 114 billion in 2025, up 24% – the sharpest increase among major spenders. Demand spans force protection, eastern flank deployment support and domestic critical infrastructure monitoring, with procurement increasingly weighted toward European sovereign supply.
Poland and the Baltic states Fastest growing Frontline eastern flank states investing heavily in border and approach surveillance. Requirements emphasise rapid deployment, covert emplacement and interoperability with NATO command systems, and delivery timelines frequently outweigh unit price in award decisions.
United Kingdom Established SIPRI recorded USD 89 billion in 2025, down 2.0%. Demand centres on force protection, critical national infrastructure and a supplier base including Cobham and Ferranti Technologies, with export activity significant relative to domestic procurement.
France Established Military expenditure of USD 68 billion in 2025, up 1.5%. Thales supplies from within the region, and domestic procurement favours sovereign capability and integration with national command systems.
Nordic countries High specification Extensive remote borders and Arctic terrain requiring extreme cold endurance and very long unattended operating life. Exensor Technology supplies from the region, and specifications here are among the most demanding environmentally anywhere.

Market instances

  • European military expenditure rose 14% to USD 864 billion in 2025, the fastest regional increase SIPRI recorded, with Germany up 24% to USD 114 billion. The scale of the increase is unambiguous, but the allocation is not automatically favourable: rearmament budgets are weighted toward air defence, long-range fires and ammunition, and ground sensors compete for a residual share.
  • Critical infrastructure protection has become a distinct funded mission rather than a subset of defence. Documented sabotage of energy and communications infrastructure has moved monitoring of pipelines, cables and transmission corridors from operator discretion toward national security requirement, creating a buyer set with different budgets and faster procurement than defence ministries.
  • Sovereign supply is an explicit procurement criterion in the current European cycle. Programmes increasingly require European design, manufacture or licensed production, which advantages Thales, Exensor Technology, Ferranti Technologies and Cobham relative to US suppliers on the same technical specification – a policy effect rather than a capability one.
  • Nordic and Baltic environmental requirements set the technical ceiling. Sensors must operate unattended through Arctic winters where battery chemistry degrades and access for maintenance is seasonal, which makes endurance and cold-weather reliability the differentiating specifications in exactly the markets growing fastest.
In the full report: country-level market size, unit shipments, average selling price and CAGR for every market listed above across 2021–2034, plus phenomenology, component and end-user splits.

Middle East & Africa

What shapes the Middle East and Africa unattended ground sensor market?

Middle East and Africa demand is dominated by fixed-site and energy infrastructure protection rather than by conventional border defence. SIPRI recorded Middle East military expenditure of USD 218 billion in 2025, essentially flat at 0.1%, while Africa rose 8.5% to USD 58.2 billion. Pipeline, oilfield and remote facility monitoring across vast and lightly populated terrain is the recurring requirement.

Market positionFourth
Growth outlookModerate
Demand profileSite and energy protection led
Market access gateProject delivery, environmental ruggedisation
Country Position in region What drives demand
Saudi Arabia & GCC Largest by value Oilfield, pipeline and facility protection across extensive desert terrain, plus border monitoring. Extreme temperature, sand ingress and solar loading are governing environmental specifications, and procurement is project-structured with integration into existing security operations centres.
Israel Largest by design activity A dense sensor and electro-optics development base including Seraphim Optronics, supplying both domestic border monitoring requirements and export markets. Design influence substantially exceeds the country’s share of regional procurement.
Türkiye Manufacturing led Domestic defence electronics manufacture at export scale alongside extensive border monitoring requirements. The region’s most significant resident producer as well as consumer of ground sensing equipment.
South Africa Conservation and infrastructure led Anti-poaching sensor networks across protected areas and mining and utility infrastructure monitoring. Conservation applications are funded outside defence budgets, which makes procurement cycles shorter and more price-sensitive.
North and Sahel Africa Emerging Border monitoring and energy infrastructure protection, with African military expenditure rising 8.5% to USD 58.2 billion in 2025. Procurement is heavily project- and donor-linked rather than programmatic.

Market instances

  • Energy infrastructure protection is the region’s defining application. Pipelines and remote wellheads extend across terrain that cannot be patrolled or covered by fixed cameras, and interdiction losses are large enough that monitoring investment is justified commercially rather than only on security grounds – a different and faster funding route than defence procurement.
  • Environmental ruggedisation is the practical qualification barrier. Sustained extreme heat, sand ingress and intense solar loading defeat equipment qualified only to temperate specifications, and suppliers without demonstrated regional field performance are frequently excluded before technical evaluation on capability begins.
  • African conservation programmes constitute a genuine civil market with separate funding. Anti-poaching sensor networks across protected areas apply the same seismic and acoustic detection technology under conservation trust and international programme funding, with procurement cycles far shorter than defence equivalents and correspondingly greater price sensitivity.
In the full report: country-level market size, unit shipments, average selling price and CAGR for every market listed above across 2021–2034, plus phenomenology, component and end-user splits.

South America EMERGING

Which South American markets are growing fastest for unattended ground sensors?

South America is the smallest regional market, with demand arising from resource infrastructure protection, anti-smuggling operations along extensive and lightly monitored borders, and environmental and conservation monitoring in the Amazon basin. Procurement is project-linked and price-sensitive, and ease of maintenance in remote locations frequently outweighs detection performance in supplier selection.

Market positionSmallest
Growth outlookEmerging
Demand profileResource and border led
Market access gateDelivered cost, maintainability
Country Position in region What drives demand
Brazil Largest Amazon border monitoring, environmental and deforestation surveillance, and mining and pipeline infrastructure protection. The scale of territory relative to available personnel makes unattended sensing structurally attractive, though funding is the constraint rather than requirement.
Colombia Second Border monitoring, counter-narcotics operations and energy infrastructure protection, particularly for pipelines subject to repeated interdiction. One of the region’s most operationally active users of ground sensing.
Chile & Peru Resource led Mining site and access route monitoring across remote high-altitude terrain, where sensor networks reduce reliance on physical patrols in difficult and dangerous conditions.
Argentina Emerging Border monitoring and agricultural and energy infrastructure protection, with procurement constrained by budget conditions and weighted heavily toward delivered cost and local support availability.

Market instances

  • Pipeline interdiction makes infrastructure monitoring commercially self-justifying. Where product theft losses are substantial and recurrent, monitoring investment is evaluated against recovered losses rather than against a security budget – a faster and more reliable funding route than defence procurement in the region.
  • Environmental monitoring is a genuine and distinctly funded application. Acoustic detection of illegal logging and mining activity across Amazon territory uses the same core technology as security sensing but draws on environmental and international programme funding, with different buyers and different evaluation criteria.
  • Maintainability governs supplier selection more than detection performance. Sensors emplaced days from the nearest service point must be repairable or replaceable by non-specialist personnel, which favours simple, robust designs with long battery life over sophisticated multi-modal devices requiring specialist support.
In the full report: country-level market size, unit shipments, average selling price and CAGR for every market listed above across 2021–2034, plus phenomenology, component and end-user splits.

Key Unattended Ground Sensor Manufacturers and Competitive Landscape

The market divides between large defence primes that carry ground sensors within far broader portfolios – L3Harris, Northrop Grumman, Textron Systems and Thales – and dedicated specialists including McQ, Qual-Tron, Exensor Technology, Quantum Technology Sciences, Applied Research Associates and Seraphim Optronics for whom the category is a primary business rather than a line item.

That split is the defining structural fact about competition here. For a prime with revenue in the tens of billions, unattended ground sensors are a small product line: L3Harris reported 2025 revenue of USD 21.9 billion with orders of USD 27.5 billion at a 1.3x book-to-bill ratio, and its Communication Systems segment alone generated USD 5.7 billion. Ground sensors within a portfolio of that scale receive proportionate development attention, which creates genuine space for specialists.

Primes win where the sensor is part of a larger system-of-systems award – integrated border surveillance, force protection architectures, or command and control programmes where the sensing layer is one element among many. Their advantages are programme management capability, security clearances, established contract vehicles and the ability to carry integration risk across a multi-year delivery, none of which a specialist can readily replicate.

Specialists win where the sensor itself is the deliverable and its performance is the evaluation criterion. Detection range, classification accuracy, false alarm rate, battery endurance and emplacement time are their competitive ground, and their advantage is focus: an organisation whose entire engineering effort addresses power budget and discrimination will generally out-perform a product line inside a diversified prime on exactly those metrics.

Software is becoming a third competitive axis and may prove the most consequential. The GAO finding that US Border Patrol’s monitoring specialists are staffed at 77% – 88 of 115 authorised positions, with Swanton at 57% – while 1,450 additional sensors were deployed describes an operational problem no additional hardware can solve. Suppliers offering automated classification and alert triage are addressing the constraint that actually limits deployed capability.

Tier structure

Tier Companies Basis of competition
Tier 1 – Defence primes L3Harris Technologies (Harris), Northrop Grumman Corporation, Thales Group, Textron Systems System-of-systems integration, programme management scale, security clearances and established contract vehicles with defence and homeland security customers
Tier 2 – Dedicated specialists McQ Inc., Exensor Technology, Applied Research Associates, Quantum Technology Sciences, Qual-Tron Inc., Seraphim Optronics Sensor-level performance – detection range, classification accuracy, false alarm suppression, battery endurance and emplacement speed – supported by deep single-category engineering focus
Tier 3 – Component and regional suppliers Cobham (Micromill), Ferranti Technologies, PrustHolding B.V., regional integrators Subsystem and component supply into larger programmes, regional market access, and integration of third-party sensing into national security architectures

Key companies profiled

  • Harris (L3Harris Technologies)
  • Northrop Grumman Corporation
  • Applied Research Associates (ARA)
  • Textron Systems
  • L-3 Communications
  • Thales Group
  • Cobham (Micromill)
  • Ferranti Technologies
  • McQ Inc.
  • Quantum Technology Sciences
  • Exensor Technology
  • PrustHolding B.V.
  • Qual-Tron Inc.
  • Seraphim Optronics

Unattended Ground Sensor Production Capacity and Supply-Side Analysis

Production is concentrated in the United States, Western Europe and Israel, at volumes measured in thousands of units per programme rather than in the mass-manufacturing quantities typical of commercial electronics. Manufacturing capacity has never constrained the market; the constraints are qualification, security-cleared production requirements, and the component obsolescence problem created by very long programme lifecycles.

An unattended ground sensor is a ruggedised low-power electronics assembly: sensing element, signal processing, radio, battery and environmental housing, built to survive burial, immersion, temperature extremes and years without maintenance. The manufacturing challenge is qualification and consistency rather than throughput – every unit must meet the same environmental and endurance specification, and testing to demonstrate that consumes more programme time than assembly does.

Batch economics govern the category. A programme award may cover a few thousand units delivered over several years, which is too small to justify dedicated automated production and large enough to require formal configuration control. Suppliers therefore run flexible low-volume lines, and unit costs stay high relative to the component content – a structural feature buyers frequently misread as margin rather than as the true cost of qualified low-volume manufacture.

Component obsolescence is the most persistent supply-side problem. A sensor designed today may remain in production for a decade and in the field for two, while the commercial semiconductors inside it turn over every few years. Suppliers must fund last-time-buy inventory, manage form-fit-function replacements and requalify substitutes against the original environmental specification – a cost that scales with programme longevity rather than with volume.

Battery chemistry and export control are the two remaining constraints worth naming. Endurance requirements push suppliers toward lithium chemistries whose transport and storage are regulated, complicating international distribution. Separately, sensing and communications technologies in this category are frequently subject to export control, which limits which markets a given product can address and shapes where suppliers choose to manufacture.

Unattended Ground Sensor Market Dynamics: Drivers, Restraints and Opportunities

Growth is driven by elevated global defence spending, persistent border monitoring programmes deploying at network scale, critical infrastructure protection mandates and the shift toward multi-modal sensing with on-device classification. The principal restraints are competition for defence budget against far more expensive platform priorities, the analyst capacity required to act on sensor output, and procurement cycles measured in years.

MARKET DRIVERS

Drivers Impact Analysis*

Driver (~) % impact on CAGR forecast Geographic relevance Impact timeline
Elevated global defence expenditure at 2.5% of world GDP +1.4% Europe, Asia-Pacific, Middle East Medium term (2–4 years)
Persistent border monitoring programmes deploying at network scale +1.1% North America, Asia-Pacific, Europe Medium term (2–4 years)
Critical infrastructure protection becoming a funded national security mission +0.9% Europe, North America, Middle East Short term (≤ 2 years)
Multi-modal fusion and on-device classification raising value per unit +0.7% Global, homeland security first Medium term (2–4 years)
Sustainment, battery and service revenue from deployed networks +0.5% North America, Europe Long term (≥ 4 years)
Conservation and environmental monitoring as a separately funded civil application +0.3% Africa, South America, Southeast Asia Long term (≥ 4 years)

Defence spending is high but the allocation is competitive

SIPRI recorded world military expenditure of USD 2,887 billion in 2025, up 2.9% in real terms and equal to 2.5% of global GDP – the highest share since 2009 – with Europe up 14% to USD 864 billion and spending outside the United States growing 9.2%. That backdrop is unambiguously supportive, but ground sensors compete for allocation against air defence, long-range fires and munitions replenishment, which is why category growth runs well below the headline budget increase.

Border monitoring deploys at network scale

Tactical military use emplaces sensors in tens; persistent border monitoring deploys them in thousands. GAO recorded 1,450 additional sensors across US northern border sectors between fiscal 2019 and 2024, with Swanton alone at 1,393 and Spokane at 908 as of 30 September 2024. Deployments at this density behave like infrastructure – generating sustained replacement, battery and maintenance demand rather than a single procurement event.

Infrastructure protection has become a security mission

Documented sabotage of energy and communications assets has shifted monitoring of pipelines, cables and transmission corridors from operator discretion toward national security requirement, particularly across Europe. This creates a buyer set distinct from defence ministries, with different budgets, faster procurement cycles and greater sensitivity to false alarm rates – since every false alert consumes a real operational response from a commercial operator.

MARKET RESTRAINTS

Restraints Impact Analysis*

Restraint (~) % impact on CAGR forecast Geographic relevance Impact timeline
Competition for defence budget against higher-priority platforms -1.3% Global, rearmament programmes first Medium term (2–4 years)
Analyst and monitoring capacity limiting usable deployment scale -1.0% North America, Europe Short term (≤ 2 years)
Long defence procurement cycles delaying revenue conversion -0.8% Global, defence agency customers Medium term (2–4 years)
False alarm rates constraining civil and commercial adoption -0.6% Global, commercial and infrastructure buyers Medium term (2–4 years)
Component obsolescence and export control complicating supply -0.4% Global Long term (≥ 4 years)

Sensors are cheap in a market buying expensive things

The current rearmament cycle is dominated by air defence systems, long-range precision fires, ammunition stockpiles and counter-drone capability – categories priced in millions per unit. Ground sensors, priced in thousands, do not scale their revenue with budget increases driven by those priorities. This is the primary reason a 4.3% CAGR coexists with the highest defence spending in decades, and it is structural rather than cyclical.

Deployment has outrun the capacity to monitor it

GAO found that US Border Patrol’s Law Enforcement Information Systems Specialists – the personnel who watch sensor and camera feeds – were staffed at 77%, with 88 of 115 authorised positions filled and Swanton sector at 57%, while 1,450 additional sensors were deployed. GAO reported that Border Patrol leadership had no plans to improve recruitment or retention. Additional sensors deliver no additional capability once nobody is available to act on their output.

Sustainment degrades measurably in the field

GAO recorded camera availability in the same programme falling from 90% to 76% in Detroit sector and from 98% to 86% in Swanton between fiscal 2021 and 2024. Deployed surveillance requires battery replacement, repair and network maintenance in remote locations, and availability decline of this magnitude indicates that sustainment capacity, not procurement, limits the operational value of an installed network.

MARKET OPPORTUNITIES

Automated classification and alert triage software

The clearest opportunity in the category is addressing the constraint GAO documented. Software that classifies detections automatically, suppresses false alarms and presents only actionable events directly attacks the analyst shortage that limits deployed capability. It also carries software economics – higher margin, recurring licensing, and the ability to upgrade an installed network’s capability without replacing a single sensor.

Critical infrastructure protection as a commercial market

Pipeline, transmission, port and utility operators buy on different terms from defence ministries: faster cycles, commercial contracting, and evaluation against loss reduction rather than against a threat assessment. As monitoring obligations tighten across Europe and North America, this buyer set offers volume growth without the procurement timelines that make defence revenue so slow to convert.

Sustainment and battery service as recurring revenue

Networks of the density GAO documented require continuous battery replacement, repair and maintenance across remote terrain, and measured availability decline shows the need is real rather than theoretical. Suppliers structuring sustainment as a contracted service rather than as spare-part sales convert episodic hardware awards into recurring revenue and simultaneously address the availability problem that limits their customers’ operational capability.

Distributed fibre-optic acoustic sensing for linear assets

A single buried fibre acts as a continuous line of virtual sensors, which suits pipelines, borders and transmission corridors on a fundamentally different cost basis from discrete nodes – no per-node battery, no individual emplacement, no separate radio link. Where a linear asset already has fibre alongside it, the marginal cost of monitoring falls dramatically, opening applications that discrete sensors could never economically cover.

Unattended Ground Sensor Supply Chain Analysis

The value chain runs from sensing elements, low-power processors, radios and batteries through ruggedised assembly and environmental qualification to a channel dominated by defence and homeland security programme contracting. Value concentrates in classification software and programme position rather than in hardware manufacture, and sustainment generates revenue across a deployed network’s operational life.

UpstreamGeophones and accelerometers, magnetometers, passive infrared and imaging sensors, low-power microcontrollers and DSPs, radio modules and antennas, lithium primary batteries, ruggedised housings and connectors
ManufacturingLow-volume ruggedised electronics assembly, environmental sealing and potting, calibration, environmental and endurance qualification testing, configuration control and lot traceability
ChannelDirect defence and homeland security programme contracting, prime contractor subcontract supply, commercial infrastructure integrators, government framework vehicles
DownstreamDefence agencies, border and homeland security agencies, pipeline and utility operators, port and airport authorities, mining and remote site operators, conservation programmes

Upstream. Most components are commercially available, and none is scarce in the ordinary sense. The real exposure is longevity: a sensor designed today may remain in production for a decade while its commercial semiconductors turn over every few years, forcing last-time-buy inventory and requalification of substitutes. Lithium primary batteries add a regulatory rather than availability constraint, since their transport and storage are controlled internationally.

Manufacturing. Assembly is low-volume ruggedised electronics work, where environmental sealing, potting and endurance qualification consume more programme time than the build itself. Configuration control and lot traceability are contractual requirements rather than good practice, and security-cleared production is mandatory for some programmes – a combination that keeps unit costs high relative to component content and limits which facilities can serve which customers.

Channel. Defence and homeland security procurement dominates, through direct programme contracting or subcontract supply beneath a prime. Both routes are slow, formal and relationship-dependent, with qualification and past performance weighing heavily. Commercial infrastructure integrators form a materially faster second channel, buying on commercial terms against loss-reduction cases rather than threat assessments – increasingly the more attractive route for suppliers seeking growth.

Downstream. Once a sensor network is deployed and integrated into a monitoring architecture, it persists for years and generates sustained battery, repair and sustainment demand. Replacement typically follows the installed devices’ end of life rather than any competitive re-evaluation, which makes the original programme win unusually durable – and correspondingly makes displacing an incumbent very difficult outside a new programme or a capability step-change.

Recent Developments in the Unattended Ground Sensor Market

  • 27 April 2026 Market data
    SIPRI reported world military expenditure of USD 2,887 billion in 2025, up 2.9% in real terms and equal to 2.5% of global GDP – the highest share since 2009. Europe rose 14% to USD 864 billion, Asia and Oceania 8.1% to USD 681 billion and Africa 8.5% to USD 58.2 billion, while the Middle East was flat at USD 218 billion. The United States spent USD 954 billion, down 7.5%, China USD 336 billion, up 7.4%, and Germany USD 114 billion, up 24%. Spending outside the United States grew 9.2%, and the top three spenders accounted for 51% of the global total.
    Source
  • 12 February 2026 Market data
    GAO reported that US Border Patrol deployed 1,450 additional unattended ground sensors across the eight northern border sectors between fiscal years 2019 and 2024. As of 30 September 2024, sector holdings stood at 1,393 in Swanton, 908 in Spokane, 674 in Blaine, 645 in Houlton, 462 in Havre, 349 in Grand Forks, 300 in Buffalo and 261 in Detroit. The sensors detect, track and differentiate humans, animals and vehicles using seismic, magnetic and passive infrared capabilities, and approximately 60% include imaging that transmits photographs or video feeds.
    Source
  • 12 February 2026 Market data
    The same GAO report identified a monitoring capacity gap alongside the sensor expansion. Law Enforcement Information Systems Specialists, who monitor surveillance feeds, were staffed at 77% – 88 of 115 authorised positions – with sector rates ranging from 57% in Swanton to 92% in Spokane. GAO found Border Patrol had no plan to address the gap and recommended one be developed; DHS concurred. Camera availability fell from 90% to 76% in Detroit and 98% to 86% in Swanton between fiscal 2021 and 2024.
    Source
  • 29 January 2026 Market data
    L3Harris Technologies reported 2025 revenue of USD 21.9 billion, up 3% and 5% organically, with orders of USD 27.5 billion at a 1.3x book-to-bill ratio. Communication Systems generated USD 5.7 billion at a 25.2% margin, Space and Airborne Systems USD 6.9 billion, Integrated Mission Systems USD 6.6 billion and Aerojet Rocketdyne USD 2.8 billion. The company guided 2026 revenue to USD 23.0–23.5 billion. Ground sensors sit within portfolios of this scale, which shapes the development attention the category receives at prime contractors.
    Source

REPORT SCOPE & SEGMENTATION

Attribute Details
Study Period 2021–2034
Base Year 2025
Estimated Year 2026
Forecast Period 2026–2034
Historical Period 2021–2025
Market Size 2025 USD 2,087 Million
Market Size 2034 USD 3,057 Million
Growth Rate CAGR of 4.3% from 2026–2034
Unit Value (USD Million) and Volume (Thousand Units)
Segmentation By Type, By Application, By Technology, By Component, By End User, and By Region
By Type Seismic UGS · Acoustic UGS · Magnetic UGS · Infrared UGS · Others
By Application Military Use · Civil Use · Critical Infrastructure Protection
By Technology Wired Systems · Wireless Systems · Hybrid Systems
By Component Hardware · Software · Services
By End User Defense Agencies · Homeland Security · Commercial Enterprises
By Region Each region analysed by Type, Application and Country
North AmericaU.S., Canada, Mexico
Asia-PacificChina, India, South Korea, Japan, Australia, Southeast Asia
EuropeGermany, Poland, Baltic States, U.K., France, Nordic Countries, Rest of Europe
Middle East & AfricaSaudi Arabia, GCC, Israel, Türkiye, South Africa, Rest of MEA
South AmericaBrazil, Colombia, Chile, Peru, Argentina, Rest of South America
Key Companies Profiled Harris (L3Harris Technologies), Northrop Grumman Corporation, Applied Research Associates (ARA), Textron Systems, L-3 Communications, Thales Group, Cobham (Micromill), Ferranti Technologies, McQ Inc., Quantum Technology Sciences, Exensor Technology, PrustHolding B.V., Qual-Tron Inc., Seraphim Optronics
Customization Scope Free report customization (equivalent to up to 4 analyst working days) with purchase. Addition or alteration to country, regional and segment scope.

Frequently Asked Questions

What is the current size of the unattended ground sensor market?

Unattended ground sensor market  is projected to reach USD 3,057 million by 2034, expanding at a CAGR of 4.3% across the 2026–2034 forecast period. The base year is 2025, the historical period runs from 2021, and values are reported in US dollars with volumes in thousand units. Growth is moderate because sensors compete for defence budget against far more expensive platform priorities.

What is an unattended ground sensor?

An unattended ground sensor is a self-contained detection device emplaced on or below the ground to monitor an area without an operator present. It detects the seismic, acoustic, magnetic or thermal signature of people, vehicles and animals, classifies what it has detected, and reports to a remote monitoring position. The defining constraint is energy: it must run for months or years on a battery that cannot be replaced without exposing its location.

Which region leads the unattended ground sensor market?

North America holds approximately 40% of the market in 2025, the largest regional share, driven by the world’s largest persistent border monitoring deployment and a deep domestic supplier base. Asia-Pacific is the fastest-growing region, supported by military expenditure of USD 681 billion in 2025, up 8.1%, and by extensive contested land borders across terrain where fixed towers and patrols are impractical.

What are the main types of unattended ground sensor?

Seismic sensors hold the largest share at approximately 35%, detecting ground vibration from footsteps and vehicles. Infrared sensors detect thermal contrast and are among the fastest-growing, magnetic sensors identify ferrous mass, and acoustic sensors classify sound signatures at longer range. Other categories include chemical and radiological detection nodes and distributed fibre-optic acoustic sensing.

Why is multi-modal sensing replacing single-sensor devices?

A single sensing mode produces detections; combining modes produces classifications. Seismic detection establishes that something passed, passive infrared confirms it was warm-bodied, and a magnetometer indicates whether it carried ferrous mass. US Border Patrol’s northern border sensors are built this way, and approximately 60% now add imaging that transmits photographs or video – reducing false alarms that would otherwise consume operational response.

What are the main applications for unattended ground sensors?

Military use accounts for more than 60% of the market, covering perimeter defence, route monitoring, early warning screens and reconnaissance. Critical infrastructure protection is the fastest-growing application, spanning pipelines, transmission corridors, ports and remote industrial sites. Civil and border security use is the volume driver, with border deployments running into thousands of sensors per sector.

Who are the key companies in the unattended ground sensor market?

The market divides between defence primes – L3Harris, Northrop Grumman, Thales Group and Textron Systems – that carry ground sensors within much broader portfolios, and dedicated specialists including McQ, Exensor Technology, Applied Research Associates, Quantum Technology Sciences, Qual-Tron and Seraphim Optronics for whom the category is a primary business. Cobham, Ferranti Technologies and PrustHolding supply subsystems and regional integration.

What are the key growth drivers for the unattended ground sensor market?

The principal drivers are elevated global defence expenditure, which SIPRI recorded at USD 2,887 billion in 2025 and 2.5% of world GDP; persistent border monitoring programmes deploying at network scale; critical infrastructure protection becoming a funded national security mission after documented sabotage incidents; and multi-modal fusion with on-device classification raising value per unit.

Why is the market growing at only mid-single digits despite record defence spending?

Because ground sensors compete for budget against far more expensive priorities. The current rearmament cycle is dominated by air defence, long-range fires, ammunition and counter-drone capability, all priced in millions per unit. A category priced in thousands does not scale its revenue with budget increases driven by those systems. A second constraint is analyst capacity: GAO found US Border Patrol monitoring specialists staffed at just 77%.

What is the outlook for the unattended ground sensor market through 2034?

The market is projected to grow from USD 2,087 million in 2025 to USD 3,057 million by 2034 at a 4.3% CAGR. Growth will concentrate in classification and triage software that addresses the analyst shortage limiting deployed capability, in critical infrastructure protection as a commercial buyer set, and in sustainment revenue from networks already in the field, while North America retains the largest regional share.

Unattended Ground Sensor Market, Global Business Strategies 2026-2034

Get Sample Report PDF for Exclusive Insights

Report Sample Includes

  • Table of Contents
  • List of Tables & Figures
  • Charts, Research Methodology, and more...

PDF Icon Download Sample Report PDF

Download Sample Report

Table of Content

1 Introduction to Research & Analysis Reports
1.1 Unattended Ground Sensor Market Definition
1.2 Market Segments
1.2.1 Segment by Type
1.2.2 Segment by Application
1.3 Global Unattended Ground Sensor Market Overview
1.4 Features & Benefits of This Report
1.5 Methodology & Sources of Information
1.5.1 Research Methodology
1.5.2 Research Process
1.5.3 Base Year
1.5.4 Report Assumptions & Caveats
2 Global Unattended Ground Sensor Overall Market Size
2.1 Global Unattended Ground Sensor Market Size: 2024 VS 2032
2.2 Global Unattended Ground Sensor Market Size, Prospects & Forecasts: 2020-2032
2.3 Global Unattended Ground Sensor Sales: 2020-2032
3 Company Landscape
3.1 Top Unattended Ground Sensor Players in Global Market
3.2 Top Global Unattended Ground Sensor Companies Ranked by Revenue
3.3 Global Unattended Ground Sensor Revenue by Companies
3.4 Global Unattended Ground Sensor Sales by Companies
3.5 Global Unattended Ground Sensor Price by Manufacturer (2020-2025)
3.6 Top 3 and Top 5 Unattended Ground Sensor Companies in Global Market, by Revenue in 2024
3.7 Global Manufacturers Unattended Ground Sensor Product Type
3.8 Tier 1, Tier 2, and Tier 3 Unattended Ground Sensor Players in Global Market
3.8.1 List of Global Tier 1 Unattended Ground Sensor Companies
3.8.2 List of Global Tier 2 and Tier 3 Unattended Ground Sensor Companies
4 Sights by Product
4.1 Overview
4.1.1 Segment by Type – Global Unattended Ground Sensor Market Size Markets, 2024 & 2032
4.1.2 Seismic UGS
4.1.3 Acoustic UGS
4.1.4 Magnetic UGS
4.1.5 Infrared UGS
4.1.6 Others
4.2 Segment by Type – Global Unattended Ground Sensor Revenue & Forecasts
4.2.1 Segment by Type – Global Unattended Ground Sensor Revenue, 2020-2025
4.2.2 Segment by Type – Global Unattended Ground Sensor Revenue, 2026-2032
4.2.3 Segment by Type – Global Unattended Ground Sensor Revenue Market Share, 2020-2032
4.3 Segment by Type – Global Unattended Ground Sensor Sales & Forecasts
4.3.1 Segment by Type – Global Unattended Ground Sensor Sales, 2020-2025
4.3.2 Segment by Type – Global Unattended Ground Sensor Sales, 2026-2032
4.3.3 Segment by Type – Global Unattended Ground Sensor Sales Market Share, 2020-2032
4.4 Segment by Type – Global Unattended Ground Sensor Price (Manufacturers Selling Prices), 2020-2032
5 Sights by Application
5.1 Overview
5.1.1 Segment by Application – Global Unattended Ground Sensor Market Size, 2024 & 2032
5.1.2 Military Use
5.1.3 Civil Use
5.2 Segment by Application – Global Unattended Ground Sensor Revenue & Forecasts
5.2.1 Segment by Application – Global Unattended Ground Sensor Revenue, 2020-2025
5.2.2 Segment by Application – Global Unattended Ground Sensor Revenue, 2026-2032
5.2.3 Segment by Application – Global Unattended Ground Sensor Revenue Market Share, 2020-2032
5.3 Segment by Application – Global Unattended Ground Sensor Sales & Forecasts
5.3.1 Segment by Application – Global Unattended Ground Sensor Sales, 2020-2025
5.3.2 Segment by Application – Global Unattended Ground Sensor Sales, 2026-2032
5.3.3 Segment by Application – Global Unattended Ground Sensor Sales Market Share, 2020-2032
5.4 Segment by Application – Global Unattended Ground Sensor Price (Manufacturers Selling Prices), 2020-2032
6 Sights by Region
6.1 By Region – Global Unattended Ground Sensor Market Size, 2024 & 2032
6.2 By Region – Global Unattended Ground Sensor Revenue & Forecasts
6.2.1 By Region – Global Unattended Ground Sensor Revenue, 2020-2025
6.2.2 By Region – Global Unattended Ground Sensor Revenue, 2026-2032
6.2.3 By Region – Global Unattended Ground Sensor Revenue Market Share, 2020-2032
6.3 By Region – Global Unattended Ground Sensor Sales & Forecasts
6.3.1 By Region – Global Unattended Ground Sensor Sales, 2020-2025
6.3.2 By Region – Global Unattended Ground Sensor Sales, 2026-2032
6.3.3 By Region – Global Unattended Ground Sensor Sales Market Share, 2020-2032
6.4 North America
6.4.1 By Country – North America Unattended Ground Sensor Revenue, 2020-2032
6.4.2 By Country – North America Unattended Ground Sensor Sales, 2020-2032
6.4.3 United States Unattended Ground Sensor Market Size, 2020-2032
6.4.4 Canada Unattended Ground Sensor Market Size, 2020-2032
6.4.5 Mexico Unattended Ground Sensor Market Size, 2020-2032
6.5 Europe
6.5.1 By Country – Europe Unattended Ground Sensor Revenue, 2020-2032
6.5.2 By Country – Europe Unattended Ground Sensor Sales, 2020-2032
6.5.3 Germany Unattended Ground Sensor Market Size, 2020-2032
6.5.4 France Unattended Ground Sensor Market Size, 2020-2032
6.5.5 U.K. Unattended Ground Sensor Market Size, 2020-2032
6.5.6 Italy Unattended Ground Sensor Market Size, 2020-2032
6.5.7 Russia Unattended Ground Sensor Market Size, 2020-2032
6.5.8 Nordic Countries Unattended Ground Sensor Market Size, 2020-2032
6.5.9 Benelux Unattended Ground Sensor Market Size, 2020-2032
6.6 Asia
6.6.1 By Region – Asia Unattended Ground Sensor Revenue, 2020-2032
6.6.2 By Region – Asia Unattended Ground Sensor Sales, 2020-2032
6.6.3 China Unattended Ground Sensor Market Size, 2020-2032
6.6.4 Japan Unattended Ground Sensor Market Size, 2020-2032
6.6.5 South Korea Unattended Ground Sensor Market Size, 2020-2032
6.6.6 Southeast Asia Unattended Ground Sensor Market Size, 2020-2032
6.6.7 India Unattended Ground Sensor Market Size, 2020-2032
6.7 South America
6.7.1 By Country – South America Unattended Ground Sensor Revenue, 2020-2032
6.7.2 By Country – South America Unattended Ground Sensor Sales, 2020-2032
6.7.3 Brazil Unattended Ground Sensor Market Size, 2020-2032
6.7.4 Argentina Unattended Ground Sensor Market Size, 2020-2032
6.8 Middle East & Africa
6.8.1 By Country – Middle East & Africa Unattended Ground Sensor Revenue, 2020-2032
6.8.2 By Country – Middle East & Africa Unattended Ground Sensor Sales, 2020-2032
6.8.3 Turkey Unattended Ground Sensor Market Size, 2020-2032
6.8.4 Israel Unattended Ground Sensor Market Size, 2020-2032
6.8.5 Saudi Arabia Unattended Ground Sensor Market Size, 2020-2032
6.8.6 UAE Unattended Ground Sensor Market Size, 2020-2032
7 Manufacturers & Brands Profiles
7.1 Harris
7.1.1 Harris Company Summary
7.1.2 Harris Business Overview
7.1.3 Harris Unattended Ground Sensor Major Product Offerings
7.1.4 Harris Unattended Ground Sensor Sales and Revenue in Global (2020-2025)
7.1.5 Harris Key News & Latest Developments
7.2 Northrop Grumman
7.2.1 Northrop Grumman Company Summary
7.2.2 Northrop Grumman Business Overview
7.2.3 Northrop Grumman Unattended Ground Sensor Major Product Offerings
7.2.4 Northrop Grumman Unattended Ground Sensor Sales and Revenue in Global (2020-2025)
7.2.5 Northrop Grumman Key News & Latest Developments
7.3 ARA
7.3.1 ARA Company Summary
7.3.2 ARA Business Overview
7.3.3 ARA Unattended Ground Sensor Major Product Offerings
7.3.4 ARA Unattended Ground Sensor Sales and Revenue in Global (2020-2025)
7.3.5 ARA Key News & Latest Developments
7.4 Textron Systems
7.4.1 Textron Systems Company Summary
7.4.2 Textron Systems Business Overview
7.4.3 Textron Systems Unattended Ground Sensor Major Product Offerings
7.4.4 Textron Systems Unattended Ground Sensor Sales and Revenue in Global (2020-2025)
7.4.5 Textron Systems Key News & Latest Developments
7.5 L-3
7.5.1 L-3 Company Summary
7.5.2 L-3 Business Overview
7.5.3 L-3 Unattended Ground Sensor Major Product Offerings
7.5.4 L-3 Unattended Ground Sensor Sales and Revenue in Global (2020-2025)
7.5.5 L-3 Key News & Latest Developments
7.6 Thales
7.6.1 Thales Company Summary
7.6.2 Thales Business Overview
7.6.3 Thales Unattended Ground Sensor Major Product Offerings
7.6.4 Thales Unattended Ground Sensor Sales and Revenue in Global (2020-2025)
7.6.5 Thales Key News & Latest Developments
7.7 Cobham (Micromill)
7.7.1 Cobham (Micromill) Company Summary
7.7.2 Cobham (Micromill) Business Overview
7.7.3 Cobham (Micromill) Unattended Ground Sensor Major Product Offerings
7.7.4 Cobham (Micromill) Unattended Ground Sensor Sales and Revenue in Global (2020-2025)
7.7.5 Cobham (Micromill) Key News & Latest Developments
7.8 Ferranti
7.8.1 Ferranti Company Summary
7.8.2 Ferranti Business Overview
7.8.3 Ferranti Unattended Ground Sensor Major Product Offerings
7.8.4 Ferranti Unattended Ground Sensor Sales and Revenue in Global (2020-2025)
7.8.5 Ferranti Key News & Latest Developments
7.9 McQ
7.9.1 McQ Company Summary
7.9.2 McQ Business Overview
7.9.3 McQ Unattended Ground Sensor Major Product Offerings
7.9.4 McQ Unattended Ground Sensor Sales and Revenue in Global (2020-2025)
7.9.5 McQ Key News & Latest Developments
7.10 Quantum
7.10.1 Quantum Company Summary
7.10.2 Quantum Business Overview
7.10.3 Quantum Unattended Ground Sensor Major Product Offerings
7.10.4 Quantum Unattended Ground Sensor Sales and Revenue in Global (2020-2025)
7.10.5 Quantum Key News & Latest Developments
7.11 Exensor Technology
7.11.1 Exensor Technology Company Summary
7.11.2 Exensor Technology Business Overview
7.11.3 Exensor Technology Unattended Ground Sensor Major Product Offerings
7.11.4 Exensor Technology Unattended Ground Sensor Sales and Revenue in Global (2020-2025)
7.11.5 Exensor Technology Key News & Latest Developments
7.12 PrustHolding
7.12.1 PrustHolding Company Summary
7.12.2 PrustHolding Business Overview
7.12.3 PrustHolding Unattended Ground Sensor Major Product Offerings
7.12.4 PrustHolding Unattended Ground Sensor Sales and Revenue in Global (2020-2025)
7.12.5 PrustHolding Key News & Latest Developments
7.13 Qual-Tron
7.13.1 Qual-Tron Company Summary
7.13.2 Qual-Tron Business Overview
7.13.3 Qual-Tron Unattended Ground Sensor Major Product Offerings
7.13.4 Qual-Tron Unattended Ground Sensor Sales and Revenue in Global (2020-2025)
7.13.5 Qual-Tron Key News & Latest Developments
7.14 Seraphim Optronics
7.14.1 Seraphim Optronics Company Summary
7.14.2 Seraphim Optronics Business Overview
7.14.3 Seraphim Optronics Unattended Ground Sensor Major Product Offerings
7.14.4 Seraphim Optronics Unattended Ground Sensor Sales and Revenue in Global (2020-2025)
7.14.5 Seraphim Optronics Key News & Latest Developments
8 Global Unattended Ground Sensor Production Capacity, Analysis
8.1 Global Unattended Ground Sensor Production Capacity, 2020-2032
8.2 Unattended Ground Sensor Production Capacity of Key Manufacturers in Global Market
8.3 Global Unattended Ground Sensor Production by Region
9 Key Market Trends, Opportunity, Drivers and Restraints
9.1 Market Opportunities & Trends
9.2 Market Drivers
9.3 Market Restraints
10 Unattended Ground Sensor Supply Chain Analysis
10.1 Unattended Ground Sensor Industry Value Chain
10.2 Unattended Ground Sensor Upstream Market
10.3 Unattended Ground Sensor Downstream and Clients
10.4 Marketing Channels Analysis
10.4.1 Marketing Channels
10.4.2 Unattended Ground Sensor Distributors and Sales Agents in Global
11 Conclusion
12 Appendix
12.1 Note
12.2 Examples of Clients
12.3 DisclaimerList of Tables
Table 1. Key Players of Unattended Ground Sensor in Global Market
Table 2. Top Unattended Ground Sensor Players in Global Market, Ranking by Revenue (2024)
Table 3. Global Unattended Ground Sensor Revenue by Companies, (US$, Mn), 2020-2025
Table 4. Global Unattended Ground Sensor Revenue Share by Companies, 2020-2025
Table 5. Global Unattended Ground Sensor Sales by Companies, (K Units), 2020-2025
Table 6. Global Unattended Ground Sensor Sales Share by Companies, 2020-2025
Table 7. Key Manufacturers Unattended Ground Sensor Price (2020-2025) & (USD/Unit)
Table 8. Global Manufacturers Unattended Ground Sensor Product Type
Table 9. List of Global Tier 1 Unattended Ground Sensor Companies, Revenue (US$, Mn) in 2024 and Market Share
Table 10. List of Global Tier 2 and Tier 3 Unattended Ground Sensor Companies, Revenue (US$, Mn) in 2024 and Market Share
Table 11. Segment by Type – Global Unattended Ground Sensor Revenue, (US$, Mn), 2024 & 2032
Table 12. Segment by Type – Global Unattended Ground Sensor Revenue (US$, Mn), 2020-2025
Table 13. Segment by Type – Global Unattended Ground Sensor Revenue (US$, Mn), 2026-2032
Table 14. Segment by Type – Global Unattended Ground Sensor Sales (K Units), 2020-2025
Table 15. Segment by Type – Global Unattended Ground Sensor Sales (K Units), 2026-2032
Table 16. Segment by Application – Global Unattended Ground Sensor Revenue, (US$, Mn), 2024 & 2032
Table 17. Segment by Application – Global Unattended Ground Sensor Revenue, (US$, Mn), 2020-2025
Table 18. Segment by Application – Global Unattended Ground Sensor Revenue, (US$, Mn), 2026-2032
Table 19. Segment by Application – Global Unattended Ground Sensor Sales, (K Units), 2020-2025
Table 20. Segment by Application – Global Unattended Ground Sensor Sales, (K Units), 2026-2032
Table 21. By Region – Global Unattended Ground Sensor Revenue, (US$, Mn), 2025-2032
Table 22. By Region – Global Unattended Ground Sensor Revenue, (US$, Mn), 2020-2025
Table 23. By Region – Global Unattended Ground Sensor Revenue, (US$, Mn), 2026-2032
Table 24. By Region – Global Unattended Ground Sensor Sales, (K Units), 2020-2025
Table 25. By Region – Global Unattended Ground Sensor Sales, (K Units), 2026-2032
Table 26. By Country – North America Unattended Ground Sensor Revenue, (US$, Mn), 2020-2025
Table 27. By Country – North America Unattended Ground Sensor Revenue, (US$, Mn), 2026-2032
Table 28. By Country – North America Unattended Ground Sensor Sales, (K Units), 2020-2025
Table 29. By Country – North America Unattended Ground Sensor Sales, (K Units), 2026-2032
Table 30. By Country – Europe Unattended Ground Sensor Revenue, (US$, Mn), 2020-2025
Table 31. By Country – Europe Unattended Ground Sensor Revenue, (US$, Mn), 2026-2032
Table 32. By Country – Europe Unattended Ground Sensor Sales, (K Units), 2020-2025
Table 33. By Country – Europe Unattended Ground Sensor Sales, (K Units), 2026-2032
Table 34. By Region – Asia Unattended Ground Sensor Revenue, (US$, Mn), 2020-2025
Table 35. By Region – Asia Unattended Ground Sensor Revenue, (US$, Mn), 2026-2032
Table 36. By Region – Asia Unattended Ground Sensor Sales, (K Units), 2020-2025
Table 37. By Region – Asia Unattended Ground Sensor Sales, (K Units), 2026-2032
Table 38. By Country – South America Unattended Ground Sensor Revenue, (US$, Mn), 2020-2025
Table 39. By Country – South America Unattended Ground Sensor Revenue, (US$, Mn), 2026-2032
Table 40. By Country – South America Unattended Ground Sensor Sales, (K Units), 2020-2025
Table 41. By Country – South America Unattended Ground Sensor Sales, (K Units), 2026-2032
Table 42. By Country – Middle East & Africa Unattended Ground Sensor Revenue, (US$, Mn), 2020-2025
Table 43. By Country – Middle East & Africa Unattended Ground Sensor Revenue, (US$, Mn), 2026-2032
Table 44. By Country – Middle East & Africa Unattended Ground Sensor Sales, (K Units), 2020-2025
Table 45. By Country – Middle East & Africa Unattended Ground Sensor Sales, (K Units), 2026-2032
Table 46. Harris Company Summary
Table 47. Harris Unattended Ground Sensor Product Offerings
Table 48. Harris Unattended Ground Sensor Sales (K Units), Revenue (US$, Mn) and Average Price (USD/Unit) & (2020-2025)
Table 49. Harris Key News & Latest Developments
Table 50. Northrop Grumman Company Summary
Table 51. Northrop Grumman Unattended Ground Sensor Product Offerings
Table 52. Northrop Grumman Unattended Ground Sensor Sales (K Units), Revenue (US$, Mn) and Average Price (USD/Unit) & (2020-2025)
Table 53. Northrop Grumman Key News & Latest Developments
Table 54. ARA Company Summary
Table 55. ARA Unattended Ground Sensor Product Offerings
Table 56. ARA Unattended Ground Sensor Sales (K Units), Revenue (US$, Mn) and Average Price (USD/Unit) & (2020-2025)
Table 57. ARA Key News & Latest Developments
Table 58. Textron Systems Company Summary
Table 59. Textron Systems Unattended Ground Sensor Product Offerings
Table 60. Textron Systems Unattended Ground Sensor Sales (K Units), Revenue (US$, Mn) and Average Price (USD/Unit) & (2020-2025)
Table 61. Textron Systems Key News & Latest Developments
Table 62. L-3 Company Summary
Table 63. L-3 Unattended Ground Sensor Product Offerings
Table 64. L-3 Unattended Ground Sensor Sales (K Units), Revenue (US$, Mn) and Average Price (USD/Unit) & (2020-2025)
Table 65. L-3 Key News & Latest Developments
Table 66. Thales Company Summary
Table 67. Thales Unattended Ground Sensor Product Offerings
Table 68. Thales Unattended Ground Sensor Sales (K Units), Revenue (US$, Mn) and Average Price (USD/Unit) & (2020-2025)
Table 69. Thales Key News & Latest Developments
Table 70. Cobham (Micromill) Company Summary
Table 71. Cobham (Micromill) Unattended Ground Sensor Product Offerings
Table 72. Cobham (Micromill) Unattended Ground Sensor Sales (K Units), Revenue (US$, Mn) and Average Price (USD/Unit) & (2020-2025)
Table 73. Cobham (Micromill) Key News & Latest Developments
Table 74. Ferranti Company Summary
Table 75. Ferranti Unattended Ground Sensor Product Offerings
Table 76. Ferranti Unattended Ground Sensor Sales (K Units), Revenue (US$, Mn) and Average Price (USD/Unit) & (2020-2025)
Table 77. Ferranti Key News & Latest Developments
Table 78. McQ Company Summary
Table 79. McQ Unattended Ground Sensor Product Offerings
Table 80. McQ Unattended Ground Sensor Sales (K Units), Revenue (US$, Mn) and Average Price (USD/Unit) & (2020-2025)
Table 81. McQ Key News & Latest Developments
Table 82. Quantum Company Summary
Table 83. Quantum Unattended Ground Sensor Product Offerings
Table 84. Quantum Unattended Ground Sensor Sales (K Units), Revenue (US$, Mn) and Average Price (USD/Unit) & (2020-2025)
Table 85. Quantum Key News & Latest Developments
Table 86. Exensor Technology Company Summary
Table 87. Exensor Technology Unattended Ground Sensor Product Offerings
Table 88. Exensor Technology Unattended Ground Sensor Sales (K Units), Revenue (US$, Mn) and Average Price (USD/Unit) & (2020-2025)
Table 89. Exensor Technology Key News & Latest Developments
Table 90. PrustHolding Company Summary
Table 91. PrustHolding Unattended Ground Sensor Product Offerings
Table 92. PrustHolding Unattended Ground Sensor Sales (K Units), Revenue (US$, Mn) and Average Price (USD/Unit) & (2020-2025)
Table 93. PrustHolding Key News & Latest Developments
Table 94. Qual-Tron Company Summary
Table 95. Qual-Tron Unattended Ground Sensor Product Offerings
Table 96. Qual-Tron Unattended Ground Sensor Sales (K Units), Revenue (US$, Mn) and Average Price (USD/Unit) & (2020-2025)
Table 97. Qual-Tron Key News & Latest Developments
Table 98. Seraphim Optronics Company Summary
Table 99. Seraphim Optronics Unattended Ground Sensor Product Offerings
Table 100. Seraphim Optronics Unattended Ground Sensor Sales (K Units), Revenue (US$, Mn) and Average Price (USD/Unit) & (2020-2025)
Table 101. Seraphim Optronics Key News & Latest Developments
Table 102. Unattended Ground Sensor Capacity of Key Manufacturers in Global Market, 2023-2025 (K Units)
Table 103. Global Unattended Ground Sensor Capacity Market Share of Key Manufacturers, 2023-2025
Table 104. Global Unattended Ground Sensor Production by Region, 2020-2025 (K Units)
Table 105. Global Unattended Ground Sensor Production by Region, 2026-2032 (K Units)
Table 106. Unattended Ground Sensor Market Opportunities & Trends in Global Market
Table 107. Unattended Ground Sensor Market Drivers in Global Market
Table 108. Unattended Ground Sensor Market Restraints in Global Market
Table 109. Unattended Ground Sensor Raw Materials
Table 110. Unattended Ground Sensor Raw Materials Suppliers in Global Market
Table 111. Typical Unattended Ground Sensor Downstream
Table 112. Unattended Ground Sensor Downstream Clients in Global Market
Table 113. Unattended Ground Sensor Distributors and Sales Agents in Global Market

List of Figures
Figure 1. Unattended Ground Sensor Product Picture
Figure 2. Unattended Ground Sensor Segment by Type in 2024
Figure 3. Unattended Ground Sensor Segment by Application in 2024
Figure 4. Global Unattended Ground Sensor Market Overview: 2024
Figure 5. Key Caveats
Figure 6. Global Unattended Ground Sensor Market Size: 2024 VS 2032 (US$, Mn)
Figure 7. Global Unattended Ground Sensor Revenue: 2020-2032 (US$, Mn)
Figure 8. Unattended Ground Sensor Sales in Global Market: 2020-2032 (K Units)
Figure 9. The Top 3 and 5 Players Market Share by Unattended Ground Sensor Revenue in 2024
Figure 10. Segment by Type – Global Unattended Ground Sensor Revenue, (US$, Mn), 2024 & 2032
Figure 11. Segment by Type – Global Unattended Ground Sensor Revenue Market Share, 2020-2032
Figure 12. Segment by Type – Global Unattended Ground Sensor Sales Market Share, 2020-2032
Figure 13. Segment by Type – Global Unattended Ground Sensor Price (USD/Unit), 2020-2032
Figure 14. Segment by Application – Global Unattended Ground Sensor Revenue, (US$, Mn), 2024 & 2032
Figure 15. Segment by Application – Global Unattended Ground Sensor Revenue Market Share, 2020-2032
Figure 16. Segment by Application – Global Unattended Ground Sensor Sales Market Share, 2020-2032
Figure 17. Segment by Application -Global Unattended Ground Sensor Price (USD/Unit), 2020-2032
Figure 18. By Region – Global Unattended Ground Sensor Revenue, (US$, Mn), 2025 & 2032
Figure 19. By Region – Global Unattended Ground Sensor Revenue Market Share, 2020 VS 2024 VS 2032
Figure 20. By Region – Global Unattended Ground Sensor Revenue Market Share, 2020-2032
Figure 21. By Region – Global Unattended Ground Sensor Sales Market Share, 2020-2032
Figure 22. By Country – North America Unattended Ground Sensor Revenue Market Share, 2020-2032
Figure 23. By Country – North America Unattended Ground Sensor Sales Market Share, 2020-2032
Figure 24. United States Unattended Ground Sensor Revenue, (US$, Mn), 2020-2032
Figure 25. Canada Unattended Ground Sensor Revenue, (US$, Mn), 2020-2032
Figure 26. Mexico Unattended Ground Sensor Revenue, (US$, Mn), 2020-2032
Figure 27. By Country – Europe Unattended Ground Sensor Revenue Market Share, 2020-2032
Figure 28. By Country – Europe Unattended Ground Sensor Sales Market Share, 2020-2032
Figure 29. Germany Unattended Ground Sensor Revenue, (US$, Mn), 2020-2032
Figure 30. France Unattended Ground Sensor Revenue, (US$, Mn), 2020-2032
Figure 31. U.K. Unattended Ground Sensor Revenue, (US$, Mn), 2020-2032
Figure 32. Italy Unattended Ground Sensor Revenue, (US$, Mn), 2020-2032
Figure 33. Russia Unattended Ground Sensor Revenue, (US$, Mn), 2020-2032
Figure 34. Nordic Countries Unattended Ground Sensor Revenue, (US$, Mn), 2020-2032
Figure 35. Benelux Unattended Ground Sensor Revenue, (US$, Mn), 2020-2032
Figure 36. By Region – Asia Unattended Ground Sensor Revenue Market Share, 2020-2032
Figure 37. By Region – Asia Unattended Ground Sensor Sales Market Share, 2020-2032
Figure 38. China Unattended Ground Sensor Revenue, (US$, Mn), 2020-2032
Figure 39. Japan Unattended Ground Sensor Revenue, (US$, Mn), 2020-2032
Figure 40. South Korea Unattended Ground Sensor Revenue, (US$, Mn), 2020-2032
Figure 41. Southeast Asia Unattended Ground Sensor Revenue, (US$, Mn), 2020-2032
Figure 42. India Unattended Ground Sensor Revenue, (US$, Mn), 2020-2032
Figure 43. By Country – South America Unattended Ground Sensor Revenue Market Share, 2020-2032
Figure 44. By Country – South America Unattended Ground Sensor Sales, Market Share, 2020-2032
Figure 45. Brazil Unattended Ground Sensor Revenue, (US$, Mn), 2020-2032
Figure 46. Argentina Unattended Ground Sensor Revenue, (US$, Mn), 2020-2032
Figure 47. By Country – Middle East & Africa Unattended Ground Sensor Revenue, Market Share, 2020-2032
Figure 48. By Country – Middle East & Africa Unattended Ground Sensor Sales, Market Share, 2020-2032
Figure 49. Turkey Unattended Ground Sensor Revenue, (US$, Mn), 2020-2032
Figure 50. Israel Unattended Ground Sensor Revenue, (US$, Mn), 2020-2032
Figure 51. Saudi Arabia Unattended Ground Sensor Revenue, (US$, Mn), 2020-2032
Figure 52. UAE Unattended Ground Sensor Revenue, (US$, Mn), 2020-2032
Figure 53. Global Unattended Ground Sensor Production Capacity (K Units), 2020-2032
Figure 54. The Percentage of Production Unattended Ground Sensor by Region, 2024 VS 2032
Figure 55. Unattended Ground Sensor Industry Value Chain
Figure 56. Marketing Channels
