Ultrathin Photoelectric Sensor Market, Trends, Business Strategies 2026-2034

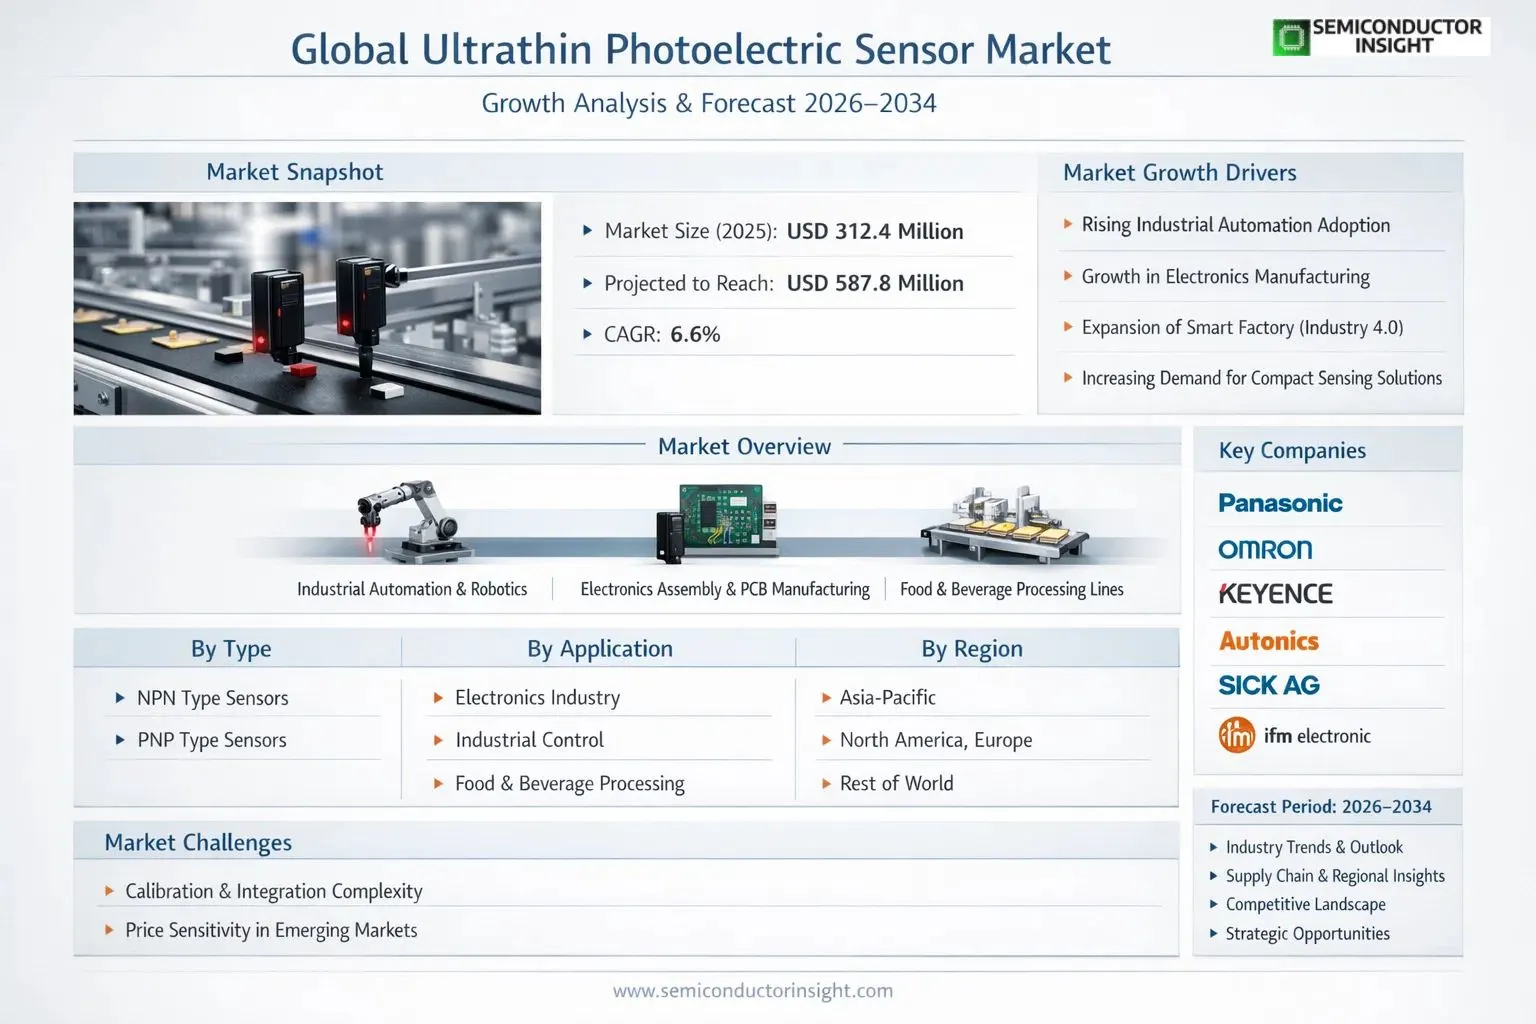
Global Ultrathin Photoelectric Sensor Market was valued at USD 312.4 million in 2025 and is expected to reach  USD 587.8 million by 2034, growing at a CAGR of 6.6%  during the forecast period 2026–2034.

PDF Icon Download Sample Report PDF
  • Quick Dispatch

    All Orders

  • Secure Payment

    100% Secure Payment

Price range: $1,500.00 through $4,250.00

Clear

Ultrathin Photoelectric Sensor Market Insights

Global Ultrathin Photoelectric Sensor market size was valued at USD 312.4 million in 2025. The market is projected to grow from USD 331.6 million in 2026 to USD 587.8 million by 2034, exhibiting a CAGR of 6.6% during the forecast period.

A photoelectric sensor is a device that detects a difference in the light level received from the light source. Ultrathin photoelectric sensors, in particular, are engineered with compact, low-profile form factors that enable precise object detection, position sensing, and presence verification across space-constrained industrial and electronic environments. These sensors operate on principles of light emission and reception , encompassing through-beam, retro-reflective, and diffuse reflection configurations , and are available in NPN Type and PNP Type output variants to suit diverse circuit requirements.

The market is gaining strong momentum driven by accelerating industrial automation, the rapid expansion of electronics manufacturing, and the growing integration of sensor technologies in food and beverage processing lines. The increasing adoption of Industry 4.0 frameworks across North America, Europe, and Asia-Pacific is further reinforcing demand for precision sensing components, including ultrathin photoelectric sensors. Panasonic, Omron, KEYENCE, Autonics, PIQS, Shenzhen Wonsor, Shenzhen Huayifeng, and Fuwei Electronic Technology are among the key global manufacturers operating in this market with diverse and competitive product portfolios.
Ultrathin Photoelectric Sensor Market, Trends, Business Strategies 2026-2034

MARKET DRIVERS

Rising Adoption of Automation Across Industrial Sectors

Ultrathin Photoelectric Sensor Market is experiencing significant momentum driven by the rapid expansion of industrial automation across manufacturing, automotive, electronics, and logistics sectors. As production facilities worldwide accelerate their transition toward smart factory environments, the demand for compact, high-precision sensing solutions has grown substantially. Ultrathin photoelectric sensors are uniquely positioned to meet these requirements, offering reliable object detection and positioning capabilities within space-constrained assembly lines and robotic systems. Their slim form factor enables integration into machinery designs where conventional sensors cannot be accommodated, making them indispensable in modern automated workflows.

Growth of Consumer Electronics and Miniaturized Device Manufacturing

The proliferation of consumer electronics manufacturing has emerged as a primary driver for the ultrathin photoelectric sensor industry. With global demand for smartphones, wearables, tablets, and portable devices continuing to rise, manufacturers require ultra-compact sensing components capable of operating within tight tolerances on high-speed production lines. Ultrathin photoelectric sensors provide precise detection of miniature components during assembly, quality inspection, and packaging stages. Their ability to deliver accurate readings at close detection ranges without generating electromagnetic interference makes them particularly well-suited for electronics fabrication environments where component density and precision are critical.

The integration of ultrathin photoelectric sensors in semiconductor and PCB manufacturing lines has become increasingly critical as component sizes continue to shrink, necessitating detection technologies that can reliably identify objects at sub-millimeter scales.

Government-backed initiatives promoting industrial digitization and smart manufacturing in regions such as Asia-Pacific, Europe, and North America have further reinforced market growth. Programs supporting Industry 4.0 adoption incentivize manufacturers to upgrade their sensing infrastructure, creating sustained procurement cycles for advanced photoelectric sensing technologies. Ultrathin Photoelectric Sensor Market continues to benefit from these structural tailwinds as end-users prioritize operational efficiency, reduced downtime, and enhanced quality control outcomes.

MARKET CHALLENGES

Technical Complexity in Calibration and Integration

Despite strong demand, Ultrathin Photoelectric Sensor Market faces considerable challenges related to the technical complexity involved in calibrating and integrating these sensors within diverse industrial environments. Ultrathin form factors introduce constraints on optical path design, signal processing circuitry, and housing durability, requiring highly specialized engineering expertise during system integration. Industries operating in environments with ambient light interference, vibration, or extreme temperatures must invest in additional shielding and calibration protocols, which increases deployment costs and extends implementation timelines. For small and medium-sized enterprises, these requirements can present meaningful barriers to adoption despite the operational benefits these sensors offer.

Other Challenges

Price Sensitivity Among Emerging Market Buyers

In cost-sensitive markets across Southeast Asia, Latin America, and parts of Eastern Europe, price remains a significant challenge for the ultrathin photoelectric sensor segment. While established manufacturers in developed economies can absorb the premium pricing associated with high-precision ultrathin sensors, buyers in emerging markets often prioritize lower-cost alternatives that may sacrifice detection accuracy or long-term reliability. This price sensitivity constrains market penetration in high-growth geographies and places downward pressure on margins for sensor manufacturers competing in these regions.

Supply Chain Vulnerabilities and Component Availability

The ultrathin photoelectric sensor supply chain remains exposed to disruptions in the availability of specialized optical components, photodiodes, and miniaturized electronic assemblies. Geopolitical tensions, logistics bottlenecks, and concentration of key component manufacturing in select geographies have highlighted systemic vulnerabilities. Manufacturers face challenges maintaining consistent production schedules and managing lead times, particularly during periods of elevated global demand or trade policy uncertainty, which can affect delivery commitments to end customers.

MARKET RESTRAINTS

Competition from Alternative Compact Sensing Technologies

One of the primary restraints facing Ultrathin Photoelectric Sensor Market is the increasing competition from alternative compact sensing technologies, including ultrasonic sensors, capacitive proximity sensors, and inductive sensors. In certain application environments, these technologies offer comparable detection performance at lower unit costs, prompting procurement teams to evaluate alternatives when ultrathin photoelectric solutions are not strictly necessary. The availability of multi-function sensor platforms that combine several sensing modalities also reduces the total number of discrete ultrathin photoelectric sensors required in some system architectures, potentially limiting volume growth within specific application segments.

Limitations Imposed by Harsh Operating Environments

Ultrathin photoelectric sensors, by virtue of their compact construction, can exhibit reduced robustness compared to standard-sized photoelectric sensing units when deployed in environments characterized by heavy particulate contamination, moisture ingress, or mechanical shock. Industries such as heavy manufacturing, mining, and certain food and beverage processing operations may find that the ingress protection ratings achievable in ultrathin sensor designs do not consistently meet the stringent durability requirements of their operating conditions. This limitation restrains market expansion into industrial verticals where environmental ruggedization is a non-negotiable procurement criterion, despite ongoing engineering advancements aimed at improving sensor resilience within slim housing designs.

MARKET OPPORTUNITIES

Expansion into Medical Device Manufacturing and Life Sciences Applications

The medical device manufacturing and life sciences sectors present compelling growth opportunities for Ultrathin Photoelectric Sensor Market. As medical equipment manufacturers seek to develop increasingly compact diagnostic devices, surgical instruments, and laboratory automation platforms, the requirement for miniaturized, highly accurate sensing components is intensifying. Ultrathin photoelectric sensors can fulfill critical roles in automated pipetting systems, diagnostic cartridge handling, and minimally invasive device assembly lines where spatial constraints are stringent and detection reliability is paramount. Regulatory emphasis on quality assurance in medical manufacturing further reinforces the value proposition of precision sensing solutions in this sector.

Integration with Smart Logistics and Warehouse Automation Systems

The accelerating build-out of automated warehousing, e-commerce fulfillment infrastructure, and smart logistics networks worldwide creates substantial opportunity for ultrathin photoelectric sensor adoption. Automated sorting conveyors, goods-to-person robotic systems, and high-density storage and retrieval installations require reliable, space-efficient object detection across large numbers of sensing points. Ultrathin photoelectric sensors offer a compelling fit for these environments, providing accurate detection of packages, trays, and components along conveyor systems with minimal physical footprint. As global investment in logistics automation continues to scale, demand for compact, high-throughput sensing components within this segment is expected to grow accordingly, supporting expanded commercial opportunities across Ultrathin Photoelectric Sensor Market.

MAIN TITLE HERE () Trends

Rising Adoption Across Industrial Automation Drives Ultrathin Photoelectric Sensor Market Expansion

Ultrathin Photoelectric Sensor Market is witnessing sustained momentum as industries across electronics manufacturing, food and beverage processing, and industrial control systems increasingly integrate compact sensing solutions into their automation frameworks. Ultrathin photoelectric sensors, designed to detect variations in received light levels from a defined source, are gaining traction due to their space-saving form factor and reliable non-contact detection capabilities. As manufacturing environments trend toward higher precision and miniaturization, demand for these sensors continues to accelerate across both developed and emerging economies. Key market participants including Panasonic, Omron, KEYENCE, Autonics, PIQS, Shenzhen Wonsor, Shenzhen Huayifeng, and Fuwei Electronic Technology are actively investing in product development to address evolving end-user requirements. North America and Asia , particularly China and Japan , represent significant adoption hubs, supported by robust industrial infrastructure and ongoing factory automation initiatives.

Other Trends

NPN Type Sensors Gaining Ground in Industrial Control Applications

Within Ultrathin Photoelectric Sensor Market, the NPN Type segment is demonstrating notable growth driven by its widespread compatibility with programmable logic controllers (PLCs) and automation systems commonly deployed across Asia-Pacific manufacturing facilities. NPN-output sensors are preferred in environments where negative-switching logic is standard, making them particularly relevant in electronics assembly lines and precision industrial control settings. The PNP Type segment, meanwhile, continues to hold relevance in European and North American markets where positive-switching configurations are more prevalent. This regional divergence in output type preference is shaping product portfolio strategies among leading manufacturers, who are expanding dual-output and configurable sensor offerings to serve a broader global customer base.

Electronics Industry and Food & Beverage Sectors Emerge as Key End-Use Drivers

Application-wise, the electronics industry remains a primary consumer within Ultrathin Photoelectric Sensor Market, leveraging the sensors’ compact profiles for precise component detection on high-density circuit board assembly lines. The food and beverage sector is also emerging as a high-potential application area, where hygienic, low-profile sensors are required for packaging line automation, fill-level detection, and label verification. The sensors’ durability and resistance to harsh environments make them well-suited for food processing conditions. Industrial control applications continue to represent a stable demand segment, particularly as smart factory initiatives drive integration of sensing technologies into connected production systems.

Asia-Pacific Competitive Landscape Intensifies as Regional Manufacturers Scale Capabilities

The competitive landscape of Ultrathin Photoelectric Sensor Market is evolving as China-based manufacturers such as Shenzhen Wonsor, Shenzhen Huayifeng, and Fuwei Electronic Technology scale their production capabilities and expand their international distribution networks. These regional players are increasingly challenging established Japanese and Korean brands on the basis of cost competitiveness and localized customer support. Meanwhile, global leaders like KEYENCE and Omron are differentiating through advanced sensing accuracy, integrated digital interfaces, and IoT-compatible sensor platforms. This competitive dynamic is encouraging innovation across the board, resulting in a broader range of ultrathin sensor products that balance performance, reliability, and affordability , ultimately benefiting end-users across all major application segments.

COMPETITIVE LANDSCAPE

Key Industry Players

Ultrathin Photoelectric Sensor Market – Competitive Dynamics, Strategic Positioning, and Leading Manufacturer Profiles

Global ultrathin photoelectric sensor market is characterized by a moderately consolidated competitive structure, with a handful of established automation and sensing technology giants commanding significant revenue shares. Panasonic and Omron lead the competitive field, leveraging decades of expertise in industrial sensing, robust global distribution networks, and continuous investment in miniaturized sensor R&D. KEYENCE has further strengthened its position through premium product differentiation, offering high-precision ultrathin photoelectric sensors tailored for electronics manufacturing and industrial control applications. These top-tier players collectively accounted for a substantial share of global market revenue in 2025, driven by strong demand across the electronics industry, food and beverage processing, and automated industrial control segments. Their competitive advantage lies in a combination of technological innovation, after-sales service ecosystems, and the ability to deliver both NPN and PNP output type configurations to meet diverse customer requirements across North America, Europe, and Asia-Pacific.

Beyond the dominant multinationals, a growing cohort of specialized and regional manufacturers is reshaping the competitive landscape of Ultrathin Photoelectric Sensor Market. Autonics, a South Korean sensor specialist, has carved a significant niche by offering competitively priced, high-reliability solutions across Southeast Asian and emerging markets. Chinese manufacturers such as Shenzhen Wonsor, Shenzhen Huayifeng, and Fuwei Electronic Technology are rapidly gaining traction, capitalizing on cost-efficient manufacturing capabilities and expanding domestic demand fueled by China’s industrial automation boom. PIQS has also emerged as a noteworthy player, focusing on compact sensing innovations suited for space-constrained assembly environments. The competitive intensity within this market is expected to escalate over the forecast period as players prioritize product miniaturization, enhanced sensing distances, and integration with Industry 4.0-compatible smart factory ecosystems, creating both opportunities and challenges for incumbents and new entrants alike.

List of Key Ultrathin Photoelectric Sensor Companies Profiled

Segment Analysis:

Segment Category Sub-Segments Key Insights
By Type
  • NPN Type
  • PNP Type
NPN Type holds a commanding position in Ultrathin Photoelectric Sensor Market, driven by its widespread compatibility with programmable logic controllers (PLCs) and industrial automation systems.

  • NPN Type sensors are predominantly preferred in Asian manufacturing environments, particularly in electronics and semiconductor production facilities, where open-collector output configurations align with existing control architectures.
  • The inherent design flexibility of NPN Type sensors makes them well-suited for integration into compact and space-constrained machinery, enabling seamless adoption in ultrathin form factor applications.
  • PNP Type sensors, while serving a strong niche in European and North American industrial settings, continue to gain traction in food processing and packaging lines where sourcing output logic is operationally advantageous and system safety requirements are stringent.
By Application
  • Electronics Industry
  • Industrial Control
  • Food and Beverage
  • Others
Electronics Industry emerges as the leading application segment for ultrathin photoelectric sensors, fueled by the rapid miniaturization of electronic components and the escalating demand for precision detection in circuit board assembly and semiconductor manufacturing.

  • The proliferation of consumer electronics, smartphones, and wearable devices has created sustained demand for sensors capable of detecting ultra-small components with high accuracy, making ultrathin photoelectric sensors an indispensable tool in automated electronics assembly lines.
  • Industrial Control applications represent a robust and growing segment, as manufacturers across diverse verticals increasingly adopt automated inspection and object detection systems to enhance production throughput and minimize human error in complex manufacturing workflows.
  • The Food and Beverage segment presents growing adoption opportunities, particularly in packaging lines and quality inspection systems where hygienic, compact sensor designs are essential to meet stringent food safety regulations without compromising operational efficiency.
By End User
  • Manufacturing & Industrial Facilities
  • Food Processing Plants
  • Electronics & Semiconductor Firms
Manufacturing & Industrial Facilities constitute the dominant end-user category for ultrathin photoelectric sensors, reflecting the broad-scale deployment of automation technologies across production floors globally.

  • Large-scale industrial manufacturers require high-volume, reliable sensing solutions that can withstand demanding operational environments, making the durability and precision of ultrathin photoelectric sensors a critical procurement consideration.
  • Electronics and Semiconductor Firms represent a highly specialized and strategically important end-user group, where the ultrathin form factor is not merely a preference but a technical necessity dictated by the microscale nature of component handling and detection tasks.
  • Food Processing Plants are increasingly investing in sensor technologies that comply with international hygiene and safety standards, driving adoption of ultrathin photoelectric sensors that offer easy-clean designs and reliable performance in moisture-prone environments.
By Detection Method
  • Through-Beam
  • Retro-Reflective
  • Diffuse Reflective
Diffuse Reflective sensors lead this segment owing to their single-unit installation convenience and cost-effective deployment in environments where mounting space is at a premium.

  • The diffuse reflective detection method is particularly valued in electronics assembly and packaging applications, where the target objects are positioned on conveyor systems and direct alignment of emitter and receiver units is not always feasible within ultrathin sensor housings.
  • Through-Beam detection maintains a strong presence in high-precision industrial control environments, where maximum sensing range and immunity to surface reflectivity variations are critical for reliable object detection and process integrity.
  • Retro-Reflective sensors are gaining momentum in logistics and material handling applications, offering an effective balance between installation simplicity and long-range detection capability suited to fast-moving automated production lines.
By Output Configuration
  • Digital Output
  • Analog Output
  • IO-Link Enabled
Digital Output configuration dominates Ultrathin Photoelectric Sensor Market, attributed to its straightforward integration with conventional automation control systems and its ability to deliver clear, binary presence or absence detection signals essential for high-speed production environments.

  • Digital output sensors are widely adopted across electronics manufacturing and industrial control applications due to their compatibility with a broad range of PLCs and microcontroller platforms, significantly reducing system integration complexity and associated engineering costs.
  • IO-Link Enabled sensors represent an emerging and rapidly evolving sub-segment, reflecting the broader industry transition toward smart factory architectures and Industry 4.0 frameworks, where remote diagnostics, parameter configuration, and real-time data communication are increasingly valued by end users.
  • Analog Output configurations find specialized utility in applications requiring continuous distance or intensity measurement rather than simple switching, including quality control systems in semiconductor fabrication and precision component inspection in electronics assembly operations.

Regional Analysis: Ultrathin Photoelectric Sensor Market

Asia-Pacific

Asia-Pacific stands as the dominant force in Global ultrathin photoelectric sensor market, driven by an extraordinary concentration of electronics manufacturing, automotive production, and industrial automation activity across the region. Countries such as China, Japan, South Korea, and Taiwan have cultivated deeply integrated supply chains that position the region as both a primary producer and consumer of advanced sensing technologies. The rapid expansion of smart factory initiatives across these nations has accelerated the adoption of ultrathin photoelectric sensors in precision assembly lines, semiconductor fabrication facilities, and consumer electronics production environments. Japan’s longstanding engineering excellence continues to foster innovation in miniaturized sensing components, while China’s aggressive push toward industrial digitization under its broader manufacturing modernization agenda creates sustained and growing demand. South Korea’s dominance in display and semiconductor manufacturing further reinforces the region’s appetite for ultrathin form-factor sensors capable of operating in space-constrained, high-throughput environments. Government-backed initiatives promoting automation and intelligent manufacturing across Southeast Asian economies, including Vietnam, Thailand, and Malaysia, are also expanding the regional addressable market. The convergence of cost-competitive production capabilities, a robust technology ecosystem, and rising domestic demand for automation solutions ensures that Asia-Pacific will maintain its leadership position in Ultrathin Photoelectric Sensor Market throughout the forecast period extending to 2034.
Manufacturing & Industrial Automation
Asia-Pacific’s manufacturing landscape is undergoing a profound transformation, with ultrathin photoelectric sensors becoming indispensable in automated assembly systems. The region’s electronics and automotive sectors demand highly compact sensing solutions capable of detecting minute objects in tight mechanical tolerances, fueling consistent procurement of advanced ultrathin sensor variants across major industrial hubs in China, Japan, and South Korea.
Technology Innovation & R&D Investment
The region hosts some of the world’s most active research and development ecosystems for sensor miniaturization. Japanese and South Korean firms lead in refining ultrathin photoelectric sensor precision and durability, while Chinese technology enterprises are rapidly scaling proprietary sensor development. Sustained R&D investment across the region ensures continuous product improvement aligned with evolving industrial requirements.
Smart Factory & Industry 4.0 Adoption
Governments across Asia-Pacific are actively promoting Industry 4.0 frameworks, creating favorable conditions for ultrathin photoelectric sensor deployment. Smart factory programs in China, Japan, and emerging Southeast Asian manufacturing economies are driving integration of compact, high-performance sensors into production workflows, quality control systems, and robotic automation platforms at an accelerating pace.
Supply Chain Depth & Cost Competitiveness
Asia-Pacific benefits from unparalleled supply chain depth in electronic components, enabling cost-effective production of ultrathin photoelectric sensors at scale. This structural advantage allows regional manufacturers to offer competitive pricing while maintaining technological sophistication, attracting global OEM partnerships and strengthening the region’s role as the primary sourcing hub for sensing technologies worldwide.

North America

North America represents a highly mature and technologically advanced market for ultrathin photoelectric sensors, characterized by strong demand from the aerospace, defense, semiconductor, and advanced manufacturing sectors. The United States, in particular, maintains a sophisticated industrial base where precision sensing solutions are integral to quality assurance, robotic integration, and process automation. The region’s robust investment in next-generation manufacturing technologies, including collaborative robotics and autonomous material handling systems, sustains steady demand for compact, high-performance sensing devices. Canada’s growing advanced manufacturing sector further contributes to regional market development. North American enterprises prioritize performance reliability and regulatory compliance, creating a competitive environment that rewards sensor manufacturers offering superior detection accuracy and longevity. The presence of leading automation technology providers and a well-established distribution network ensures that innovative ultrathin photoelectric sensor solutions reach end-users efficiently. Strategic partnerships between sensor manufacturers and system integrators are shaping procurement patterns across the region, supporting sustained market expansion through the forecast horizon.

Europe
Europe occupies a significant position in Global ultrathin photoelectric sensor market, underpinned by the region’s strong industrial heritage, particularly in automotive engineering, machine tool manufacturing, and precision instrumentation. Germany, as Europe’s industrial powerhouse, drives considerable demand for ultrathin photoelectric sensors through its extensive automotive production networks and mechanical engineering sector. The broader European Union’s commitment to advancing digitized and sustainable manufacturing aligns closely with the integration of compact, energy-efficient sensing solutions in modern production environments. Countries such as Italy, France, and the Netherlands contribute through their specialized manufacturing industries and growing adoption of automated quality inspection systems. European manufacturers consistently prioritize high engineering standards and product longevity, influencing sensor selection criteria across the region. Regulatory frameworks promoting operational safety and environmental sustainability further shape product development priorities for sensor suppliers serving the European market, ensuring continued relevance of advanced ultrathin photoelectric sensing solutions.

South America
South America presents an emerging opportunity within Global ultrathin photoelectric sensor market, with growth driven primarily by expanding industrial automation adoption in Brazil, Argentina, and Chile. Brazil’s diversified manufacturing base, spanning automotive assembly, food and beverage processing, and agricultural equipment production, is increasingly incorporating automated sensing technologies to enhance operational efficiency and quality control. While the region’s market development trails more established geographies, rising awareness of automation benefits and improving access to advanced industrial components are gradually accelerating adoption. Economic fluctuations and infrastructure constraints have historically moderated the pace of market expansion; however, strategic investments in modernizing manufacturing facilities and the influence of multinational corporations establishing regional operations are creating positive momentum. As industrial competitiveness pressures intensify, South American manufacturers are expected to progressively integrate ultrathin photoelectric sensor solutions into their production ecosystems over the coming years.

Middle East & Africa
The Middle East and Africa region represents an early-stage but progressively developing market for ultrathin photoelectric sensors, with growth anchored in the oil and gas, logistics, and diversifying manufacturing sectors. Gulf Cooperation Council nations, particularly the United Arab Emirates and Saudi Arabia, are advancing ambitious economic diversification agendas that include modernizing industrial infrastructure and building domestic manufacturing capabilities, creating incremental demand for sophisticated sensing technologies. South Africa serves as the primary African hub for industrial automation adoption, with its mining and automotive sectors representing notable application areas. While overall penetration of ultrathin photoelectric sensors across the broader region remains limited relative to global counterparts, ongoing investments in smart infrastructure, logistics automation, and industrial development projects are establishing a foundation for longer-term market growth as regional industries align with global automation trends through the 2026–2034 forecast period.

Report Scope

This market research report provides a comprehensive analysis of Ultrathin Photoelectric Sensor Market, covering the forecast period 2026–2034. It offers detailed insights into market dynamics, technological advancements, competitive landscape, and key trends shaping the industry.

Key focus areas of the report include:

  • Market Overview: The report begins with an overview outlining its current market scenario, key growth indicators, and industry transformation drivers. It discusses macroeconomic factors, demand–supply balance, regulatory landscape, and the strategic role of ultrathin photoelectric sensors in powering advancements across industries such as electronics, industrial control, food and beverage, and industrial automation.
  • Market Size & Forecast: Historical data and future projections for revenue, unit shipments, and market value across major regions and segments.
  • Segmentation Analysis: Detailed breakdown by product type, technology, application, and end-user industry to identify high-growth segments and investment opportunities.
  • Regional Insights: Insights into market performance across North America, Europe, Asia-Pacific, Latin America, and the Middle East & Africa, including country-level analysis where relevant.
  • Competitive Landscape: Profiles of leading market participants, including their product offerings, R&D focus, manufacturing capacity, pricing strategies, and recent developments such as mergers, acquisitions, and partnerships.
  • Technology Trends & Innovation: Assessment of emerging technologies, integration of AI/IoT, sensor design trends, fabrication techniques, and evolving industry standards.
  • Market Drivers & Restraints: Evaluation of factors driving market growth along with challenges, supply chain constraints, regulatory issues, and market-entry barriers.
  • Stakeholder Insights: Insights for component suppliers, OEMs, system integrators, investors, and policymakers regarding the evolving ecosystem and strategic opportunities.

Primary and secondary research methods are employed, including interviews with industry experts, data from verified sources, and real-time market intelligence to ensure the accuracy and reliability of the insights presented.

FREQUENTLY ASKED QUESTIONS:

What is the current market size of Ultrathin Photoelectric Sensor Market?

-> Global Ultrathin Photoelectric Sensor Market was valued at USD 312.4 million in 2025 and is expected to reach  USD 587.8 million by 2034, growing at a CAGR of 6.6%  during the forecast period 2026–2034.

Which key companies operate in Ultrathin Photoelectric Sensor Market?

-> Key players include Panasonic, Omron, KEYENCE, Autonics, PIQS, Shenzhen Wonsor, Shenzhen Huayifeng, and Fuwei Electronic Technology, among others. In 2025, Global top five players held approximately % of the market in terms of revenue.

What are the key growth drivers?

-> Key growth drivers include rising industrial automation, growing demand in the electronics industry, expansion of food and beverage processing facilities, and increasing adoption of ultrathin photoelectric sensors in industrial control systems. The widespread need for precise, compact sensing solutions across manufacturing sectors continues to fuel market expansion.

Which region dominates the market?

-> Asia-Pacific is a key growth region in Ultrathin Photoelectric Sensor Market, with China projected to reach USD million by 2034. The U.S. market is estimated at USD million in 2025, reflecting strong demand across North America as well.

What are the emerging trends?

-> Emerging trends include miniaturization of sensor designs, integration of IoT-enabled photoelectric sensors, advancement in NPN and PNP type sensor technologies, and growing deployment in electronics manufacturing and food & beverage industries. The NPN Type segment is projected to reach USD million by 2034, with a notable CAGR over the next six years.

Ultrathin Photoelectric Sensor Market, Trends, Business Strategies 2026-2034

Get Sample Report PDF for Exclusive Insights

Report Sample Includes

  • Table of Contents
  • List of Tables & Figures
  • Charts, Research Methodology, and more...

PDF Icon Download Sample Report PDF
SKU: 1fc545fe315b
Category:
License Type

Corporate License, Excel License, PDF and Excel Databook License

Download Sample Report

Table of Content

1 Introduction to Research & Analysis Reports
1.1 Ultrathin Photoelectric Sensor Market Definition
1.2 Market Segments
1.2.1 Segment by Type
1.2.2 Segment by Application
1.3 Global Ultrathin Photoelectric Sensor Market Overview
1.4 Features & Benefits of This Report
1.5 Methodology & Sources of Information
1.5.1 Research Methodology
1.5.2 Research Process
1.5.3 Base Year
1.5.4 Report Assumptions & Caveats
2 Global Ultrathin Photoelectric Sensor Overall Market Size
2.1 Global Ultrathin Photoelectric Sensor Market Size: 2025 VS 2034
2.2 Global Ultrathin Photoelectric Sensor Market Size, Prospects & Forecasts: 2021-2034
2.3 Global Ultrathin Photoelectric Sensor Sales: 2021-2034
3 Company Landscape
3.1 Top Ultrathin Photoelectric Sensor Players in Global Market
3.2 Top Global Ultrathin Photoelectric Sensor Companies Ranked by Revenue
3.3 Global Ultrathin Photoelectric Sensor Revenue by Companies
3.4 Global Ultrathin Photoelectric Sensor Sales by Companies
3.5 Global Ultrathin Photoelectric Sensor Price by Manufacturer (2021-2026)
3.6 Top 3 and Top 5 Ultrathin Photoelectric Sensor Companies in Global Market, by Revenue in 2025
3.7 Global Manufacturers Ultrathin Photoelectric Sensor Product Type
3.8 Tier 1, Tier 2, and Tier 3 Ultrathin Photoelectric Sensor Players in Global Market
3.8.1 List of Global Tier 1 Ultrathin Photoelectric Sensor Companies
3.8.2 List of Global Tier 2 and Tier 3 Ultrathin Photoelectric Sensor Companies
4 Sights by Type
4.1 Overview
4.1.1 Segment by Type – Global Ultrathin Photoelectric Sensor Market Size Markets, 2025 & 2034
4.1.2 NPN Type
4.1.3 PNP Type
4.2 Segment by Type – Global Ultrathin Photoelectric Sensor Revenue & Forecasts
4.2.1 Segment by Type – Global Ultrathin Photoelectric Sensor Revenue, 2021-2026
4.2.2 Segment by Type – Global Ultrathin Photoelectric Sensor Revenue, 2027-2034
4.2.3 Segment by Type – Global Ultrathin Photoelectric Sensor Revenue Market Share, 2021-2034
4.3 Segment by Type – Global Ultrathin Photoelectric Sensor Sales & Forecasts
4.3.1 Segment by Type – Global Ultrathin Photoelectric Sensor Sales, 2021-2026
4.3.2 Segment by Type – Global Ultrathin Photoelectric Sensor Sales, 2027-2034
4.3.3 Segment by Type – Global Ultrathin Photoelectric Sensor Sales Market Share, 2021-2034
4.4 Segment by Type – Global Ultrathin Photoelectric Sensor Price (Manufacturers Selling Prices), 2021-2034
5 Sights by Application
5.1 Overview
5.1.1 Segment by Application – Global Ultrathin Photoelectric Sensor Market Size, 2025 & 2034
5.1.2 Electronics Industry
5.1.3 Industrial Control
5.1.4 Food and Beverage
5.1.5 Other
5.2 Segment by Application – Global Ultrathin Photoelectric Sensor Revenue & Forecasts
5.2.1 Segment by Application – Global Ultrathin Photoelectric Sensor Revenue, 2021-2026
5.2.2 Segment by Application – Global Ultrathin Photoelectric Sensor Revenue, 2027-2034
5.2.3 Segment by Application – Global Ultrathin Photoelectric Sensor Revenue Market Share, 2021-2034
5.3 Segment by Application – Global Ultrathin Photoelectric Sensor Sales & Forecasts
5.3.1 Segment by Application – Global Ultrathin Photoelectric Sensor Sales, 2021-2026
5.3.2 Segment by Application – Global Ultrathin Photoelectric Sensor Sales, 2027-2034
5.3.3 Segment by Application – Global Ultrathin Photoelectric Sensor Sales Market Share, 2021-2034
5.4 Segment by Application – Global Ultrathin Photoelectric Sensor Price (Manufacturers Selling Prices), 2021-2034
6 Sights Region
6.1 By Region – Global Ultrathin Photoelectric Sensor Market Size, 2025 & 2034
6.2 By Region – Global Ultrathin Photoelectric Sensor Revenue & Forecasts
6.2.1 By Region – Global Ultrathin Photoelectric Sensor Revenue, 2021-2026
6.2.2 By Region – Global Ultrathin Photoelectric Sensor Revenue, 2027-2034
6.2.3 By Region – Global Ultrathin Photoelectric Sensor Revenue Market Share, 2021-2034
6.3 By Region – Global Ultrathin Photoelectric Sensor Sales & Forecasts
6.3.1 By Region – Global Ultrathin Photoelectric Sensor Sales, 2021-2026
6.3.2 By Region – Global Ultrathin Photoelectric Sensor Sales, 2027-2034
6.3.3 By Region – Global Ultrathin Photoelectric Sensor Sales Market Share, 2021-2034
6.4 North America
6.4.1 By Country – North America Ultrathin Photoelectric Sensor Revenue, 2021-2034
6.4.2 By Country – North America Ultrathin Photoelectric Sensor Sales, 2021-2034
6.4.3 United States Ultrathin Photoelectric Sensor Market Size, 2021-2034
6.4.4 Canada Ultrathin Photoelectric Sensor Market Size, 2021-2034
6.4.5 Mexico Ultrathin Photoelectric Sensor Market Size, 2021-2034
6.5 Europe
6.5.1 By Country – Europe Ultrathin Photoelectric Sensor Revenue, 2021-2034
6.5.2 By Country – Europe Ultrathin Photoelectric Sensor Sales, 2021-2034
6.5.3 Germany Ultrathin Photoelectric Sensor Market Size, 2021-2034
6.5.4 France Ultrathin Photoelectric Sensor Market Size, 2021-2034
6.5.5 U.K. Ultrathin Photoelectric Sensor Market Size, 2021-2034
6.5.6 Italy Ultrathin Photoelectric Sensor Market Size, 2021-2034
6.5.7 Russia Ultrathin Photoelectric Sensor Market Size, 2021-2034
6.5.8 Nordic Countries Ultrathin Photoelectric Sensor Market Size, 2021-2034
6.5.9 Benelux Ultrathin Photoelectric Sensor Market Size, 2021-2034
6.6 Asia
6.6.1 By Region – Asia Ultrathin Photoelectric Sensor Revenue, 2021-2034
6.6.2 By Region – Asia Ultrathin Photoelectric Sensor Sales, 2021-2034
6.6.3 China Ultrathin Photoelectric Sensor Market Size, 2021-2034
6.6.4 Japan Ultrathin Photoelectric Sensor Market Size, 2021-2034
6.6.5 South Korea Ultrathin Photoelectric Sensor Market Size, 2021-2034
6.6.6 Southeast Asia Ultrathin Photoelectric Sensor Market Size, 2021-2034
6.6.7 India Ultrathin Photoelectric Sensor Market Size, 2021-2034
6.7 South America
6.7.1 By Country – South America Ultrathin Photoelectric Sensor Revenue, 2021-2034
6.7.2 By Country – South America Ultrathin Photoelectric Sensor Sales, 2021-2034
6.7.3 Brazil Ultrathin Photoelectric Sensor Market Size, 2021-2034
6.7.4 Argentina Ultrathin Photoelectric Sensor Market Size, 2021-2034
6.8 Middle East & Africa
6.8.1 By Country – Middle East & Africa Ultrathin Photoelectric Sensor Revenue, 2021-2034
6.8.2 By Country – Middle East & Africa Ultrathin Photoelectric Sensor Sales, 2021-2034
6.8.3 Turkey Ultrathin Photoelectric Sensor Market Size, 2021-2034
6.8.4 Israel Ultrathin Photoelectric Sensor Market Size, 2021-2034
6.8.5 Saudi Arabia Ultrathin Photoelectric Sensor Market Size, 2021-2034
6.8.6 UAE Ultrathin Photoelectric Sensor Market Size, 2021-2034
7 Manufacturers & Brands Profiles
7.1 Panasonic
7.1.1 Panasonic Company Summary
7.1.2 Panasonic Business Overview
7.1.3 Panasonic Ultrathin Photoelectric Sensor Major Product Offerings
7.1.4 Panasonic Ultrathin Photoelectric Sensor Sales and Revenue in Global (2021-2026)
7.1.5 Panasonic Key News & Latest Developments
7.2 Omron
7.2.1 Omron Company Summary
7.2.2 Omron Business Overview
7.2.3 Omron Ultrathin Photoelectric Sensor Major Product Offerings
7.2.4 Omron Ultrathin Photoelectric Sensor Sales and Revenue in Global (2021-2026)
7.2.5 Omron Key News & Latest Developments
7.3 KEYENCE
7.3.1 KEYENCE Company Summary
7.3.2 KEYENCE Business Overview
7.3.3 KEYENCE Ultrathin Photoelectric Sensor Major Product Offerings
7.3.4 KEYENCE Ultrathin Photoelectric Sensor Sales and Revenue in Global (2021-2026)
7.3.5 KEYENCE Key News & Latest Developments
7.4 Autonics
7.4.1 Autonics Company Summary
7.4.2 Autonics Business Overview
7.4.3 Autonics Ultrathin Photoelectric Sensor Major Product Offerings
7.4.4 Autonics Ultrathin Photoelectric Sensor Sales and Revenue in Global (2021-2026)
7.4.5 Autonics Key News & Latest Developments
7.5 PIQS
7.5.1 PIQS Company Summary
7.5.2 PIQS Business Overview
7.5.3 PIQS Ultrathin Photoelectric Sensor Major Product Offerings
7.5.4 PIQS Ultrathin Photoelectric Sensor Sales and Revenue in Global (2021-2026)
7.5.5 PIQS Key News & Latest Developments
7.6 Shenzhen Wonsor
7.6.1 Shenzhen Wonsor Company Summary
7.6.2 Shenzhen Wonsor Business Overview
7.6.3 Shenzhen Wonsor Ultrathin Photoelectric Sensor Major Product Offerings
7.6.4 Shenzhen Wonsor Ultrathin Photoelectric Sensor Sales and Revenue in Global (2021-2026)
7.6.5 Shenzhen Wonsor Key News & Latest Developments
7.7 Shenzhen Huayifeng
7.7.1 Shenzhen Huayifeng Company Summary
7.7.2 Shenzhen Huayifeng Business Overview
7.7.3 Shenzhen Huayifeng Ultrathin Photoelectric Sensor Major Product Offerings
7.7.4 Shenzhen Huayifeng Ultrathin Photoelectric Sensor Sales and Revenue in Global (2021-2026)
7.7.5 Shenzhen Huayifeng Key News & Latest Developments
7.8 Fuwei Electronic Technology
7.8.1 Fuwei Electronic Technology Company Summary
7.8.2 Fuwei Electronic Technology Business Overview
7.8.3 Fuwei Electronic Technology Ultrathin Photoelectric Sensor Major Product Offerings
7.8.4 Fuwei Electronic Technology Ultrathin Photoelectric Sensor Sales and Revenue in Global (2021-2026)
7.8.5 Fuwei Electronic Technology Key News & Latest Developments
8 Global Ultrathin Photoelectric Sensor Production Capacity, Analysis
8.1 Global Ultrathin Photoelectric Sensor Production Capacity, 2021-2034
8.2 Ultrathin Photoelectric Sensor Production Capacity of Key Manufacturers in Global Market
8.3 Global Ultrathin Photoelectric Sensor Production by Region
9 Key Market Trends, Opportunity, Drivers and Restraints
9.1 Market Opportunities & Trends
9.2 Market Drivers
9.3 Market Restraints
10 Ultrathin Photoelectric Sensor Supply Chain Analysis
10.1 Ultrathin Photoelectric Sensor Industry Value Chain
10.2 Ultrathin Photoelectric Sensor Upstream Market
10.3 Ultrathin Photoelectric Sensor Downstream and Clients
10.4 Marketing Channels Analysis
10.4.1 Marketing Channels
10.4.2 Ultrathin Photoelectric Sensor Distributors and Sales Agents in Global
11 Conclusion
12 Appendix
12.1 Note
12.2 Examples of Clients
12.3 DisclaimerList of Tables
Table 1. Key Players of Ultrathin Photoelectric Sensor in Global Market
Table 2. Top Ultrathin Photoelectric Sensor Players in Global Market, Ranking by Revenue (2025)
Table 3. Global Ultrathin Photoelectric Sensor Revenue by Companies, (US$, Mn), 2021-2026
Table 4. Global Ultrathin Photoelectric Sensor Revenue Share by Companies, 2021-2026
Table 5. Global Ultrathin Photoelectric Sensor Sales by Companies, (K Units), 2021-2026
Table 6. Global Ultrathin Photoelectric Sensor Sales Share by Companies, 2021-2026
Table 7. Key Manufacturers Ultrathin Photoelectric Sensor Price (2021-2026) & (US$/Unit)
Table 8. Global Manufacturers Ultrathin Photoelectric Sensor Product Type
Table 9. List of Global Tier 1 Ultrathin Photoelectric Sensor Companies, Revenue (US$, Mn) in 2025 and Market Share
Table 10. List of Global Tier 2 and Tier 3 Ultrathin Photoelectric Sensor Companies, Revenue (US$, Mn) in 2025 and Market Share
Table 11. Segment by Type – Global Ultrathin Photoelectric Sensor Revenue, (US$, Mn), 2025 & 2034
Table 12. Segment by Type – Global Ultrathin Photoelectric Sensor Revenue (US$, Mn), 2021-2026
Table 13. Segment by Type – Global Ultrathin Photoelectric Sensor Revenue (US$, Mn), 2027-2034
Table 14. Segment by Type – Global Ultrathin Photoelectric Sensor Sales (K Units), 2021-2026
Table 15. Segment by Type – Global Ultrathin Photoelectric Sensor Sales (K Units), 2027-2034
Table 16. Segment by Application – Global Ultrathin Photoelectric Sensor Revenue, (US$, Mn), 2025 & 2034
Table 17. Segment by Application – Global Ultrathin Photoelectric Sensor Revenue, (US$, Mn), 2021-2026
Table 18. Segment by Application – Global Ultrathin Photoelectric Sensor Revenue, (US$, Mn), 2027-2034
Table 19. Segment by Application – Global Ultrathin Photoelectric Sensor Sales, (K Units), 2021-2026
Table 20. Segment by Application – Global Ultrathin Photoelectric Sensor Sales, (K Units), 2027-2034
Table 21. By Region – Global Ultrathin Photoelectric Sensor Revenue, (US$, Mn), 2025 & 2034
Table 22. By Region – Global Ultrathin Photoelectric Sensor Revenue, (US$, Mn), 2021-2026
Table 23. By Region – Global Ultrathin Photoelectric Sensor Revenue, (US$, Mn), 2027-2034
Table 24. By Region – Global Ultrathin Photoelectric Sensor Sales, (K Units), 2021-2026
Table 25. By Region – Global Ultrathin Photoelectric Sensor Sales, (K Units), 2027-2034
Table 26. By Country – North America Ultrathin Photoelectric Sensor Revenue, (US$, Mn), 2021-2026
Table 27. By Country – North America Ultrathin Photoelectric Sensor Revenue, (US$, Mn), 2027-2034
Table 28. By Country – North America Ultrathin Photoelectric Sensor Sales, (K Units), 2021-2026
Table 29. By Country – North America Ultrathin Photoelectric Sensor Sales, (K Units), 2027-2034
Table 30. By Country – Europe Ultrathin Photoelectric Sensor Revenue, (US$, Mn), 2021-2026
Table 31. By Country – Europe Ultrathin Photoelectric Sensor Revenue, (US$, Mn), 2027-2034
Table 32. By Country – Europe Ultrathin Photoelectric Sensor Sales, (K Units), 2021-2026
Table 33. By Country – Europe Ultrathin Photoelectric Sensor Sales, (K Units), 2027-2034
Table 34. By Region – Asia Ultrathin Photoelectric Sensor Revenue, (US$, Mn), 2021-2026
Table 35. By Region – Asia Ultrathin Photoelectric Sensor Revenue, (US$, Mn), 2027-2034
Table 36. By Region – Asia Ultrathin Photoelectric Sensor Sales, (K Units), 2021-2026
Table 37. By Region – Asia Ultrathin Photoelectric Sensor Sales, (K Units), 2027-2034
Table 38. By Country – South America Ultrathin Photoelectric Sensor Revenue, (US$, Mn), 2021-2026
Table 39. By Country – South America Ultrathin Photoelectric Sensor Revenue, (US$, Mn), 2027-2034
Table 40. By Country – South America Ultrathin Photoelectric Sensor Sales, (K Units), 2021-2026
Table 41. By Country – South America Ultrathin Photoelectric Sensor Sales, (K Units), 2027-2034
Table 42. By Country – Middle East & Africa Ultrathin Photoelectric Sensor Revenue, (US$, Mn), 2021-2026
Table 43. By Country – Middle East & Africa Ultrathin Photoelectric Sensor Revenue, (US$, Mn), 2027-2034
Table 44. By Country – Middle East & Africa Ultrathin Photoelectric Sensor Sales, (K Units), 2021-2026
Table 45. By Country – Middle East & Africa Ultrathin Photoelectric Sensor Sales, (K Units), 2027-2034
Table 46. Panasonic Company Summary
Table 47. Panasonic Ultrathin Photoelectric Sensor Product Offerings
Table 48. Panasonic Ultrathin Photoelectric Sensor Sales (K Units), Revenue (US$, Mn) and Average Price (US$/Unit) & (2021-2026)
Table 49. Panasonic Key News & Latest Developments
Table 50. Omron Company Summary
Table 51. Omron Ultrathin Photoelectric Sensor Product Offerings
Table 52. Omron Ultrathin Photoelectric Sensor Sales (K Units), Revenue (US$, Mn) and Average Price (US$/Unit) & (2021-2026)
Table 53. Omron Key News & Latest Developments
Table 54. KEYENCE Company Summary
Table 55. KEYENCE Ultrathin Photoelectric Sensor Product Offerings
Table 56. KEYENCE Ultrathin Photoelectric Sensor Sales (K Units), Revenue (US$, Mn) and Average Price (US$/Unit) & (2021-2026)
Table 57. KEYENCE Key News & Latest Developments
Table 58. Autonics Company Summary
Table 59. Autonics Ultrathin Photoelectric Sensor Product Offerings
Table 60. Autonics Ultrathin Photoelectric Sensor Sales (K Units), Revenue (US$, Mn) and Average Price (US$/Unit) & (2021-2026)
Table 61. Autonics Key News & Latest Developments
Table 62. PIQS Company Summary
Table 63. PIQS Ultrathin Photoelectric Sensor Product Offerings
Table 64. PIQS Ultrathin Photoelectric Sensor Sales (K Units), Revenue (US$, Mn) and Average Price (US$/Unit) & (2021-2026)
Table 65. PIQS Key News & Latest Developments
Table 66. Shenzhen Wonsor Company Summary
Table 67. Shenzhen Wonsor Ultrathin Photoelectric Sensor Product Offerings
Table 68. Shenzhen Wonsor Ultrathin Photoelectric Sensor Sales (K Units), Revenue (US$, Mn) and Average Price (US$/Unit) & (2021-2026)
Table 69. Shenzhen Wonsor Key News & Latest Developments
Table 70. Shenzhen Huayifeng Company Summary
Table 71. Shenzhen Huayifeng Ultrathin Photoelectric Sensor Product Offerings
Table 72. Shenzhen Huayifeng Ultrathin Photoelectric Sensor Sales (K Units), Revenue (US$, Mn) and Average Price (US$/Unit) & (2021-2026)
Table 73. Shenzhen Huayifeng Key News & Latest Developments
Table 74. Fuwei Electronic Technology Company Summary
Table 75. Fuwei Electronic Technology Ultrathin Photoelectric Sensor Product Offerings
Table 76. Fuwei Electronic Technology Ultrathin Photoelectric Sensor Sales (K Units), Revenue (US$, Mn) and Average Price (US$/Unit) & (2021-2026)
Table 77. Fuwei Electronic Technology Key News & Latest Developments
Table 78. Ultrathin Photoelectric Sensor Capacity of Key Manufacturers in Global Market, 2024-2026 (K Units)
Table 79. Global Ultrathin Photoelectric Sensor Capacity Market Share of Key Manufacturers, 2024-2026
Table 80. Global Ultrathin Photoelectric Sensor Production by Region, 2021-2026 (K Units)
Table 81. Global Ultrathin Photoelectric Sensor Production by Region, 2027-2034 (K Units)
Table 82. Ultrathin Photoelectric Sensor Market Opportunities & Trends in Global Market
Table 83. Ultrathin Photoelectric Sensor Market Drivers in Global Market
Table 84. Ultrathin Photoelectric Sensor Market Restraints in Global Market
Table 85. Ultrathin Photoelectric Sensor Raw Materials
Table 86. Ultrathin Photoelectric Sensor Raw Materials Suppliers in Global Market
Table 87. Typical Ultrathin Photoelectric Sensor Downstream
Table 88. Ultrathin Photoelectric Sensor Downstream Clients in Global Market
Table 89. Ultrathin Photoelectric Sensor Distributors and Sales Agents in Global Market

List of Figures
Figure 1. Ultrathin Photoelectric Sensor Product Picture
Figure 2. Ultrathin Photoelectric Sensor Segment by Type in 2025
Figure 3. Ultrathin Photoelectric Sensor Segment by Application in 2025
Figure 4. Global Ultrathin Photoelectric Sensor Market Overview: 2025
Figure 5. Key Caveats
Figure 6. Global Ultrathin Photoelectric Sensor Market Size: 2025 VS 2034 (US$, Mn)
Figure 7. Global Ultrathin Photoelectric Sensor Revenue: 2021-2034 (US$, Mn)
Figure 8. Ultrathin Photoelectric Sensor Sales in Global Market: 2021-2034 (K Units)
Figure 9. The Top 3 and 5 Players Market Share by Ultrathin Photoelectric Sensor Revenue in 2025
Figure 10. Segment by Type – Global Ultrathin Photoelectric Sensor Revenue, (US$, Mn), 2025 & 2034
Figure 11. Segment by Type – Global Ultrathin Photoelectric Sensor Revenue Market Share, 2021-2034
Figure 12. Segment by Type – Global Ultrathin Photoelectric Sensor Sales Market Share, 2021-2034
Figure 13. Segment by Type – Global Ultrathin Photoelectric Sensor Price (US$/Unit), 2021-2034
Figure 14. Segment by Application – Global Ultrathin Photoelectric Sensor Revenue, (US$, Mn), 2025 & 2034
Figure 15. Segment by Application – Global Ultrathin Photoelectric Sensor Revenue Market Share, 2021-2034
Figure 16. Segment by Application – Global Ultrathin Photoelectric Sensor Sales Market Share, 2021-2034
Figure 17. Segment by Application -Global Ultrathin Photoelectric Sensor Price (US$/Unit), 2021-2034
Figure 18. By Region – Global Ultrathin Photoelectric Sensor Revenue, (US$, Mn), 2025 & 2034
Figure 19. By Region – Global Ultrathin Photoelectric Sensor Revenue Market Share, 2021 VS 2025 VS 2034
Figure 20. By Region – Global Ultrathin Photoelectric Sensor Revenue Market Share, 2021-2034
Figure 21. By Region – Global Ultrathin Photoelectric Sensor Sales Market Share, 2021-2034
Figure 22. By Country – North America Ultrathin Photoelectric Sensor Revenue Market Share, 2021-2034
Figure 23. By Country – North America Ultrathin Photoelectric Sensor Sales Market Share, 2021-2034
Figure 24. United States Ultrathin Photoelectric Sensor Revenue, (US$, Mn), 2021-2034
Figure 25. Canada Ultrathin Photoelectric Sensor Revenue, (US$, Mn), 2021-2034
Figure 26. Mexico Ultrathin Photoelectric Sensor Revenue, (US$, Mn), 2021-2034
Figure 27. By Country – Europe Ultrathin Photoelectric Sensor Revenue Market Share, 2021-2034
Figure 28. By Country – Europe Ultrathin Photoelectric Sensor Sales Market Share, 2021-2034
Figure 29. Germany Ultrathin Photoelectric Sensor Revenue, (US$, Mn), 2021-2034
Figure 30. France Ultrathin Photoelectric Sensor Revenue, (US$, Mn), 2021-2034
Figure 31. U.K. Ultrathin Photoelectric Sensor Revenue, (US$, Mn), 2021-2034
Figure 32. Italy Ultrathin Photoelectric Sensor Revenue, (US$, Mn), 2021-2034
Figure 33. Russia Ultrathin Photoelectric Sensor Revenue, (US$, Mn), 2021-2034
Figure 34. Nordic Countries Ultrathin Photoelectric Sensor Revenue, (US$, Mn), 2021-2034
Figure 35. Benelux Ultrathin Photoelectric Sensor Revenue, (US$, Mn), 2021-2034
Figure 36. By Region – Asia Ultrathin Photoelectric Sensor Revenue Market Share, 2021-2034
Figure 37. By Region – Asia Ultrathin Photoelectric Sensor Sales Market Share, 2021-2034
Figure 38. China Ultrathin Photoelectric Sensor Revenue, (US$, Mn), 2021-2034
Figure 39. Japan Ultrathin Photoelectric Sensor Revenue, (US$, Mn), 2021-2034
Figure 40. South Korea Ultrathin Photoelectric Sensor Revenue, (US$, Mn), 2021-2034
Figure 41. Southeast Asia Ultrathin Photoelectric Sensor Revenue, (US$, Mn), 2021-2034
Figure 42. India Ultrathin Photoelectric Sensor Revenue, (US$, Mn), 2021-2034
Figure 43. By Country – South America Ultrathin Photoelectric Sensor Revenue Market Share, 2021-2034
Figure 44. By Country – South America Ultrathin Photoelectric Sensor Sales, Market Share, 2021-2034
Figure 45. Brazil Ultrathin Photoelectric Sensor Revenue, (US$, Mn), 2021-2034
Figure 46. Argentina Ultrathin Photoelectric Sensor Revenue, (US$, Mn), 2021-2034
Figure 47. By Country – Middle East & Africa Ultrathin Photoelectric Sensor Revenue, Market Share, 2021-2034
Figure 48. By Country – Middle East & Africa Ultrathin Photoelectric Sensor Sales, Market Share, 2021-2034
Figure 49. Turkey Ultrathin Photoelectric Sensor Revenue, (US$, Mn), 2021-2034
Figure 50. Israel Ultrathin Photoelectric Sensor Revenue, (US$, Mn), 2021-2034
Figure 51. Saudi Arabia Ultrathin Photoelectric Sensor Revenue, (US$, Mn), 2021-2034
Figure 52. UAE Ultrathin Photoelectric Sensor Revenue, (US$, Mn), 2021-2034
Figure 53. Global Ultrathin Photoelectric Sensor Production Capacity (K Units), 2021-2034
Figure 54. The Percentage of Production Ultrathin Photoelectric Sensor by Region, 2025 VS 2034
Figure 55. Ultrathin Photoelectric Sensor Industry Value Chain
Figure 56. Marketing Channels