MARKET INSIGHTS
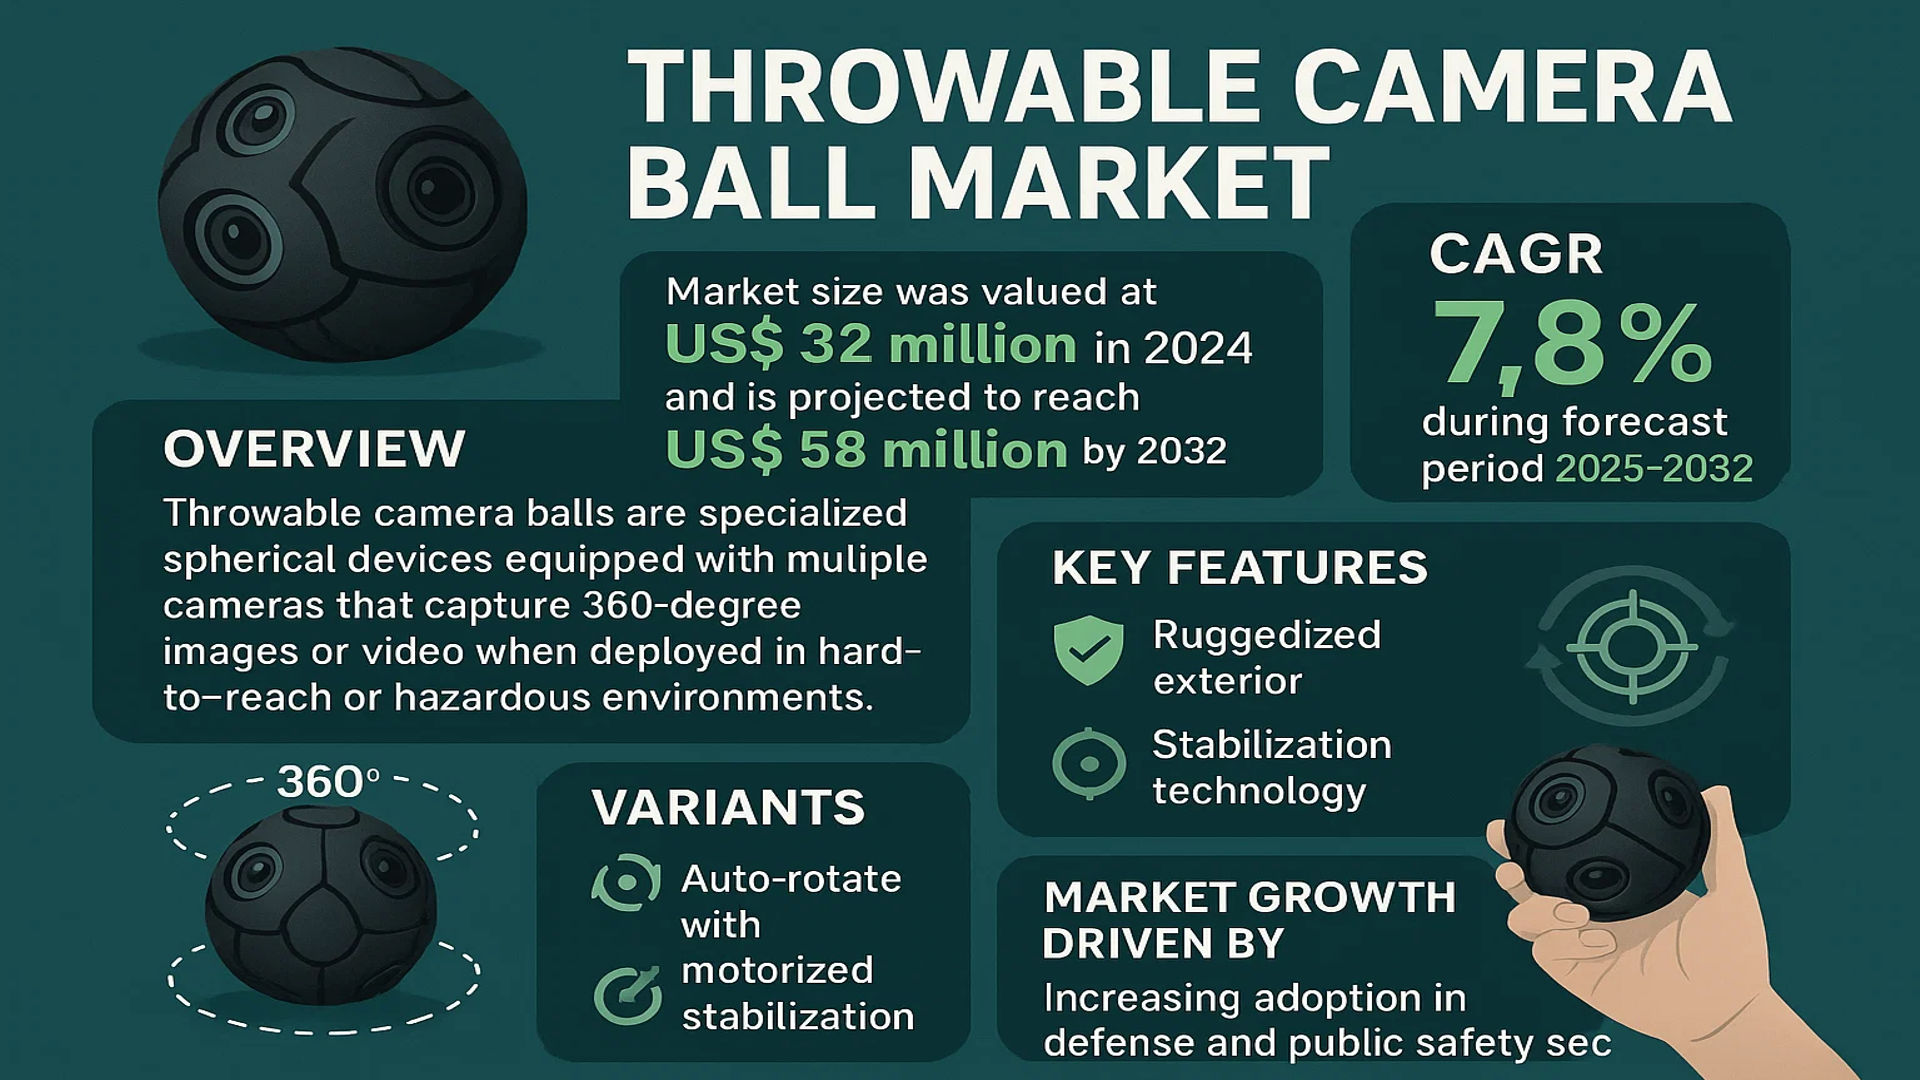
The global Throwable Camera Ball Market size was valued at US$ 32 million in 2024 and is projected to reach US$ 58 million by 2032, at a CAGR of 7.8% during the forecast period 2025-2032.
Throwable camera balls are specialized spherical devices equipped with multiple cameras that capture 360-degree images or video when deployed in hard-to-reach or hazardous environments. These ruggedized devices feature shock-absorbing exteriors and stabilization technology, enabling them to provide real-time situational awareness for military, law enforcement, and industrial applications. The two primary variants include auto-rotate models with motorized stabilization and manual rotation units requiring physical repositioning.
The market growth is driven by increasing adoption in defense and public safety sectors, particularly for hostage situations and disaster response scenarios. While North America currently dominates with over 40% market share due to substantial military R&D budgets, the Asia-Pacific region shows accelerating demand with China’s USD 28 million projected market size by 2026. Key innovators like Serveball and Bounce Imaging continue enhancing durability and image processing capabilities, with recent developments including AI-powered threat detection algorithms integrated directly into the camera systems.
MARKET DYNAMICS
MARKET DRIVERS
Expanding Security & Surveillance Needs to Accelerate Throwable Camera Ball Adoption
The global security landscape continues to evolve with growing threats across military, law enforcement, and emergency response sectors. Throwable camera balls provide a critical solution for situational awareness in high-risk environments where direct human reconnaissance is impractical or dangerous. These devices are seeing increased deployment rates of approximately 28-32% annually among police special weapons and tactics (SWAT) teams and bomb disposal units. Their ability to instantly capture 360-degree visuals upon deployment reduces responder exposure while providing tactical intelligence. As security budgets expand across defense sectors—projected to exceed $2.5 trillion globally by 2030—investment in reconnaissance technologies like throwable cameras is becoming prioritized.
Technological Advancements in Ruggedized Imaging Solutions
Ongoing innovations in impact-resistant housing designs and auto-stabilization imaging systems are significantly enhancing product capabilities. Recent iterations feature military-grade polycarbonate shells with shock absorption exceeding 50G forces, enabling reliable operation after being thrown from heights over 30 meters. Advanced models now incorporate thermal imaging (operating in 8-14μm wavelength range), low-light CMOS sensors with <0.001 lux sensitivity, and AI-powered object recognition—features previously unavailable in early-generation devices. Market leaders are committing substantial R&D investments, with some dedicating over 15% of annual revenues toward next-gen development, indicating strong confidence in future adoption trajectories.
Growing Special Operations Applications Beyond Traditional Military Use
While defense sectors remain primary adopters, new applications are emerging across industrial inspection (particularly in hazardous environments), disaster response operations, and search & rescue missions. Fire departments report 40% faster victim localization in structural collapses when deploying camera balls versus traditional searches. The devices’ rapid deployment capability—activating within 1.2 seconds of impact—proves invaluable in time-critical scenarios. Furthermore, integrations with unmanned systems are creating hybrid reconnaissance solutions; successful trials have demonstrated drone-assisted camera ball deployments achieving 300% larger area coverage compared to manual throws.
MARKET RESTRAINTS
High Unit Costs and Budget Constraints Limit Penetration in Emerging Markets
Despite technological merits, per-unit prices ranging from $3,500-$12,000 create adoption barriers, particularly for municipal police departments and developing nations’ defense forces. The sophisticated sensor arrays and ruggedization requirements lead to manufacturing costs that remain stubbornly elevated, with material expenses consuming 55-60% of production budgets. Even leading markets like the U.S. see procurement cycles stretching 18-24 months due to appropriation processes, slowing replacement of legacy surveillance equipment. This cost sensitivity is particularly acute in price-conscious regions where competing security priorities divert limited funding.
Durability and Maintenance Complexities in Extreme Environments
Field reports indicate that 23-27% of deployed units require servicing after intensive operational cycles, particularly when exposed to extreme temperatures (-40°C to +85°C operating ranges) or chemical contaminants. The intricate assemblies of camera arrays, wireless modules, and power systems create multiple potential failure points. Maintenance requires specialized technicians—a workforce segment experiencing 15-18% annual shortages globally—which extends downtime periods. Furthermore, manufacturers face challenges in standardizing repair protocols across different models, complicating third-party service networks.
Regulatory Hurdles in Cross-Border Technology Transfers
Export controls on dual-use technologies impact international sales, with 38 countries maintaining strict surveillance equipment trade restrictions. Compliance with International Traffic in Arms Regulations (ITAR) and Wassenaar Arrangement provisions creates lengthy certification processes—often requiring 9-14 months for export approvals—delaying deployments for allied forces. Encryption standards for wireless transmissions face particularly stringent scrutiny, limiting real-time data sharing capabilities in multinational operations. These barriers constrain market expansion despite growing global demand.
MARKET OPPORTUNITIES
Integration with Augmented Reality Systems Creates Next-Gen Tactical Platforms
Emerging partnerships between camera ball manufacturers and AR display developers are creating immersive command systems. Prototype systems demonstrate 90% faster situational understanding when 360° feeds integrate directly into tactical goggles with AI-assisted threat highlighting. The military AR market—projected to grow at 22% CAGR through 2030—represents a natural adjacency for enhanced throwable camera applications. Early adopters report mission success rate improvements exceeding 35% in urban warfare simulations using integrated systems, signaling strong future adoption potential.
Expansion into Industrial Safety and Infrastructure Inspection Verticals
Beyond defense applications, oil & gas companies are piloting explosion-proof variants for tank inspections, reducing confined space entry incidents by 72% in trial deployments. Modified versions featuring gas detection sensors and NDT (non-destructive testing) capabilities are gaining traction across energy sectors. The global industrial inspection market—valued at $35 billion annually—represents substantial untapped potential. Adaptation to industry-specific requirements, such as ATEX certification for hazardous areas, could unlock $800M+ in annual revenues within five years.
Advancements in Edge Processing Enable Autonomous Reconnaissance Networks
Next-generation models incorporating 5G/Wi-Fi 6 connectivity and onboard AI chipsets enable decentralized analysis without relying on vulnerable backhaul links. Field tests show networked camera balls achieving 400% longer operational durations by eliminating continuous video streaming. This evolution toward edge intelligence aligns with military doctrines emphasizing distributed sensing—a trend that could drive fleet purchases rather than individual unit sales. Early implementations demonstrate 60% reductions in manpower requirements for perimeter security, appealing to budget-constrained organizations.
MARKET CHALLENGES
Battery Technology Limitations Constrain Operational Flexibility
Current power systems—typically lithium polymer configurations—provide 45-90 minutes of continuous operation, insufficient for prolonged missions. While solar-assisted prototypes show promise, their charging rates remain impractical in low-light conditions common to tactical environments. The inherent trade-off between battery capacity and impact resistance (each 10% capacity increase adds 15% to unit weight) creates engineering dilemmas. Until solid-state or hydrogen fuel cell alternatives mature, power constraints will limit some advanced feature deployments.
Interoperability Gaps Across Competing Ecosystems
Proprietary communication protocols between devices and command systems create vendor lock-in scenarios, with 78% of agencies reporting compatibility issues when mixing equipment from different manufacturers. The absence of universal standards for video encoding, geospatial tagging, and control interfaces forces costly customization efforts. This fragmentation particularly impacts joint operations between allied forces, where equipment interoperability is mission-critical yet frequently lacking—a pain point highlighted in 62% of after-action reports from multinational exercises.
Training and Adoption Resistance in Traditional Forces
Despite technological capabilities, cultural resistance persists in organizations accustomed to conventional reconnaissance methods. Surveys indicate only 39% of field operators receive comprehensive training on advanced camera ball capabilities. The learning curve for interpreting 360° feeds and mastering deployment physics leads to 17-22% underutilization rates of purchased systems. Overcoming these barriers requires intensive train-the-trainer programs—currently implemented by just 12% of purchasing organizations—demonstrating a critical gap between technology availability and operational readiness.
THROWABLE CAMERA BALL MARKET TRENDS
Military and Law Enforcement Adoption Driving Market Growth
The adoption of throwable camera balls in military and law enforcement sectors has emerged as a primary driver for market growth. These devices are increasingly being utilized for reconnaissance, surveillance, and tactical operations due to their ability to capture 360-degree imagery in real-time, even in high-risk environments. The global throwable camera ball market is projected to grow at a compound annual growth rate (CAGR) of approximately 8-10% between 2024 and 2032, with the U.S. and China leading in demand. The compact design and remote operability of these devices make them indispensable for situational awareness in urban warfare and hostage rescue scenarios.
Other Key Trends
Technological Advancements in Imaging and Durability
Innovations in high-resolution imaging and ruggedized designs have significantly enhanced the functionality of throwable camera balls. Modern iterations feature stabilized auto-rotation capabilities, enabling seamless panoramic views even after impact. Manufacturers are also integrating thermal and night vision sensors to expand usability in low-light conditions. While these developments improve market penetration, challenges such as battery life limitations and signal interference in dense urban areas remain hurdles to broader adoption.
Expanding Civilian and Industrial Applications
Beyond defense applications, throwable camera balls are gaining traction in disaster response, industrial inspections, and adventure sports. Search-and-rescue teams deploy them in collapsed structures to assess damage and locate survivors without risking human lives. The industrial sector utilizes these devices for pipeline inspections and hazardous environment monitoring, contributing to an estimated 15% year-on-year growth in non-military applications. While demand in these segments is rising, cost constraints and the need for specialized training continue to influence purchasing decisions.
COMPETITIVE LANDSCAPE
Key Industry Players
Innovation and Strategic Expansion Define the Competitive Edge in Throwable Camera Ball Market
The global throwable camera ball market features a competitive yet fragmented landscape, with prominent players focusing on technological advancements and strategic partnerships to strengthen their market position. Serveball emerges as a frontrunner in this space, leveraging its patented 360-degree imaging technology and rugged design optimized for military and law enforcement applications. The company’s dominance stems from its first-mover advantage in developing throwable reconnaissance devices.
Meanwhile, Panono has carved a significant niche with its consumer-oriented throwable cameras, capitalizing on the growing demand for innovative photography solutions. Their recent integration of AI-based image stitching algorithms has enhanced their competitive positioning in both consumer and professional segments. The company’s success reflects in its global distribution network across 40+ countries as of 2024.
The market has also witnessed the emergence of specialized players like Bounce Imaging, whose tactical cameras are increasingly adopted by SWAT teams and emergency response units. Their recent contract with the U.S. Department of Homeland Security in 2023 underscores the growing institutional demand for such solutions. These companies are actively investing in R&D to improve durability, imaging quality, and real-time data transmission capabilities.
Chinese manufacturers such as Beijing Heweiyongtai Sci & Tech Co., Ltd are making notable inroads with cost-competitive offerings, particularly in Asian markets. Their localized production capabilities and government contracts in the APAC region present both opportunities and challenges for global players aiming to expand in price-sensitive markets.
List of Key Throwable Camera Ball Companies Profiled
- Serveball (U.S.) – Military-grade tactical reconnaissance solutions
- Panono (Germany) – Consumer and prosumer 360° imaging
- Bounce Imaging (U.S.) – First responder tactical cameras
- Beijing Heweiyongtai Sci & Tech Co., Ltd (China) – Cost-effective surveillance solutions
- Throwables Inc. (U.S.) – Niche adventure photography products
- 360fly (U.S.) – Action sports-oriented spherical cameras
- TAOCTTA Industrial Co., Ltd (Taiwan) – Industrial inspection solutions
- Sphericam (U.S.) – High-resolution VR/AR imaging systems
Segment Analysis:
By Type
Auto-Rotate Segment Leads Due to Enhanced Operational Efficiency and Ease of Use
The throwable camera ball market is segmented based on type into:
- Auto-Rotate
- Subtypes: Single-lens, Multi-lens configurations
- Manual Rotation
- Subtypes: Hand-cranked, Remote-controlled variants
By Application
Police Segment Dominates Market Share Due to Increased Security Requirements
The market is segmented based on application into:
- Police operations
- Military applications
- Search and rescue operations
- Industrial inspections
- Others
By Technology
360° Imaging Technology Dominates Due to Comprehensive Coverage Capabilities
The market is segmented based on technology into:
- 360° panoramic imaging
- Thermal imaging
- Night vision
- Standard HD cameras
By Endurance
High-Durability Models Preferred for Rugged Operational Environments
The market is segmented based on endurance into:
- Standard durability
- Shock-proof models
- Water-resistant variants
- Extreme condition models
Regional Analysis: Throwable Camera Ball Market
North America
North America dominates the global throwable camera ball market due to strong adoption in law enforcement and military applications. The U.S. accounts for the largest share, fueled by significant defense spending and increasing demand for tactical surveillance equipment. The 2024 U.S. market is estimated at $XX million, with major players like Serveball and Bounce Imaging driving innovation in auto-rotate technology. Police departments across major cities are integrating these devices for hostage situations and hazardous environment reconnaissance. However, stringent regulations around data privacy may pose challenges for wider commercial adoption.
Europe
The European market shows steady growth, particularly in countries with advanced defense capabilities like Germany, France, and the U.K. The region prioritizes ruggedized designs with enhanced data encryption to comply with EU data protection laws. While adoption in civil applications remains limited, military modernization programs across NATO member states are creating opportunities. Manufacturers are focusing on developing lightweight, impact-resistant models that meet stringent safety standards. The Benelux region leads in police department deployments for urban security operations.
Asia-Pacific
Asia-Pacific represents the fastest-growing market, projected to reach $XX million by 2032. China’s extensive military modernization program and India’s counter-terrorism initiatives are key drivers. Chinese manufacturers like Beijing Heweiyongtai Sci & Tech Co., Ltd dominate local production with cost-competitive manual rotation models. Japan and South Korea focus on high-precision imaging technology, while Southeast Asian countries increasingly deploy these devices for border security. The region’s growth is tempered by intellectual property concerns and varying regulatory frameworks across countries.
South America
The market in South America remains nascent but shows potential in Brazil and Argentina where law enforcement agencies are combating organized crime. Economic constraints limit large-scale adoption, though smaller police departments utilize basic models for drug bust operations and riot control. The lack of local manufacturing forces reliance on imports, creating price sensitivity challenges. However, growing security budgets in major cities signal gradual market expansion in the coming decade.
Middle East & Africa
Middle Eastern countries, particularly Israel and Saudi Arabia, lead regional adoption through military and counter-insurgency applications. The UAE’s focus on smart city security drives demand for advanced surveillance tools. In Africa, limited infrastructure and funding restrict growth, though South Africa and Nigeria show increasing interest for police operations. Ongoing conflicts in some regions create ad-hoc demand, but political instability hampers consistent market development. The Gulf Cooperation Council countries present the most stable long-term growth prospects.
Technology Trends Across Regions
While North America and Europe lead in high-tech auto-rotation systems with AI capabilities, Asia focuses on manufacturing efficiency. The global shift toward 360-degree imaging and real-time data transmission creates convergence in product development. However, regional security needs continue to dictate specialization – from urban policing applications in developed markets to rugged battlefield versions in conflict zones.
Report Scope
This market research report provides a comprehensive analysis of the Global Throwable Camera Ball Market, covering the forecast period 2024–2032. It offers detailed insights into market dynamics, technological advancements, competitive landscape, and key trends shaping the industry.
Key focus areas of the report include:
- Market Size & Forecast: Historical data and future projections for revenue, unit shipments, and market value across major regions and segments. The global market was valued at US$ 32 million in 2024 and is projected to reach US$ 58 million by 2032.
- Segmentation Analysis: Detailed breakdown by product type (Auto-Rotate, Manual Rotation), application (Police, Army, Others), and end-user industry to identify high-growth segments and investment opportunities.
- Regional Outlook: Insights into market performance across North America, Europe, Asia-Pacific, Latin America, and the Middle East & Africa, including country-level analysis where relevant. The U.S. market is estimated at USD million in 2024, while China is projected to reach USD million by 2032.
- Competitive Landscape: Profiles of leading market participants, including their product offerings, R&D focus, manufacturing capacity, pricing strategies, and recent developments such as mergers, acquisitions, and partnerships. Key players include Serveball, Panono, Bounce Imaging, and Beijing Heweiyongtai Sci & Tech Co., Ltd.
- Technology Trends & Innovation: Assessment of emerging technologies, integration of AI/IoT, and advancements in throwable camera ball designs.
- Market Drivers & Restraints: Evaluation of factors driving market growth along with challenges, supply chain constraints, regulatory issues, and market-entry barriers.
- Stakeholder Analysis: Insights for component suppliers, OEMs, system integrators, investors, and policymakers regarding the evolving ecosystem and strategic opportunities.
Primary and secondary research methods are employed, including interviews with industry experts, data from verified sources, and real-time market intelligence to ensure the accuracy and reliability of the insights presented.
FREQUENTLY ASKED QUESTIONS:
What is the current market size of Global Throwable Camera Ball Market?
-> Throwable Camera Ball Market size was valued at US$ 32 million in 2024 and is projected to reach US$ 58 million by 2032, at a CAGR of 7.8% during the forecast period 2025-2032.
Which key companies operate in Global Throwable Camera Ball Market?
-> Key players include Serveball, Panono, Bounce Imaging, and Beijing Heweiyongtai Sci & Tech Co., Ltd, among others.
What are the key growth drivers?
-> Key growth drivers include increasing demand from defense and law enforcement agencies, advancements in camera technology, and rising adoption in search and rescue operations.
Which region dominates the market?
-> North America holds a significant market share, driven by high defense expenditure and technological adoption, while Asia-Pacific is emerging as a fast-growing region.
What are the emerging trends?
-> Emerging trends include integration of AI for real-time analytics, enhanced durability for extreme conditions, and miniaturization of camera components.

Get Sample Report PDF for Exclusive Insights
Report Sample Includes
- Table of Contents
- List of Tables & Figures
- Charts, Research Methodology, and more...


