Terminal Blocks Market, Global Business Strategies 2026-2033

Terminal Blocks Market size was valued at USD 3.74 billion in 2025. The market is projected to grow from USD 3.88 billion in 2026 to USD 4.86 billion by 2033, exhibiting a CAGR of 3.9% during the forecast period.

PDF Icon Download Sample Report PDF
  • Quick Dispatch

    All Orders

  • Secure Payment

    100% Secure Payment

Price range: $1,500.00 through $4,250.00

Clear

Market Insights

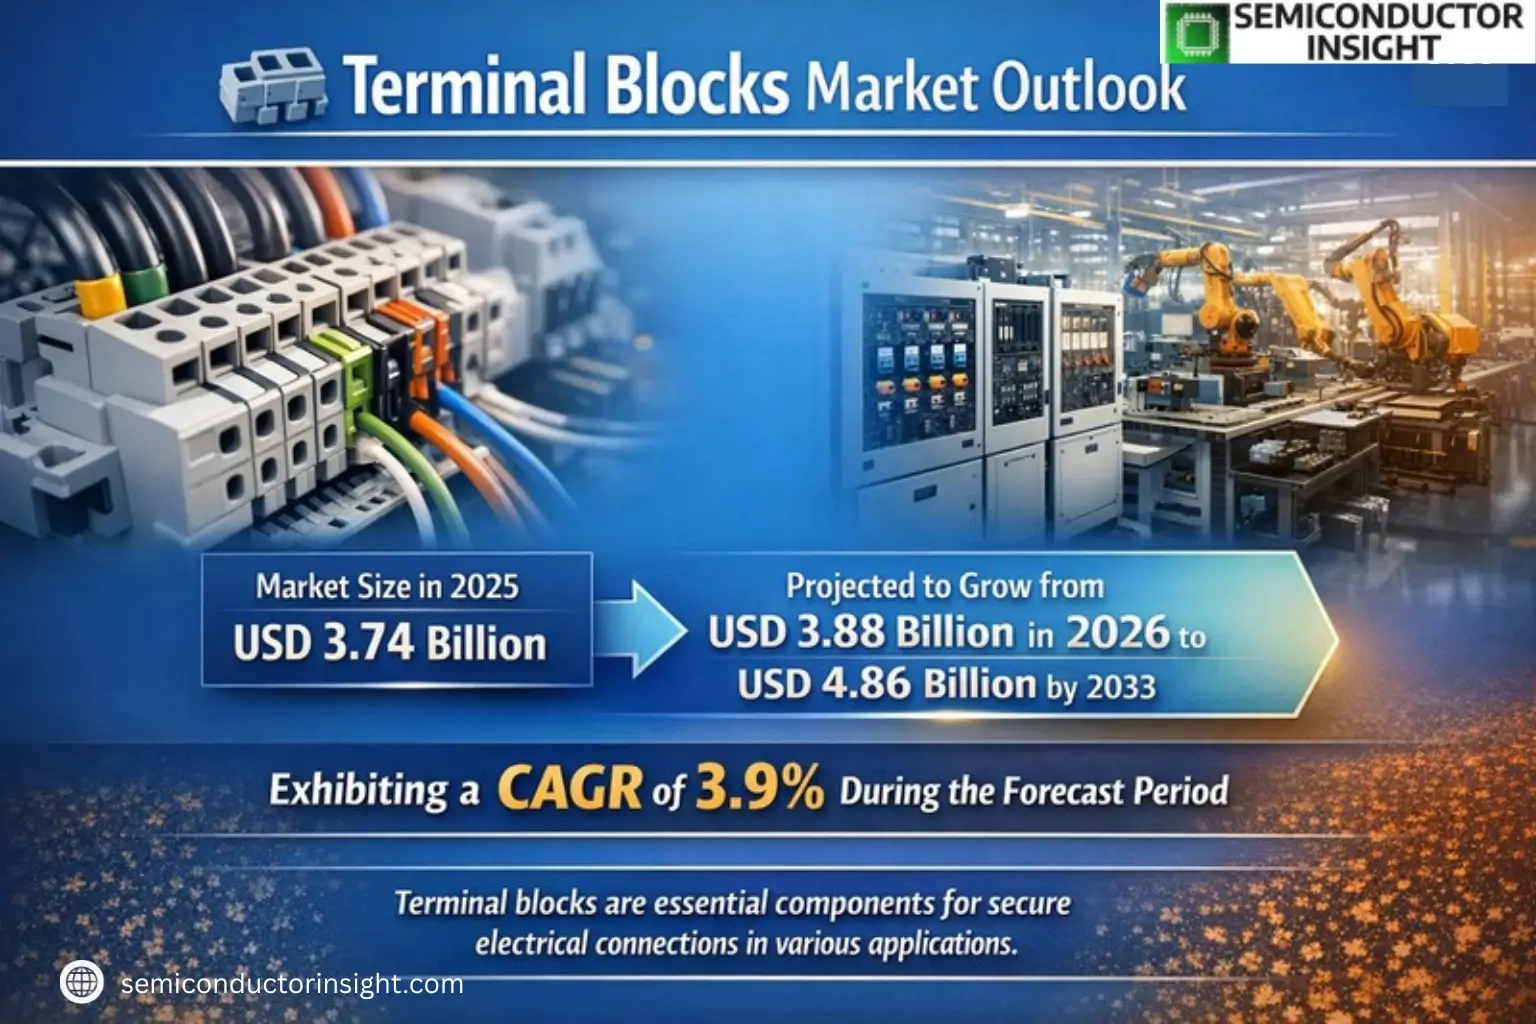
Global Terminal Blocks Market size was valued at USD 3.74 billion in 2025. The market is projected to grow from USD 3.88 billion in 2026 to USD 4.86 billion by 2033, exhibiting a CAGR of 3.9% during the forecast period.

Terminal blocks are fundamental components used to establish secure electrical connections in various applications. These modular, insulated blocks serve as fixed interfaces for connecting wires, appliances, and control boards, simplifying wiring processes while ensuring reliability and safety. They are categorized under connectors in industrial applications and come in multiple types, including screw-type, spring-cage type, push-in type, and others.

The market growth is driven by increasing industrialization, automation trends, and the rising demand for efficient power distribution systems across sectors such as electricity, mechanical equipment, and rail transport. Asia-Pacific dominates the market with a 49% share due to rapid infrastructure development and manufacturing expansion. Key players like Phoenix Contact, Weidmuller, and WAGO collectively hold approximately 39% of the global market share.

Xyz market size & forecast

MARKET DRIVERS

Growing Industrial Automation Demand

Global Terminal Blocks Market is witnessing significant growth driven by increasing adoption of industrial automation across manufacturing sectors. Automation systems require secure and reliable electrical connections, making terminal blocks a critical component in control panels and machinery. The market is projected to grow at a CAGR of 5.8% from 2023 to 2028, with Asia Pacific leading the demand.

Renewable Energy Sector Expansion

Growth in renewable energy installations is creating substantial demand for terminal blocks in solar and wind power systems. These components are essential for safe electrical connections in photovoltaic arrays and turbine control systems. The renewable sector accounted for 28% of terminal blocks sales in 2022, with projections indicating this will rise to 35% by 2026.

Advancements in terminal block technology are enabling faster installation and maintenance, particularly in time-sensitive industrial environments.

MARKET CHALLENGES

Supply Chain Vulnerabilities

Terminal Blocks Market faces persistent challenges from global supply chain disruptions affecting raw material availability, particularly copper and thermoplastic resins. Lead times for certain terminal block types extended to 16 weeks in 2022, though they have since stabilized to 8-10 weeks in most regions.

Other Challenges

Miniaturization Demands
As control panels become more compact, manufacturers must develop smaller terminal blocks without compromising current-carrying capacity or safety standards. This technical challenge has increased R&D costs by approximately 15% across the industry.

MARKET RESTRAINTS

Pricing Pressure from Alternatives

Direct wiring solutions and busbar systems continue to compete with terminal blocks in cost-sensitive applications. In commercial construction projects, terminal blocks face 10-15% price competition from alternative connection methods. However, their safety advantages maintain dominance in industrial settings.

MARKET OPPORTUNITIES

Smart Terminal Block Development

The integration of IoT capabilities into terminal blocks presents significant growth potential. Smart terminal blocks with built-in sensing and communication functions could capture 20% of the industrial market by 2026. These advanced versions enable predictive maintenance and real-time monitoring of electrical systems.
Terminal Blocks Market Trends

Sustainable Growth in Terminal Blocks Market

Global Terminal Blocks Market continues to demonstrate steady expansion, valued at USD 3.7 billion in 2025 with projections reaching USD 4.9 billion by 2033. This represents a compound annual growth rate (CAGR) of 3.9%, driven by increasing electrical infrastructure demands across industries. Terminal blocks serve as critical components for safe and efficient electrical connections in industrial, commercial and residential applications.

Other Trends

Regional Market Dynamics

Asia-Pacific dominates with 49% market share, followed by Europe (26%) and North America (17%). This distribution reflects the concentration of manufacturing activity and infrastructure development in Asian economies. Countries like China, Japan and India are driving adoption through industrial automation projects and energy sector investments.

Technological Advancements in Terminal Block Design

Innovation focuses on improving safety and ease of installation. Push-in and spring-cage connection types are gaining traction, offering faster wiring compared to traditional screw-type blocks. Leading manufacturers are integrating smart connectivity features to support Industry 4.0 applications, with terminal blocks becoming components in IoT-enabled electrical systems.

Competitive Landscape Evolution

Three companies – Phoenix Contact, Weidmuller and WAGO – collectively hold 39% market share. Competition is intensifying with Asian manufacturers increasing their global presence through cost-effective solutions. The market remains moderately consolidated, with strategic acquisitions shaping the competitive environment.

Application-Specific Growth Segments

Electricity distribution accounts for the largest application segment, followed by mechanical equipment and rail transport. Renewable energy installations and electric vehicle charging infrastructure are emerging as key growth verticals requiring specialized terminal block solutions.

COMPETITIVE LANDSCAPE

Key Industry Players

A Concentrated Market with Strong Growth Potential

Terminal Blocks Market is dominated by three major players – Phoenix Contact, Weidmüller, and WAGO – which collectively hold about 39% of the global market share. Phoenix Contact leads the industry with its comprehensive product portfolio and strong distribution network across all major regions. These top three companies have established themselves through continuous innovation in screw-type, spring-cage, and push-in terminal blocks while maintaining superior product quality and reliability standards.

Several regional players have carved out significant niches in specific markets. Chinese manufacturers like CHNT, Dinkle, and CNNT have gained strong footholds in cost-sensitive Asian markets through competitive pricing. Meanwhile, European and American firms like ABB and Rockwell Automation maintain leadership in industrial automation applications through technical differentiation. Emerging players are focusing on specialized segments such as rail transportation and renewable energy projects to challenge established brands.

List of Key Terminal Blocks Companies Profiled

Segment Analysis:

Segment Category Sub-Segments Key Insights
By Type
  • Screw Type
  • Spring-cage Type
  • Push-in Type
  • Others
Screw Type dominates due to:

  • Superior mechanical stability for high-vibration environments
  • Wider compatibility with wire gauges and materials
  • Established trust in industrial applications globally
By Application
  • Electricity
  • Mechanical Equipment
  • Rail Transmit
  • Others
Electricity Sector leads with:

  • Critical role in power distribution systems and switchgear
  • Growing infrastructure development in emerging economies
  • Continuous demand for maintenance and retrofitting
By End User
  • Industrial Manufacturing
  • Energy & Utilities
  • Transportation
  • Construction
Industrial Manufacturing shows strongest demand because:

  • Extensive use in factory automation and control panels
  • Need for durable connections in harsh industrial environments
  • Expansion of smart manufacturing facilities globally
By Material
  • Thermoplastic
  • Thermoset
  • Metal Alloys
Thermoplastic preferred due to:

  • Excellent electrical insulation properties
  • Lightweight nature reducing overall assembly weight
  • Cost-effectiveness for high-volume production
By Sales Channel
  • Direct Sales
  • Distributors
  • E-commerce
Distributors dominate because:

  • Established relationships with small and medium enterprises
  • Ability to provide technical support and inventory management
  • Regional coverage for manufacturers lacking direct presence

Regional Analysis: Terminal Blocks Market

Asia-Pacific

Asia-Pacific dominates the global Terminal Blocks Market, driven by rapid industrialization and increasing automation across manufacturing sectors. Countries like China, Japan, and South Korea are at the forefront of terminal block adoption due to expanding electronics production and energy infrastructure development. The region benefits from strong government support for smart grid projects and renewable energy installations which require extensive wiring solutions. Local manufacturers have developed cost-effective terminal block variants that cater to diverse industrial applications while maintaining international quality standards. Emerging Southeast Asian markets are showing accelerated demand as multinational corporations establish production facilities in the region. Competitive pricing strategies and reliable supply chains position Asia-Pacific as both the largest consumer and producer of terminal blocks worldwide.

China’s Manufacturing Leadership
China accounts for the largest terminal blocks consumption in Asia-Pacific, supported by its massive electronics manufacturing sector. Special economic zones concentrate terminal block usage in automation equipment production. The government’s Made in China 2026 initiative continues to drive industrial upgrades requiring advanced wiring components.
Japan’s Technological Edge
Japanese manufacturers focus on high-performance terminal blocks for precision applications in automotive and robotics industries. The country leads in innovations like spring-loaded and pluggable terminal blocks that reduce installation time. Strong emphasis on product reliability meets stringent industrial safety requirements in harsh operating environments.
India’s Emerging Demand
India’s Terminal Blocks Market grows alongside infrastructure development and renewable energy projects. Local manufacturers are expanding production capacities to meet rising demand from electricity distribution upgrades. The Make in India program encourages domestic terminal block manufacturing while still relying on imports for specialized variants.
Southeast Asia Expansion
Vietnam, Thailand, and Malaysia show increasing terminal block adoption as electronics manufacturing shifts to these markets. Industrial automation investments and new power generation facilities create sustained demand. Multinational terminal block brands are establishing regional distribution hubs to serve these growing markets efficiently.

Europe
Europe maintains a strong position in the Terminal Blocks Market with emphasis on high-quality industrial applications. Germany stands out as the regional leader, with its robust manufacturing sector requiring reliable electrical connection solutions. The region sees growing adoption of modular terminal blocks in renewable energy systems and building automation projects. Strict CE certification requirements ensure terminal blocks meet rigorous safety and environmental standards. Eastern European countries are experiencing above-average growth as industrial modernization programs upgrade outdated electrical infrastructure.

North America
The North American Terminal Blocks Market benefits from technological innovation and replacement demand across industrial facilities. The United States leads in developing smart terminal blocks with connectivity features for Industry 4.0 applications. Oil & gas operations in the Gulf region drive demand for explosion-proof terminal block solutions. Renewable energy projects and grid modernization investments create additional growth opportunities for terminal block suppliers across the region.

Middle East & Africa
Middle Eastern countries are investing heavily in infrastructure that requires terminal blocks for power distribution and control systems. Gulf Cooperation Council nations lead regional demand through massive construction projects and industrial city developments. Africa shows emerging potential with electricity access expansion programs, though the market remains fragmented. Terminal block adoption grows alongside industrialization in key African economies like South Africa and Nigeria.

South America
South America’s Terminal Blocks Market grows steadily with industrial development in Brazil, Argentina, and Chile. Mining operations and power generation projects drive demand for robust terminal block solutions. Economic volatility sometimes affects market growth, but infrastructure needs maintain baseline demand. Local manufacturers compete with imported products, particularly for standard terminal block configurations.

Report Scope

This market research report provides a comprehensive analysis of the Terminal Blocks Market , covering the forecast period 2026–2033. It offers detailed insights into market dynamics, technological advancements, competitive landscape, and key trends shaping the industry.

Key focus areas of the report include:

  • Market Overview: The report begins with an overview outlining its current market scenario, key growth indicators, and industry transformation drivers. It discusses macroeconomic factors, demand–supply balance, regulatory landscape, and the strategic role of terminal blocks in powering advancements across industries such as electricity, mechanical equipment, and rail transit.
  • Market Size & Forecast: Historical data and future projections for revenue, unit shipments, and market value across major regions and segments.
  • Segmentation Analysis: Detailed breakdown by product type, technology, application, and end-user industry to identify high-growth segments and investment opportunities.
  • Regional Insights: Insights into market performance across North America, Europe, Asia-Pacific, Latin America, and the Middle East & Africa, including country-level analysis where relevant.
  • Competitive Landscape: Profiles of leading market participants, including their product offerings, R&D focus, manufacturing capacity, pricing strategies, and recent developments such as mergers, acquisitions, and partnerships.
  • Technology Trends & Innovation: Assessment of emerging technologies, evolving industry standards, and fabrication techniques.
  • Market Drivers & Restraints: Evaluation of factors driving market growth along with challenges, supply chain constraints, regulatory issues, and market-entry barriers.
  • Stakeholder Insights: Insights for component suppliers, OEMs, system integrators, investors, and policymakers regarding the evolving ecosystem and strategic opportunities.

Primary and secondary research methods are employed, including interviews with industry experts, data from verified sources, and real-time market intelligence to ensure the accuracy and reliability of the insights presented.

FREQUENTLY ASKED QUESTIONS:

What is the current market size of Terminal Blocks Market?

-> Terminal Blocks Market size was valued at USD 3.74 billion in 2025. The market is projected to grow from USD 3.88 billion in 2026 to USD 4.86 billion by 2033, exhibiting a CAGR of 3.9% during the forecast period.

Which key companies operate in Terminal Blocks Market?

-> Key players include Phoenix Contact, Weidmuller, WAGO, ABB, Rockwell Automation, and Amphenol (FCI), among others.

What are the key growth drivers?

-> Key growth drivers include rising demand for electrical connectivity solutions, industrial automation trends, and infrastructure development.

Which region dominates the market?

-> Asia-Pacific is the largest market with a 49% share, followed by Europe and North America with 26% and 17% shares respectively.

What is the projected CAGR for Terminal Blocks Market?

-> The market is projected to grow at a 3.9% CAGR during the forecast period 2025-2033.

Terminal Blocks Market, Global Business Strategies 2026-2033

Get Sample Report PDF for Exclusive Insights

Report Sample Includes

  • Table of Contents
  • List of Tables & Figures
  • Charts, Research Methodology, and more...
PDF Icon Download Sample Report PDF

Download Sample Report

Table of Content

1 Introduction to Research & Analysis Reports
1.1 Terminal Blocks Market Definition
1.2 Market Segments
1.2.1 Segment by Type
1.2.2 Segment by Application
1.3 Global Terminal Blocks Market Overview
1.4 Features & Benefits of This Report
1.5 Methodology & Sources of Information
1.5.1 Research Methodology
1.5.2 Research Process
1.5.3 Base Year
1.5.4 Report Assumptions & Caveats
2 Global Terminal Blocks Overall Market Size
2.1 Global Terminal Blocks Market Size: 2024 VS 2032
2.2 Global Terminal Blocks Market Size, Prospects & Forecasts: 2020-2032
2.3 Global Terminal Blocks Sales: 2020-2032
3 Company Landscape
3.1 Top Terminal Blocks Players in Global Market
3.2 Top Global Terminal Blocks Companies Ranked by Revenue
3.3 Global Terminal Blocks Revenue by Companies
3.4 Global Terminal Blocks Sales by Companies
3.5 Global Terminal Blocks Price by Manufacturer (2020-2025)
3.6 Top 3 and Top 5 Terminal Blocks Companies in Global Market, by Revenue in 2024
3.7 Global Manufacturers Terminal Blocks Product Type
3.8 Tier 1, Tier 2, and Tier 3 Terminal Blocks Players in Global Market
3.8.1 List of Global Tier 1 Terminal Blocks Companies
3.8.2 List of Global Tier 2 and Tier 3 Terminal Blocks Companies
4 Sights by Product
4.1 Overview
4.1.1 Segment by Type – Global Terminal Blocks Market Size Markets, 2024 & 2032
4.1.2 Screw Type
4.1.3 Spring-cage Type
4.1.4 Push-in Type
4.1.5 Others
4.2 Segment by Type – Global Terminal Blocks Revenue & Forecasts
4.2.1 Segment by Type – Global Terminal Blocks Revenue, 2020-2025
4.2.2 Segment by Type – Global Terminal Blocks Revenue, 2026-2032
4.2.3 Segment by Type – Global Terminal Blocks Revenue Market Share, 2020-2032
4.3 Segment by Type – Global Terminal Blocks Sales & Forecasts
4.3.1 Segment by Type – Global Terminal Blocks Sales, 2020-2025
4.3.2 Segment by Type – Global Terminal Blocks Sales, 2026-2032
4.3.3 Segment by Type – Global Terminal Blocks Sales Market Share, 2020-2032
4.4 Segment by Type – Global Terminal Blocks Price (Manufacturers Selling Prices), 2020-2032
5 Sights by Application
5.1 Overview
5.1.1 Segment by Application – Global Terminal Blocks Market Size, 2024 & 2032
5.1.2 Electricity
5.1.3 Mechanical Equipment
5.1.4 Rail Transmit
5.1.5 Others
5.2 Segment by Application – Global Terminal Blocks Revenue & Forecasts
5.2.1 Segment by Application – Global Terminal Blocks Revenue, 2020-2025
5.2.2 Segment by Application – Global Terminal Blocks Revenue, 2026-2032
5.2.3 Segment by Application – Global Terminal Blocks Revenue Market Share, 2020-2032
5.3 Segment by Application – Global Terminal Blocks Sales & Forecasts
5.3.1 Segment by Application – Global Terminal Blocks Sales, 2020-2025
5.3.2 Segment by Application – Global Terminal Blocks Sales, 2026-2032
5.3.3 Segment by Application – Global Terminal Blocks Sales Market Share, 2020-2032
5.4 Segment by Application – Global Terminal Blocks Price (Manufacturers Selling Prices), 2020-2032
6 Sights by Region
6.1 By Region – Global Terminal Blocks Market Size, 2024 & 2032
6.2 By Region – Global Terminal Blocks Revenue & Forecasts
6.2.1 By Region – Global Terminal Blocks Revenue, 2020-2025
6.2.2 By Region – Global Terminal Blocks Revenue, 2026-2032
6.2.3 By Region – Global Terminal Blocks Revenue Market Share, 2020-2032
6.3 By Region – Global Terminal Blocks Sales & Forecasts
6.3.1 By Region – Global Terminal Blocks Sales, 2020-2025
6.3.2 By Region – Global Terminal Blocks Sales, 2026-2032
6.3.3 By Region – Global Terminal Blocks Sales Market Share, 2020-2032
6.4 North America
6.4.1 By Country – North America Terminal Blocks Revenue, 2020-2032
6.4.2 By Country – North America Terminal Blocks Sales, 2020-2032
6.4.3 United States Terminal Blocks Market Size, 2020-2032
6.4.4 Canada Terminal Blocks Market Size, 2020-2032
6.4.5 Mexico Terminal Blocks Market Size, 2020-2032
6.5 Europe
6.5.1 By Country – Europe Terminal Blocks Revenue, 2020-2032
6.5.2 By Country – Europe Terminal Blocks Sales, 2020-2032
6.5.3 Germany Terminal Blocks Market Size, 2020-2032
6.5.4 France Terminal Blocks Market Size, 2020-2032
6.5.5 U.K. Terminal Blocks Market Size, 2020-2032
6.5.6 Italy Terminal Blocks Market Size, 2020-2032
6.5.7 Russia Terminal Blocks Market Size, 2020-2032
6.5.8 Nordic Countries Terminal Blocks Market Size, 2020-2032
6.5.9 Benelux Terminal Blocks Market Size, 2020-2032
6.6 Asia
6.6.1 By Region – Asia Terminal Blocks Revenue, 2020-2032
6.6.2 By Region – Asia Terminal Blocks Sales, 2020-2032
6.6.3 China Terminal Blocks Market Size, 2020-2032
6.6.4 Japan Terminal Blocks Market Size, 2020-2032
6.6.5 South Korea Terminal Blocks Market Size, 2020-2032
6.6.6 Southeast Asia Terminal Blocks Market Size, 2020-2032
6.6.7 India Terminal Blocks Market Size, 2020-2032
6.7 South America
6.7.1 By Country – South America Terminal Blocks Revenue, 2020-2032
6.7.2 By Country – South America Terminal Blocks Sales, 2020-2032
6.7.3 Brazil Terminal Blocks Market Size, 2020-2032
6.7.4 Argentina Terminal Blocks Market Size, 2020-2032
6.8 Middle East & Africa
6.8.1 By Country – Middle East & Africa Terminal Blocks Revenue, 2020-2032
6.8.2 By Country – Middle East & Africa Terminal Blocks Sales, 2020-2032
6.8.3 Turkey Terminal Blocks Market Size, 2020-2032
6.8.4 Israel Terminal Blocks Market Size, 2020-2032
6.8.5 Saudi Arabia Terminal Blocks Market Size, 2020-2032
6.8.6 UAE Terminal Blocks Market Size, 2020-2032
7 Manufacturers & Brands Profiles
7.1 Phoenix Contact
7.1.1 Phoenix Contact Company Summary
7.1.2 Phoenix Contact Business Overview
7.1.3 Phoenix Contact Terminal Blocks Major Product Offerings
7.1.4 Phoenix Contact Terminal Blocks Sales and Revenue in Global (2020-2025)
7.1.5 Phoenix Contact Key News & Latest Developments
7.2 Weidmuller
7.2.1 Weidmuller Company Summary
7.2.2 Weidmuller Business Overview
7.2.3 Weidmuller Terminal Blocks Major Product Offerings
7.2.4 Weidmuller Terminal Blocks Sales and Revenue in Global (2020-2025)
7.2.5 Weidmuller Key News & Latest Developments
7.3 WAGO
7.3.1 WAGO Company Summary
7.3.2 WAGO Business Overview
7.3.3 WAGO Terminal Blocks Major Product Offerings
7.3.4 WAGO Terminal Blocks Sales and Revenue in Global (2020-2025)
7.3.5 WAGO Key News & Latest Developments
7.4 ABB
7.4.1 ABB Company Summary
7.4.2 ABB Business Overview
7.4.3 ABB Terminal Blocks Major Product Offerings
7.4.4 ABB Terminal Blocks Sales and Revenue in Global (2020-2025)
7.4.5 ABB Key News & Latest Developments
7.5 Rockwell Automation
7.5.1 Rockwell Automation Company Summary
7.5.2 Rockwell Automation Business Overview
7.5.3 Rockwell Automation Terminal Blocks Major Product Offerings
7.5.4 Rockwell Automation Terminal Blocks Sales and Revenue in Global (2020-2025)
7.5.5 Rockwell Automation Key News & Latest Developments
7.6 Amphenol (FCI)
7.6.1 Amphenol (FCI) Company Summary
7.6.2 Amphenol (FCI) Business Overview
7.6.3 Amphenol (FCI) Terminal Blocks Major Product Offerings
7.6.4 Amphenol (FCI) Terminal Blocks Sales and Revenue in Global (2020-2025)
7.6.5 Amphenol (FCI) Key News & Latest Developments
7.7 Omron
7.7.1 Omron Company Summary
7.7.2 Omron Business Overview
7.7.3 Omron Terminal Blocks Major Product Offerings
7.7.4 Omron Terminal Blocks Sales and Revenue in Global (2020-2025)
7.7.5 Omron Key News & Latest Developments
7.8 Wieland Electric
7.8.1 Wieland Electric Company Summary
7.8.2 Wieland Electric Business Overview
7.8.3 Wieland Electric Terminal Blocks Major Product Offerings
7.8.4 Wieland Electric Terminal Blocks Sales and Revenue in Global (2020-2025)
7.8.5 Wieland Electric Key News & Latest Developments
7.9 CHNT
7.9.1 CHNT Company Summary
7.9.2 CHNT Business Overview
7.9.3 CHNT Terminal Blocks Major Product Offerings
7.9.4 CHNT Terminal Blocks Sales and Revenue in Global (2020-2025)
7.9.5 CHNT Key News & Latest Developments
7.10 Dinkle
7.10.1 Dinkle Company Summary
7.10.2 Dinkle Business Overview
7.10.3 Dinkle Terminal Blocks Major Product Offerings
7.10.4 Dinkle Terminal Blocks Sales and Revenue in Global (2020-2025)
7.10.5 Dinkle Key News & Latest Developments
7.11 CNNT
7.11.1 CNNT Company Summary
7.11.2 CNNT Business Overview
7.11.3 CNNT Terminal Blocks Major Product Offerings
7.11.4 CNNT Terminal Blocks Sales and Revenue in Global (2020-2025)
7.11.5 CNNT Key News & Latest Developments
7.12 Leipole
7.12.1 Leipole Company Summary
7.12.2 Leipole Business Overview
7.12.3 Leipole Terminal Blocks Major Product Offerings
7.12.4 Leipole Terminal Blocks Sales and Revenue in Global (2020-2025)
7.12.5 Leipole Key News & Latest Developments
7.13 Shanghai Gkoncy Electric
7.13.1 Shanghai Gkoncy Electric Company Summary
7.13.2 Shanghai Gkoncy Electric Business Overview
7.13.3 Shanghai Gkoncy Electric Terminal Blocks Major Product Offerings
7.13.4 Shanghai Gkoncy Electric Terminal Blocks Sales and Revenue in Global (2020-2025)
7.13.5 Shanghai Gkoncy Electric Key News & Latest Developments
7.14 Yaowa
7.14.1 Yaowa Company Summary
7.14.2 Yaowa Business Overview
7.14.3 Yaowa Terminal Blocks Major Product Offerings
7.14.4 Yaowa Terminal Blocks Sales and Revenue in Global (2020-2025)
7.14.5 Yaowa Key News & Latest Developments
7.15 UPUN
7.15.1 UPUN Company Summary
7.15.2 UPUN Business Overview
7.15.3 UPUN Terminal Blocks Major Product Offerings
7.15.4 UPUN Terminal Blocks Sales and Revenue in Global (2020-2025)
7.15.5 UPUN Key News & Latest Developments
7.16 Reliance
7.16.1 Reliance Company Summary
7.16.2 Reliance Business Overview
7.16.3 Reliance Terminal Blocks Major Product Offerings
7.16.4 Reliance Terminal Blocks Sales and Revenue in Global (2020-2025)
7.16.5 Reliance Key News & Latest Developments
7.17 SUPU
7.17.1 SUPU Company Summary
7.17.2 SUPU Business Overview
7.17.3 SUPU Terminal Blocks Major Product Offerings
7.17.4 SUPU Terminal Blocks Sales and Revenue in Global (2020-2025)
7.17.5 SUPU Key News & Latest Developments
8 Global Terminal Blocks Production Capacity, Analysis
8.1 Global Terminal Blocks Production Capacity, 2020-2032
8.2 Terminal Blocks Production Capacity of Key Manufacturers in Global Market
8.3 Global Terminal Blocks Production by Region
9 Key Market Trends, Opportunity, Drivers and Restraints
9.1 Market Opportunities & Trends
9.2 Market Drivers
9.3 Market Restraints
10 Terminal Blocks Supply Chain Analysis
10.1 Terminal Blocks Industry Value Chain
10.2 Terminal Blocks Upstream Market
10.3 Terminal Blocks Downstream and Clients
10.4 Marketing Channels Analysis
10.4.1 Marketing Channels
10.4.2 Terminal Blocks Distributors and Sales Agents in Global
11 Conclusion
12 Appendix
12.1 Note
12.2 Examples of Clients
12.3 DisclaimerList of Tables
Table 1. Key Players of Terminal Blocks in Global Market
Table 2. Top Terminal Blocks Players in Global Market, Ranking by Revenue (2024)
Table 3. Global Terminal Blocks Revenue by Companies, (US$, Mn), 2020-2025
Table 4. Global Terminal Blocks Revenue Share by Companies, 2020-2025
Table 5. Global Terminal Blocks Sales by Companies, (K Units), 2020-2025
Table 6. Global Terminal Blocks Sales Share by Companies, 2020-2025
Table 7. Key Manufacturers Terminal Blocks Price (2020-2025) & (US$/Unit)
Table 8. Global Manufacturers Terminal Blocks Product Type
Table 9. List of Global Tier 1 Terminal Blocks Companies, Revenue (US$, Mn) in 2024 and Market Share
Table 10. List of Global Tier 2 and Tier 3 Terminal Blocks Companies, Revenue (US$, Mn) in 2024 and Market Share
Table 11. Segment by Type – Global Terminal Blocks Revenue, (US$, Mn), 2024 & 2032
Table 12. Segment by Type – Global Terminal Blocks Revenue (US$, Mn), 2020-2025
Table 13. Segment by Type – Global Terminal Blocks Revenue (US$, Mn), 2026-2032
Table 14. Segment by Type – Global Terminal Blocks Sales (K Units), 2020-2025
Table 15. Segment by Type – Global Terminal Blocks Sales (K Units), 2026-2032
Table 16. Segment by Application – Global Terminal Blocks Revenue, (US$, Mn), 2024 & 2032
Table 17. Segment by Application – Global Terminal Blocks Revenue, (US$, Mn), 2020-2025
Table 18. Segment by Application – Global Terminal Blocks Revenue, (US$, Mn), 2026-2032
Table 19. Segment by Application – Global Terminal Blocks Sales, (K Units), 2020-2025
Table 20. Segment by Application – Global Terminal Blocks Sales, (K Units), 2026-2032
Table 21. By Region – Global Terminal Blocks Revenue, (US$, Mn), 2025-2032
Table 22. By Region – Global Terminal Blocks Revenue, (US$, Mn), 2020-2025
Table 23. By Region – Global Terminal Blocks Revenue, (US$, Mn), 2026-2032
Table 24. By Region – Global Terminal Blocks Sales, (K Units), 2020-2025
Table 25. By Region – Global Terminal Blocks Sales, (K Units), 2026-2032
Table 26. By Country – North America Terminal Blocks Revenue, (US$, Mn), 2020-2025
Table 27. By Country – North America Terminal Blocks Revenue, (US$, Mn), 2026-2032
Table 28. By Country – North America Terminal Blocks Sales, (K Units), 2020-2025
Table 29. By Country – North America Terminal Blocks Sales, (K Units), 2026-2032
Table 30. By Country – Europe Terminal Blocks Revenue, (US$, Mn), 2020-2025
Table 31. By Country – Europe Terminal Blocks Revenue, (US$, Mn), 2026-2032
Table 32. By Country – Europe Terminal Blocks Sales, (K Units), 2020-2025
Table 33. By Country – Europe Terminal Blocks Sales, (K Units), 2026-2032
Table 34. By Region – Asia Terminal Blocks Revenue, (US$, Mn), 2020-2025
Table 35. By Region – Asia Terminal Blocks Revenue, (US$, Mn), 2026-2032
Table 36. By Region – Asia Terminal Blocks Sales, (K Units), 2020-2025
Table 37. By Region – Asia Terminal Blocks Sales, (K Units), 2026-2032
Table 38. By Country – South America Terminal Blocks Revenue, (US$, Mn), 2020-2025
Table 39. By Country – South America Terminal Blocks Revenue, (US$, Mn), 2026-2032
Table 40. By Country – South America Terminal Blocks Sales, (K Units), 2020-2025
Table 41. By Country – South America Terminal Blocks Sales, (K Units), 2026-2032
Table 42. By Country – Middle East & Africa Terminal Blocks Revenue, (US$, Mn), 2020-2025
Table 43. By Country – Middle East & Africa Terminal Blocks Revenue, (US$, Mn), 2026-2032
Table 44. By Country – Middle East & Africa Terminal Blocks Sales, (K Units), 2020-2025
Table 45. By Country – Middle East & Africa Terminal Blocks Sales, (K Units), 2026-2032
Table 46. Phoenix Contact Company Summary
Table 47. Phoenix Contact Terminal Blocks Product Offerings
Table 48. Phoenix Contact Terminal Blocks Sales (K Units), Revenue (US$, Mn) and Average Price (US$/Unit) & (2020-2025)
Table 49. Phoenix Contact Key News & Latest Developments
Table 50. Weidmuller Company Summary
Table 51. Weidmuller Terminal Blocks Product Offerings
Table 52. Weidmuller Terminal Blocks Sales (K Units), Revenue (US$, Mn) and Average Price (US$/Unit) & (2020-2025)
Table 53. Weidmuller Key News & Latest Developments
Table 54. WAGO Company Summary
Table 55. WAGO Terminal Blocks Product Offerings
Table 56. WAGO Terminal Blocks Sales (K Units), Revenue (US$, Mn) and Average Price (US$/Unit) & (2020-2025)
Table 57. WAGO Key News & Latest Developments
Table 58. ABB Company Summary
Table 59. ABB Terminal Blocks Product Offerings
Table 60. ABB Terminal Blocks Sales (K Units), Revenue (US$, Mn) and Average Price (US$/Unit) & (2020-2025)
Table 61. ABB Key News & Latest Developments
Table 62. Rockwell Automation Company Summary
Table 63. Rockwell Automation Terminal Blocks Product Offerings
Table 64. Rockwell Automation Terminal Blocks Sales (K Units), Revenue (US$, Mn) and Average Price (US$/Unit) & (2020-2025)
Table 65. Rockwell Automation Key News & Latest Developments
Table 66. Amphenol (FCI) Company Summary
Table 67. Amphenol (FCI) Terminal Blocks Product Offerings
Table 68. Amphenol (FCI) Terminal Blocks Sales (K Units), Revenue (US$, Mn) and Average Price (US$/Unit) & (2020-2025)
Table 69. Amphenol (FCI) Key News & Latest Developments
Table 70. Omron Company Summary
Table 71. Omron Terminal Blocks Product Offerings
Table 72. Omron Terminal Blocks Sales (K Units), Revenue (US$, Mn) and Average Price (US$/Unit) & (2020-2025)
Table 73. Omron Key News & Latest Developments
Table 74. Wieland Electric Company Summary
Table 75. Wieland Electric Terminal Blocks Product Offerings
Table 76. Wieland Electric Terminal Blocks Sales (K Units), Revenue (US$, Mn) and Average Price (US$/Unit) & (2020-2025)
Table 77. Wieland Electric Key News & Latest Developments
Table 78. CHNT Company Summary
Table 79. CHNT Terminal Blocks Product Offerings
Table 80. CHNT Terminal Blocks Sales (K Units), Revenue (US$, Mn) and Average Price (US$/Unit) & (2020-2025)
Table 81. CHNT Key News & Latest Developments
Table 82. Dinkle Company Summary
Table 83. Dinkle Terminal Blocks Product Offerings
Table 84. Dinkle Terminal Blocks Sales (K Units), Revenue (US$, Mn) and Average Price (US$/Unit) & (2020-2025)
Table 85. Dinkle Key News & Latest Developments
Table 86. CNNT Company Summary
Table 87. CNNT Terminal Blocks Product Offerings
Table 88. CNNT Terminal Blocks Sales (K Units), Revenue (US$, Mn) and Average Price (US$/Unit) & (2020-2025)
Table 89. CNNT Key News & Latest Developments
Table 90. Leipole Company Summary
Table 91. Leipole Terminal Blocks Product Offerings
Table 92. Leipole Terminal Blocks Sales (K Units), Revenue (US$, Mn) and Average Price (US$/Unit) & (2020-2025)
Table 93. Leipole Key News & Latest Developments
Table 94. Shanghai Gkoncy Electric Company Summary
Table 95. Shanghai Gkoncy Electric Terminal Blocks Product Offerings
Table 96. Shanghai Gkoncy Electric Terminal Blocks Sales (K Units), Revenue (US$, Mn) and Average Price (US$/Unit) & (2020-2025)
Table 97. Shanghai Gkoncy Electric Key News & Latest Developments
Table 98. Yaowa Company Summary
Table 99. Yaowa Terminal Blocks Product Offerings
Table 100. Yaowa Terminal Blocks Sales (K Units), Revenue (US$, Mn) and Average Price (US$/Unit) & (2020-2025)
Table 101. Yaowa Key News & Latest Developments
Table 102. UPUN Company Summary
Table 103. UPUN Terminal Blocks Product Offerings
Table 104. UPUN Terminal Blocks Sales (K Units), Revenue (US$, Mn) and Average Price (US$/Unit) & (2020-2025)
Table 105. UPUN Key News & Latest Developments
Table 106. Reliance Company Summary
Table 107. Reliance Terminal Blocks Product Offerings
Table 108. Reliance Terminal Blocks Sales (K Units), Revenue (US$, Mn) and Average Price (US$/Unit) & (2020-2025)
Table 109. Reliance Key News & Latest Developments
Table 110. SUPU Company Summary
Table 111. SUPU Terminal Blocks Product Offerings
Table 112. SUPU Terminal Blocks Sales (K Units), Revenue (US$, Mn) and Average Price (US$/Unit) & (2020-2025)
Table 113. SUPU Key News & Latest Developments
Table 114. Terminal Blocks Capacity of Key Manufacturers in Global Market, 2023-2025 (K Units)
Table 115. Global Terminal Blocks Capacity Market Share of Key Manufacturers, 2023-2025
Table 116. Global Terminal Blocks Production by Region, 2020-2025 (K Units)
Table 117. Global Terminal Blocks Production by Region, 2026-2032 (K Units)
Table 118. Terminal Blocks Market Opportunities & Trends in Global Market
Table 119. Terminal Blocks Market Drivers in Global Market
Table 120. Terminal Blocks Market Restraints in Global Market
Table 121. Terminal Blocks Raw Materials
Table 122. Terminal Blocks Raw Materials Suppliers in Global Market
Table 123. Typical Terminal Blocks Downstream
Table 124. Terminal Blocks Downstream Clients in Global Market
Table 125. Terminal Blocks Distributors and Sales Agents in Global Market

List of Figures
Figure 1. Terminal Blocks Product Picture
Figure 2. Terminal Blocks Segment by Type in 2024
Figure 3. Terminal Blocks Segment by Application in 2024
Figure 4. Global Terminal Blocks Market Overview: 2024
Figure 5. Key Caveats
Figure 6. Global Terminal Blocks Market Size: 2024 VS 2032 (US$, Mn)
Figure 7. Global Terminal Blocks Revenue: 2020-2032 (US$, Mn)
Figure 8. Terminal Blocks Sales in Global Market: 2020-2032 (K Units)
Figure 9. The Top 3 and 5 Players Market Share by Terminal Blocks Revenue in 2024
Figure 10. Segment by Type – Global Terminal Blocks Revenue, (US$, Mn), 2024 & 2032
Figure 11. Segment by Type – Global Terminal Blocks Revenue Market Share, 2020-2032
Figure 12. Segment by Type – Global Terminal Blocks Sales Market Share, 2020-2032
Figure 13. Segment by Type – Global Terminal Blocks Price (US$/Unit), 2020-2032
Figure 14. Segment by Application – Global Terminal Blocks Revenue, (US$, Mn), 2024 & 2032
Figure 15. Segment by Application – Global Terminal Blocks Revenue Market Share, 2020-2032
Figure 16. Segment by Application – Global Terminal Blocks Sales Market Share, 2020-2032
Figure 17. Segment by Application -Global Terminal Blocks Price (US$/Unit), 2020-2032
Figure 18. By Region – Global Terminal Blocks Revenue, (US$, Mn), 2025 & 2032
Figure 19. By Region – Global Terminal Blocks Revenue Market Share, 2020 VS 2024 VS 2032
Figure 20. By Region – Global Terminal Blocks Revenue Market Share, 2020-2032
Figure 21. By Region – Global Terminal Blocks Sales Market Share, 2020-2032
Figure 22. By Country – North America Terminal Blocks Revenue Market Share, 2020-2032
Figure 23. By Country – North America Terminal Blocks Sales Market Share, 2020-2032
Figure 24. United States Terminal Blocks Revenue, (US$, Mn), 2020-2032
Figure 25. Canada Terminal Blocks Revenue, (US$, Mn), 2020-2032
Figure 26. Mexico Terminal Blocks Revenue, (US$, Mn), 2020-2032
Figure 27. By Country – Europe Terminal Blocks Revenue Market Share, 2020-2032
Figure 28. By Country – Europe Terminal Blocks Sales Market Share, 2020-2032
Figure 29. Germany Terminal Blocks Revenue, (US$, Mn), 2020-2032
Figure 30. France Terminal Blocks Revenue, (US$, Mn), 2020-2032
Figure 31. U.K. Terminal Blocks Revenue, (US$, Mn), 2020-2032
Figure 32. Italy Terminal Blocks Revenue, (US$, Mn), 2020-2032
Figure 33. Russia Terminal Blocks Revenue, (US$, Mn), 2020-2032
Figure 34. Nordic Countries Terminal Blocks Revenue, (US$, Mn), 2020-2032
Figure 35. Benelux Terminal Blocks Revenue, (US$, Mn), 2020-2032
Figure 36. By Region – Asia Terminal Blocks Revenue Market Share, 2020-2032
Figure 37. By Region – Asia Terminal Blocks Sales Market Share, 2020-2032
Figure 38. China Terminal Blocks Revenue, (US$, Mn), 2020-2032
Figure 39. Japan Terminal Blocks Revenue, (US$, Mn), 2020-2032
Figure 40. South Korea Terminal Blocks Revenue, (US$, Mn), 2020-2032
Figure 41. Southeast Asia Terminal Blocks Revenue, (US$, Mn), 2020-2032
Figure 42. India Terminal Blocks Revenue, (US$, Mn), 2020-2032
Figure 43. By Country – South America Terminal Blocks Revenue Market Share, 2020-2032
Figure 44. By Country – South America Terminal Blocks Sales, Market Share, 2020-2032
Figure 45. Brazil Terminal Blocks Revenue, (US$, Mn), 2020-2032
Figure 46. Argentina Terminal Blocks Revenue, (US$, Mn), 2020-2032
Figure 47. By Country – Middle East & Africa Terminal Blocks Revenue, Market Share, 2020-2032
Figure 48. By Country – Middle East & Africa Terminal Blocks Sales, Market Share, 2020-2032
Figure 49. Turkey Terminal Blocks Revenue, (US$, Mn), 2020-2032
Figure 50. Israel Terminal Blocks Revenue, (US$, Mn), 2020-2032
Figure 51. Saudi Arabia Terminal Blocks Revenue, (US$, Mn), 2020-2032
Figure 52. UAE Terminal Blocks Revenue, (US$, Mn), 2020-2032
Figure 53. Global Terminal Blocks Production Capacity (K Units), 2020-2032
Figure 54. The Percentage of Production Terminal Blocks by Region, 2024 VS 2032
Figure 55. Terminal Blocks Industry Value Chain
Figure 56. Marketing Channels