MARKET INSIGHTS
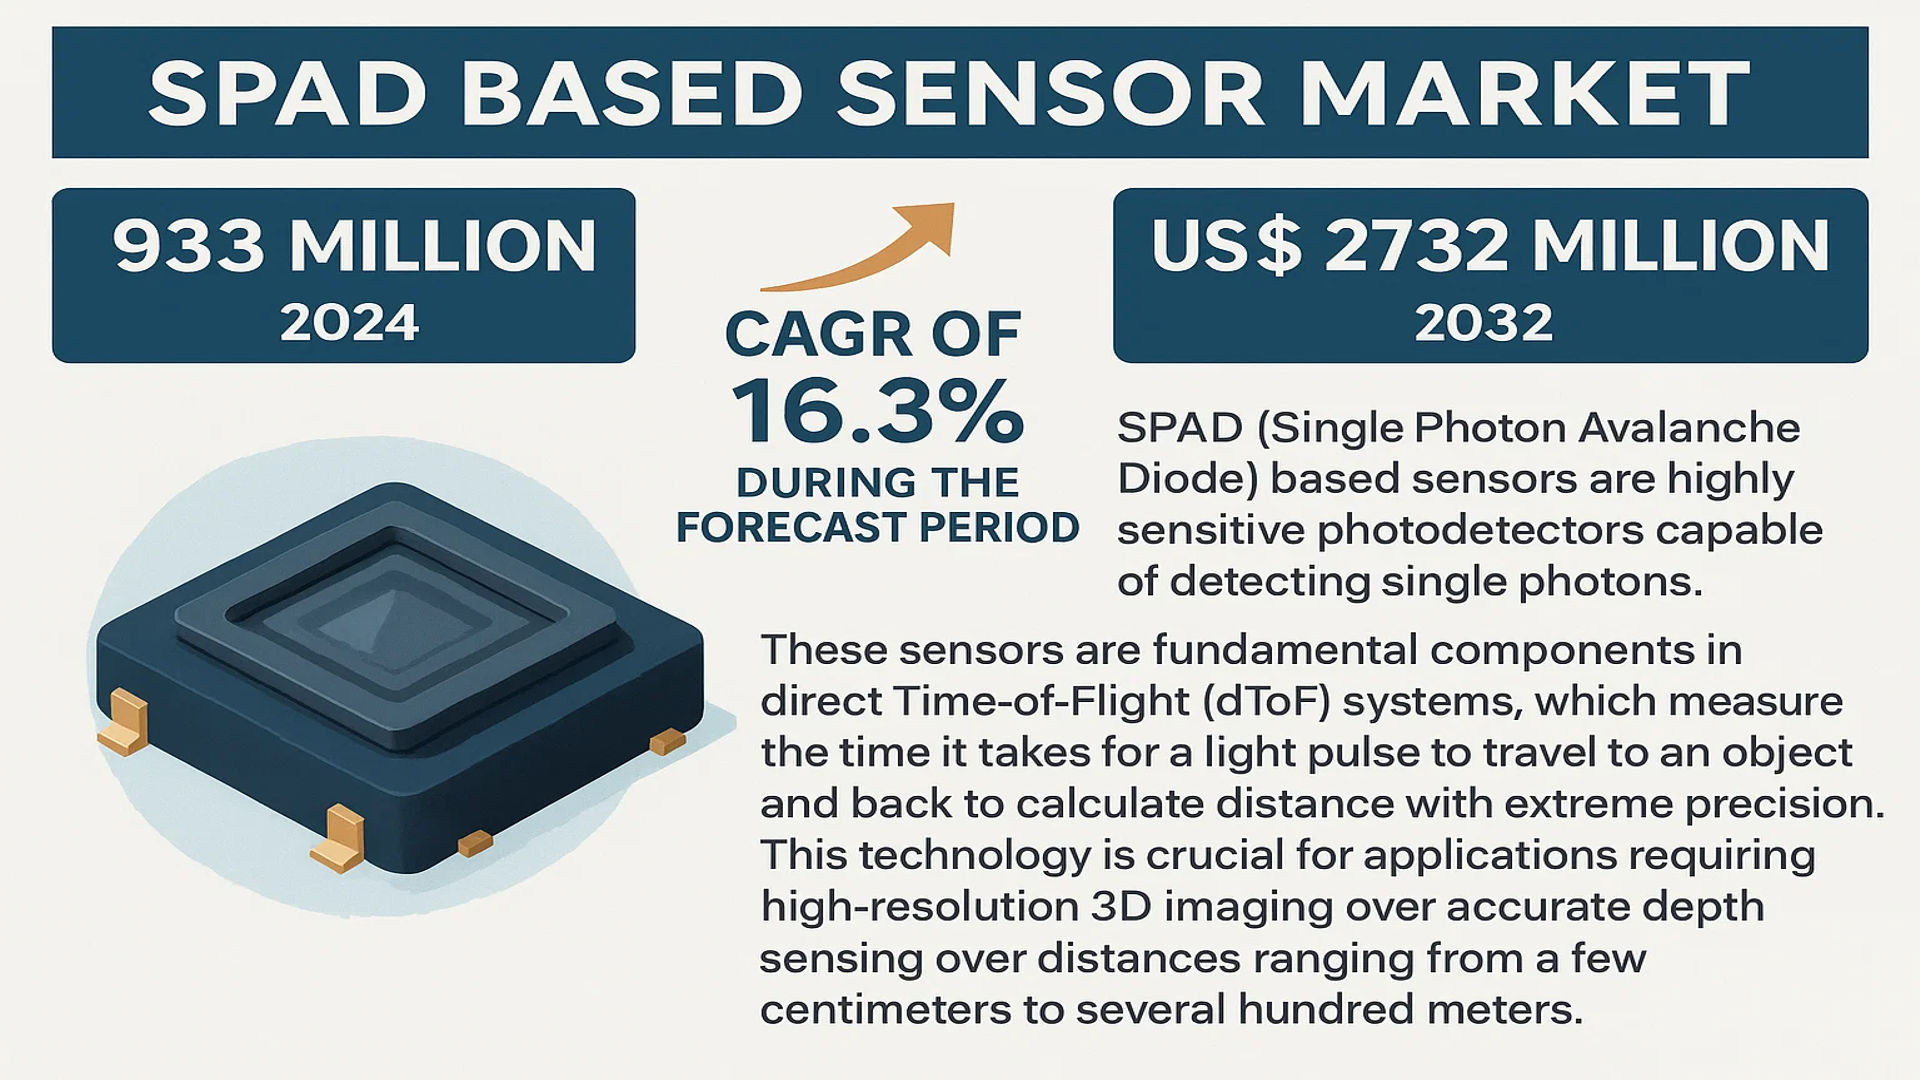
The global SPAD based Sensor Market was valued at 933 million in 2024 and is projected to reach US$ 2732 million by 2032, at a CAGR of 16.3% during the forecast period.
SPAD (Single Photon Avalanche Diode) based sensors are highly sensitive photodetectors capable of detecting single photons. These sensors are fundamental components in direct Time-of-Flight (dToF) systems, which measure the time it takes for a light pulse to travel to an object and back to calculate distance with extreme precision. This technology is crucial for applications requiring high-resolution 3D imaging and accurate depth sensing over distances ranging from a few centimeters to several hundred meters.
The market is experiencing rapid growth due to several factors, including the surging adoption in consumer electronics, particularly in smartphones for advanced camera autofocus and augmented reality features, which accounts for approximately 87% of the application share. Furthermore, advancements in industrial automation and automotive LiDAR systems are significant contributors. The market is highly concentrated, with the top three players—STMicroelectronics, ams OSRAM, and Sony—collectively holding over 90% market share. Geographically, Asia-Pacific dominates as the largest market, holding a share of about 67%, driven by robust electronics manufacturing in the region.
MARKET DYNAMICS
MARKET DRIVERS
Proliferation of 3D Sensing in Consumer Electronics to Accelerate Market Expansion
The consumer electronics sector is witnessing unprecedented adoption of SPAD-based dToF sensors, primarily driven by the integration of advanced 3D sensing capabilities in smartphones, tablets, and wearable devices. These sensors enable critical functionalities such as facial recognition, augmented reality applications, and improved photography features by providing high-precision depth mapping. With over 1.4 billion smartphones shipped globally annually, manufacturers are increasingly incorporating dToF technology to enhance user experience and differentiate products in a competitive market. The ability to measure distances up to several meters with millimeter-level accuracy makes SPAD sensors indispensable for next-generation mobile devices. This surge is further amplified by the growing demand for immersive AR/VR experiences, where precise depth perception is fundamental to creating realistic digital interactions.
Advancements in Automotive LiDAR Systems to Fuel Sensor Demand
Automotive safety and autonomy requirements are creating substantial opportunities for SPAD-based sensors, particularly in LiDAR systems for advanced driver assistance systems (ADAS) and autonomous vehicles. These sensors provide the high sensitivity and rapid response times necessary for detecting obstacles, pedestrians, and other vehicles in various driving conditions. The automotive LiDAR market is projected to grow significantly as regulatory bodies worldwide mandate enhanced safety features and consumers increasingly value autonomous capabilities. SPAD sensors’ ability to function effectively in challenging environmental conditions, including bright sunlight and adverse weather, makes them particularly valuable for automotive applications. This driver is reinforced by increasing investments in autonomous vehicle technology from both established automotive manufacturers and technology companies entering the mobility sector.
Industrial Automation and Robotics Adoption to Stimulate Market Growth
Industrial automation represents a rapidly expanding application area for SPAD-based sensors, where they facilitate precise object detection, quality control, and robotic navigation. Manufacturing facilities worldwide are increasingly implementing Industry 4.0 technologies, requiring sensors that can operate reliably in complex industrial environments with high levels of accuracy. These sensors enable robots to perceive their surroundings with exceptional precision, allowing for safer human-robot collaboration and more efficient production processes. The global industrial automation market continues to grow as companies seek to improve efficiency, reduce operational costs, and enhance workplace safety. SPAD sensors’ capability to provide reliable 3D imaging in challenging conditions positions them as critical components in smart manufacturing ecosystems.
Furthermore, the expansion of e-commerce and logistics automation has created additional demand for these sensors in warehouse management systems, where they enable automated inventory tracking, package sorting, and autonomous material handling equipment navigation.
MARKET RESTRAINTS
High Manufacturing Complexity and Cost Constraints to Limit Market Penetration
While SPAD-based sensors offer exceptional performance characteristics, their manufacturing process involves sophisticated semiconductor fabrication techniques that contribute significantly to production costs. The requirement for specialized manufacturing facilities and processes, including backside illumination technology and advanced packaging solutions, creates substantial barriers to entry and limits widespread adoption across cost-sensitive applications. The complex nature of SPAD array production results in higher per-unit costs compared to conventional sensor technologies, making them less accessible for applications where budget constraints are paramount. This cost sensitivity is particularly evident in consumer markets where price competition is intense and manufacturers must carefully balance performance enhancements with production expenses.
Technical Limitations in Environmental Conditions to Hinder Market Adoption
SPAD sensors face performance challenges in certain environmental conditions that can restrict their application scope. Although they demonstrate superior performance in many scenarios, factors such as multipath interference, ambient light saturation, and varying reflectivity of target surfaces can affect measurement accuracy. In automotive applications, for instance, adverse weather conditions including rain, fog, or snow can scatter light signals and reduce sensor effectiveness. These technical limitations necessitate additional signal processing algorithms and compensation mechanisms, increasing system complexity and development costs. The requirement for sophisticated calibration and environmental adaptation techniques presents implementation challenges that can delay product development cycles and increase time-to-market for applications requiring robust performance across diverse operating conditions.
Supply Chain Constraints and Material Availability to Impact Market Stability
The specialized nature of SPAD sensor manufacturing creates dependencies on specific materials and fabrication processes that can be susceptible to supply chain disruptions. The semiconductor industry’s cyclical nature, combined with global supply chain vulnerabilities, poses significant challenges for consistent sensor production and availability. Recent global events have highlighted the fragility of semiconductor supply chains, with production delays and component shortages affecting various technology sectors. For SPAD sensors, which require specialized semiconductor processes and materials, these disruptions can be particularly impactful. The concentration of manufacturing capabilities among a limited number of suppliers further exacerbates supply chain risks, potentially limiting market growth during periods of high demand or supply constraints.
MARKET CHALLENGES
Intense Market Competition and Intellectual Property Barriers to Challenge New Entrants
The SPAD sensor market is characterized by significant intellectual property concentration and high barriers to entry, creating challenges for new market participants. Established players hold extensive patent portfolios covering fundamental aspects of SPAD design, manufacturing processes, and application implementations. This intellectual property landscape requires considerable investment in research and development to navigate while avoiding infringement issues. The market dominance of top three manufacturers controlling over 90% of market share creates additional challenges for new entrants seeking to establish competitive positions. The need for substantial capital investment in specialized manufacturing facilities and research capabilities further compounds these challenges, potentially limiting innovation and market diversity.
Other Challenges
Standardization and Interoperability Issues
The lack of industry-wide standards for SPAD-based systems creates integration challenges and increases development costs for implementers. varying performance specifications, interface protocols, and data formats across different manufacturers’ products complicate system design and limit compatibility between components from different suppliers. This absence of standardization requires additional engineering resources to ensure seamless integration and may slow adoption in applications where interoperability is critical.
Technical Expertise Shortage and Skill Gap
The specialized nature of SPAD technology creates a significant shortage of qualified engineers and researchers with expertise in both semiconductor physics and application implementation. The multidisciplinary knowledge required spans quantum efficiency optimization, signal processing, and system integration, making talent acquisition challenging. This skills gap can delay product development and innovation, particularly as market demand accelerates and companies compete for limited specialized talent.
MARKET OPPORTUNITIES
Emerging Applications in Healthcare and Biomedical Imaging to Unlock New Growth Avenues
Healthcare applications represent a significant growth opportunity for SPAD-based sensors, particularly in biomedical imaging and diagnostic equipment. These sensors enable advanced medical imaging techniques including fluorescence lifetime imaging microscopy (FLIM) and time-resolved spectroscopy, providing researchers and clinicians with powerful tools for studying biological processes at the cellular level. The ability to detect single photons makes SPAD sensors invaluable for low-light imaging applications common in biological research and medical diagnostics. The global biomedical imaging market continues to expand as healthcare providers increasingly adopt advanced diagnostic technologies and research institutions pursue new understanding of disease mechanisms. This growth trajectory creates substantial opportunities for SPAD sensor implementation in both research and clinical settings.
Expansion in Aerospace and Defense Applications to Drive Future Market Growth
Aerospace and defense sectors present significant opportunities for SPAD sensor adoption, particularly in surveillance, navigation, and remote sensing applications. These sensors’ ability to provide precise distance measurement under challenging conditions makes them suitable for military applications including target identification, terrain mapping, and secure communications. The increasing deployment of unmanned aerial vehicles and satellite-based monitoring systems further drives demand for compact, high-performance sensors capable of operating in extreme environments. Government investments in defense modernization and space exploration programs worldwide create additional opportunities for specialized sensor technologies that can meet rigorous performance and reliability requirements.
Development of Smart Infrastructure and IoT Ecosystems to Create New Application Fields
The evolution of smart cities and Internet of Things infrastructure creates expanding opportunities for SPAD-based sensors in urban management, traffic control, and environmental monitoring. These sensors can enhance public safety through improved surveillance systems, optimize traffic flow through intelligent monitoring, and enable precise environmental data collection. The global smart city initiative investments continue to grow as urban areas worldwide seek to implement technology solutions for improved efficiency and sustainability. SPAD sensors’ ability to provide reliable 3D data in outdoor environments positions them as valuable components in these evolving smart infrastructure ecosystems, particularly as cities implement more sophisticated monitoring and management systems.
Additionally, the integration of SPAD sensors with emerging 5G and edge computing technologies enables new applications in real-time spatial awareness and interactive systems, further expanding their potential deployment scenarios across various smart infrastructure applications.
SPAD BASED SENSOR MARKET TRENDS
Integration of Advanced 3D Sensing in Consumer Electronics to Emerge as a Dominant Trend
The integration of advanced 3D sensing technologies, particularly those utilizing Single Photon Avalanche Diode (SPAD) arrays, is revolutionizing the consumer electronics sector and significantly driving market growth. This trend is primarily fueled by the widespread adoption of direct Time-of-Flight (dToF) sensors in flagship smartphones, tablets, and augmented reality (AR) devices for applications such as facial recognition, LiDAR scanning, and immersive gaming. The global market for 3D dToF sensors, which constitute over 94% of the SPAD sensor market, is experiencing robust growth due to their superior performance in low-light conditions and their ability to accurately measure distances up to several hundred meters. Recent innovations have focused on enhancing pixel pitch, reducing power consumption, and improving overall system integration, making these sensors indispensable for next-generation user interfaces and computational photography. Furthermore, the development of smaller form factors and higher resolution SPAD arrays is enabling their deployment in a broader range of compact devices, thereby expanding their addressable market.
Other Trends
Expansion into Industrial Automation and Robotics
While consumer electronics currently dominate application share at approximately 87%, the expansion into industrial automation and robotics represents a significant growth vector for SPAD-based sensors. These sensors are increasingly being deployed for high-precision tasks such as object detection, collision avoidance, and quality control on assembly lines. Their ability to provide accurate depth perception and operate effectively in challenging environmental conditions, including variable lighting and high-speed scenarios, makes them ideal for Industry 4.0 applications. The demand for automation is accelerating, with investments in smart manufacturing technologies creating a substantial opportunity for high-performance sensing solutions that can enhance operational efficiency and safety.
Technological Advancements in Sensor Performance and Material Science
The relentless pursuit of technological advancement is a cornerstone of the SPAD sensor market’s evolution. Continuous improvements in key performance indicators, including photon detection efficiency (PDE), dark count rate (DCR), and timing jitter, are broadening the application scope of these sensors. Research into new semiconductor materials and fabrication processes is yielding devices with higher fill factors and greater stability in harsh operating environments. Moreover, the integration of SPAD sensors with advanced readout integrated circuits (ROICs) and signal processing algorithms is enhancing system-level performance, enabling more sophisticated data interpretation and faster response times. These innovations are not only cementing the position of SPAD sensors in existing markets but are also paving the way for their adoption in emerging fields such as autonomous vehicles and biomedical imaging, where extreme reliability and precision are paramount.
COMPETITIVE LANDSCAPE
Key Industry Players
Technological Innovation and Strategic Alliances Drive Market Leadership
The global SPAD based sensor market exhibits a highly concentrated competitive structure, dominated by a handful of major semiconductor and electronics giants. This concentration is primarily because the design and fabrication of Single Photon Avalanche Diode (SPAD) sensors require significant expertise in advanced semiconductor processes and substantial capital investment. STMicroelectronics has established itself as a preeminent force, largely due to its extensive manufacturing capabilities, robust R&D investments in imaging technologies, and its strategic positioning within the global consumer electronics supply chain, particularly for smartphones and automotive LiDAR applications.
ams OSRAM and Sony Group Corporation are also pivotal players, collectively accounting for a dominant portion of the market revenue. Sony’s strength is deeply rooted in its vertical integration; it manufactures sensors for its own consumer electronics products while also being a leading supplier to other smartphone OEMs. Its sensors are renowned for high performance in low-light conditions. ams OSRAM, following its acquisition of OSRAM, leverages deep expertise in optoelectronics and photonics to develop highly sensitive SPAD arrays for a diverse range of applications from consumer depth sensing to industrial automation.
Furthermore, these market leaders are actively pursuing growth through continuous innovation and expansion. Product development is focused on enhancing key performance metrics such as photon detection efficiency (PDE), reducing dark count rates, and improving resolution. Geographical expansion into high-growth regions, particularly within the Asia-Pacific market which holds over two-thirds of global demand, is a critical strategy for maintaining and growing market share. Recent developments include collaborations with automotive manufacturers for advanced driver-assistance systems (ADAS) and partnerships with tech companies for next-generation augmented reality (AR) devices.
Meanwhile, other significant participants like Canon Inc. and emerging specialists such as visionICs are strengthening their market positions. Canon leverages its historical expertise in optical systems to develop specialized SPAD sensors for scientific and medical imaging. These companies, though holding smaller shares, compete effectively by focusing on niche applications and through significant investments in proprietary technologies and strategic R&D partnerships, ensuring dynamic evolution within the competitive landscape.
List of Key SPAD based Sensor Companies Profiled
- STMicroelectronics (Switzerland)
- ams OSRAM AG (Austria)
- Sony Group Corporation (Japan)
- Canon Inc. (Japan)
- visionICs (Germany)
- Adaps Photonics (China)
Segment Analysis:
By Type
3D dToF Sensor Segment Dominates the Market Due to Its Critical Role in Consumer Electronics and Depth Sensing Applications
The market is segmented based on type into:
- 1D dToF Sensor
- 3D dToF Sensor
By Application
Consumer Electronics Segment Leads Due to High Adoption in Smartphones, AR/VR, and Automotive LiDAR Systems
The market is segmented based on application into:
- Consumer Electronics
- Industrial Automation
- Others
By Technology
Direct Time-of-Flight (dToF) Technology Holds Prominence for Its Superior Ranging Accuracy and Power Efficiency
The market is segmented based on technology into:
- Direct Time-of-Flight (dToF)
- Indirect Time-of-Flight (iToF)
By End-User Industry
Automotive and Industrial Sectors Exhibit Significant Growth Potential for LiDAR and Machine Vision Applications
The market is segmented based on end-user industry into:
- Consumer Electronics
- Automotive
- Industrial
- Healthcare
- Others
Regional Analysis: SPAD based Sensor Market
Asia-Pacific
The Asia-Pacific region dominates the global SPAD based Sensor market, accounting for approximately 67% of total market share. This leadership position is driven by massive consumer electronics manufacturing hubs in China, South Korea, and Japan, where SPAD sensors are extensively integrated into smartphones, tablets, and AR/VR devices for 3D sensing and LiDAR applications. China’s substantial investments in semiconductor self-sufficiency through initiatives like “Made in China 2025” have accelerated local SPAD sensor development. While cost sensitivity remains a factor, the region shows increasing adoption of advanced 3D dToF sensors due to growing demand for high-performance imaging in mobile and automotive applications. The presence of major global players like Sony further strengthens the region’s supply chain and technological advancement.
North America
North America represents a significant innovation hub for SPAD sensor technology, characterized by strong R&D investments and early adoption in emerging applications. The region benefits from substantial venture capital funding in quantum technology and advanced imaging systems, with several startups and established companies developing SPAD-based solutions for autonomous vehicles, medical imaging, and scientific instruments. Stringent quality standards and intellectual property protection foster technological advancement, while defense and aerospace applications provide additional demand drivers. The market is particularly strong in the United States, where both tech giants and specialized firms are pushing the boundaries of SPAD sensor performance for next-generation applications.
Europe
Europe maintains a strong position in the SPAD sensor market through technological excellence and specialized industrial applications. The region benefits from robust automotive and industrial automation sectors that utilize SPAD sensors for precision measurement and safety systems. European research institutions and companies are at the forefront of developing SPAD sensors for medical diagnostics and scientific research, leveraging the region’s strong healthcare technology ecosystem. Environmental regulations and quality standards drive innovation toward more efficient and reliable sensor designs. While consumer electronics adoption is growing, the European market distinguishes itself through high-value industrial and medical applications that demand superior performance and reliability.
South America
The South American SPAD sensor market is emerging, with growth primarily driven by industrial automation and gradual technology adoption in consumer electronics. Brazil represents the largest market in the region, where manufacturing modernization initiatives are creating opportunities for sensor integration. However, economic volatility and limited local semiconductor manufacturing capacity restrain market growth compared to other regions. The market shows potential in agricultural technology and mining applications, where SPAD sensors could enable advanced monitoring and automation systems. While currently a smaller market, increasing digitalization and technology investment across various industries suggest long-term growth opportunities.
Middle East & Africa
The Middle East & Africa region represents a developing market for SPAD sensors, with adoption primarily focused on specific high-value applications rather than mass-market consumer electronics. The region shows growing interest in SPAD technology for security and surveillance systems, oil and gas infrastructure monitoring, and medical equipment. Limited local manufacturing and reliance on imports currently constrain market growth, but increasing technology investment in Gulf Cooperation Council countries indicates potential for future expansion. The market’s development is gradual, with growth tied to broader digital transformation initiatives and infrastructure modernization projects across the region.
Report Scope
This market research report provides a comprehensive analysis of the global and regional SPAD based Sensor markets, covering the forecast period 2025–2032. It offers detailed insights into market dynamics, technological advancements, competitive landscape, and key trends shaping the industry.
Key focus areas of the report include:
- Market Size & Forecast: Historical data and future projections for revenue, unit shipments, and market value across major regions and segments.
- Segmentation Analysis: Detailed breakdown by product type, technology, application, and end-user industry to identify high-growth segments and investment opportunities.
- Regional Outlook: Insights into market performance across North America, Europe, Asia-Pacific, Latin America, and the Middle East & Africa, including country-level analysis where relevant.
- Competitive Landscape: Profiles of leading market participants, including their product offerings, R&D focus, manufacturing capacity, pricing strategies, and recent developments such as mergers, acquisitions, and partnerships.
- Technology Trends & Innovation: Assessment of emerging technologies, integration of AI/IoT, semiconductor design trends, fabrication techniques, and evolving industry standards.
- Market Drivers & Restraints: Evaluation of factors driving market growth along with challenges, supply chain constraints, regulatory issues, and market-entry barriers.
- Stakeholder Analysis: Insights for component suppliers, OEMs, system integrators, investors, and policymakers regarding the evolving ecosystem and strategic opportunities.
Primary and secondary research methods are employed, including interviews with industry experts, data from verified sources, and real-time market intelligence to ensure the accuracy and reliability of the insights presented.
FREQUENTLY ASKED QUESTIONS:
What is the current market size of Global SPAD based Sensor Market?
-> SPAD based Sensor Market was valued at 933 million in 2024 and is projected to reach US$ 2732 million by 2032, at a CAGR of 16.3% during the forecast period.
Which key companies operate in Global SPAD based Sensor Market?
-> Key players include STMicroelectronics, ams OSRAM, Sony, Canon, visionICs, and Adaps Photonics, among others.
What are the key growth drivers?
-> Key growth drivers include technological innovation in sensor performance, rising demand from consumer electronics, industrial automation applications, and supportive government policies.
Which region dominates the market?
-> Asia-Pacific is the largest market with approximately 67% share, driven by strong manufacturing and electronics industries.
What are the emerging trends?
-> Emerging trends include integration of SPAD sensors in medical imaging, development of advanced materials for harsh environments, and expansion into autonomous vehicle applications.

Get Sample Report PDF for Exclusive Insights
Report Sample Includes
- Table of Contents
- List of Tables & Figures
- Charts, Research Methodology, and more...


