Smart 3D Cameras Market, Size, Trends, Business Strategies 2025-2032

The global Smart 3D Cameras Market size was estimated at USD 1837 million in 2023 and is projected to reach USD 3423.34 million by 2030, exhibiting a CAGR of 9.30% during the forecast period.

PDF Icon Download Sample Report PDF
  • Quick Dispatch

    All Orders

  • Secure Payment

    100% Secure Payment

Compare

$1,500.00$4,250.00

Clear

Smart 3D Cameras Market Overview

The smart 3D camera has dozens of functions such as face recognition, gesture recognition, human skeleton recognition, 3D measurement, environment perception, 3D map reconstruction, etc. It can be widely used in television, mobile phones, robots, drones, logistics, VR / AR, smart home security, automotive driving assistance, and other fields.

This report provides a deep insight into the global Smart 3D Cameras market covering all its essential aspects. This ranges from a macro overview of the market to micro details of the market size, competitive landscape, development trend, niche market, key market drivers and challenges, SWOT analysis, value chain analysis, etc.

The analysis helps the reader to shape the competition within the industries and strategies for the competitive environment to enhance the potential profit. Furthermore, it provides a simple framework for evaluating and accessing the position of the business organization. The report structure also focuses on the competitive landscape of the Global Smart 3D Cameras Market, this report introduces in detail the market share, market performance, product situation, operation situation, etc. of the main players, which helps the readers in the industry to identify the main competitors and deeply understand the competition pattern of the market.
In a word, this report is a must-read for industry players, investors, researchers, consultants, business strategists, and all those who have any kind of stake or are planning to foray into the Smart 3D Cameras market in any manner.

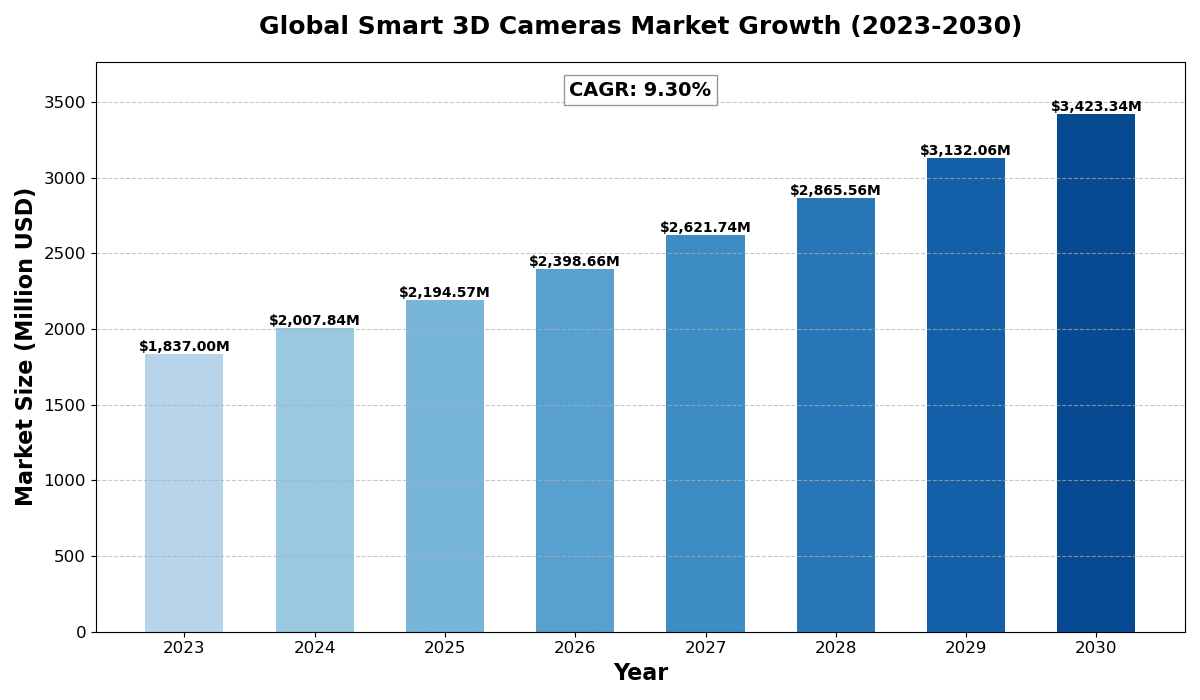
Smart 3D Cameras Market Analysis:

The global Smart 3D Cameras Market size was estimated at USD 1837 million in 2023 and is projected to reach USD 3423.34 million by 2030, exhibiting a CAGR of 9.30% during the forecast period.

North America Smart 3D Cameras market size was USD 478.67 million in 2023, at a CAGR of 7.97% during the forecast period of 2025 through 2030.

Smart 3D Cameras Key Market Trends  :

  1. Integration with AI and IoT
    Smart 3D cameras are increasingly integrated with AI and IoT, enhancing automation in security, automotive, and consumer electronics.
  2. Rising Adoption in Automotive and Robotics
    The automotive industry is leveraging smart 3D cameras for autonomous driving and driver-assist features, while robotics benefits from improved perception and navigation.
  3. Growth in AR/VR Applications
    The demand for immersive experiences in gaming, training, and healthcare is driving the adoption of smart 3D cameras in AR/VR devices.
  4. Advancements in Time-of-Flight (ToF) Technology
    ToF-based 3D cameras are gaining traction due to their high precision and application in smartphones, security, and industrial automation.
  5. Expansion in Smart Home Security
    Smart 3D cameras are widely used in smart home security systems, offering facial recognition and motion detection for enhanced protection.

Smart 3D Cameras Market Regional Analysis :

semi insight

  • North America:

    Strong demand driven by EVs, 5G infrastructure, and renewable energy, with the U.S. leading the market.

  • Europe:

    Growth fueled by automotive electrification, renewable energy, and strong regulatory support, with Germany as a key player.

  • Asia-Pacific:

    Dominates the market due to large-scale manufacturing in China and Japan, with growing demand from EVs, 5G, and semiconductors.

  • South America:

    Emerging market, driven by renewable energy and EV adoption, with Brazil leading growth.

  • Middle East & Africa:

    Gradual growth, mainly due to investments in renewable energy and EV infrastructure, with Saudi Arabia and UAE as key contributors.

Smart 3D Cameras Market Segmentation :

The research report includes specific segments by region (country), manufacturers, Type, and Application. Market segmentation creates subsets of a market based on product type, end-user or application, Geographic, and other factors. By understanding the market segments, the decision-maker can leverage this targeting in the product, sales, and marketing strategies. Market segments can power your product development cycles by informing how you create product offerings for different segments.
Key Company

  • Stemmer Imaging
  • Basler
  • HP
  • Nikon
  • Cannon
  • Sony
  • Panasonic
  • Fujifilm
  • GoPro
  • Kodak
  • LG
  • Samsung
  • Sharp
  • Microsoft
  • Infineon Technologies
Market Segmentation (by Type)
  • Binocular Stereo Vision
  • Time of Flight
  • Structured Light
Market Segmentation (by Application)
  • Electronic Products
  • Automotive Industry
  • Smart Home Appliances
  • Others

Market Drivers

  • Growing Demand for 3D Imaging in Consumer Electronics
    Increasing adoption of 3D cameras in smartphones, laptops, and VR/AR devices is fueling market growth.
  • Advancements in AI and Machine Learning
    AI-driven 3D image analysis is boosting applications in automation, healthcare, and security industries.
  • Increased Investment in Automotive and Robotics
    Automakers and robotics firms are integrating 3D cameras for automation, safety, and improved operational efficiency.

Market Restraints

  • High Cost of Smart 3D Camera Technology
    Advanced 3D cameras require expensive components, making them less affordable for small businesses and consumers.
  • Technical Challenges in Accuracy and Calibration
    Issues like image distortion, accuracy in low-light conditions, and complex calibration processes can hinder adoption.
  • Privacy and Security Concerns
    The use of 3D cameras in surveillance and facial recognition raises ethical and regulatory concerns.

Market Opportunities

  • Growing AR/VR and Gaming Industry
    The expanding virtual and augmented reality market presents significant opportunities for smart 3D camera adoption.
  • Rising Demand in Healthcare and Medical Imaging
    3D cameras are being increasingly used for advanced diagnostics, surgeries, and rehabilitation treatments.
  • Smart City and Security Applications
    Governments worldwide are investing in smart surveillance and security systems, creating a favorable market environment.

Market Challenges

  • Complexity in Integration with Existing Systems
    Many industries face difficulties in integrating 3D camera technology with their current infrastructure.
  • Limited Awareness in Emerging Markets
    Developing regions have lower adoption due to a lack of awareness and high initial investment.
  • Competition from Alternative Imaging Technologies
    Traditional cameras, LiDAR, and other imaging solutions pose competitive challenges to 3D cameras.

Key Benefits of This Market Research:

  • Industry drivers, restraints, and opportunities covered in the study
  • Neutral perspective on the market performance
  • Recent industry trends and developments
  • Competitive landscape & strategies of key players
  • Potential & niche segments and regions exhibiting promising growth covered
  • Historical, current, and projected market size, in terms of value
  • In-depth analysis of the Smart 3D Cameras Market
  • Overview of the regional outlook of the Smart 3D Cameras Market:

Key Reasons to Buy this Report:

  • Access to date statistics compiled by our researchers. These provide you with historical and forecast data, which is analyzed to tell you why your market is set to change
  • This enables you to anticipate market changes to remain ahead of your competitors
  • You will be able to copy data from the Excel spreadsheet straight into your marketing plans, business presentations, or other strategic documents
  • The concise analysis, clear graph, and table format will enable you to pinpoint the information you require quickly
  • Provision of market value (USD Billion) data for each segment and sub-segment
  • Indicates the region and segment that is expected to witness the fastest growth as well as to dominate the market
  • Provides insight into the market through Value Chain
  • Market dynamics scenario, along with growth opportunities of the market in the years to come
  • 6-month post-sales analyst support

Customization of the Report
In case of any queries or customization requirements, please connect with our sales team, who will ensure that your requirements are met.


FAQs

Q: What are the key driving factors and opportunities in the Smart 3D Cameras market?
A: The major drivers include the growing demand for 3D imaging in consumer electronics, AI advancements, and increased use in automotive and robotics. Opportunities exist in AR/VR, healthcare, and security applications.


Q: Which region is projected to have the largest market share?
A: North America is expected to lead the market due to technological advancements, followed by the Asia-Pacific region, which is experiencing rapid industrial growth.


Q: Who are the top players in the global Smart 3D Cameras market?
A: Leading companies include Sony, Nikon, Panasonic, Microsoft, Samsung, Canon, Fujifilm, HP, Infineon Technologies, and Basler.


Q: What are the latest technological advancements in the industry?
A: Advancements include AI-powered 3D image processing, improved ToF sensors, enhanced facial recognition, and integration with IoT for real-time analytics.


Q: What is the current size of the global Smart 3D Cameras market?
A: The market was valued at USD 1837 million in 2023 and is projected to reach USD 3423.34 million by 2030, growing at a CAGR of 9.30%.

Smart 3D Cameras Market, Size, Trends, Business Strategies 2025-2032

Get Sample Report PDF for Exclusive Insights

Report Sample Includes

  • Table of Contents
  • List of Tables & Figures
  • Charts, Research Methodology, and more...
PDF Icon Download Sample Report PDF

Download Sample Report

Table of Content

Table of Contents
1 Research Methodology and Statistical Scope
1.1 Market Definition and Statistical Scope of Smart 3D Cameras
1.2 Key Market Segments
1.2.1 Smart 3D Cameras Segment by Type
1.2.2 Smart 3D Cameras Segment by Application
1.3 Methodology & Sources of Information
1.3.1 Research Methodology
1.3.2 Research Process
1.3.3 Market Breakdown and Data Triangulation
1.3.4 Base Year
1.3.5 Report Assumptions & Caveats
2 Smart 3D Cameras Market Overview
2.1 Global Market Overview
2.1.1 Global Smart 3D Cameras Market Size (M USD) Estimates and Forecasts (2019-2030)
2.1.2 Global Smart 3D Cameras Sales Estimates and Forecasts (2019-2030)
2.2 Market Segment Executive Summary
2.3 Global Market Size by Region
3 Smart 3D Cameras Market Competitive Landscape
3.1 Global Smart 3D Cameras Sales by Manufacturers (2019-2025)
3.2 Global Smart 3D Cameras Revenue Market Share by Manufacturers (2019-2025)
3.3 Smart 3D Cameras Market Share by Company Type (Tier 1, Tier 2, and Tier 3)
3.4 Global Smart 3D Cameras Average Price by Manufacturers (2019-2025)
3.5 Manufacturers Smart 3D Cameras Sales Sites, Area Served, Product Type
3.6 Smart 3D Cameras Market Competitive Situation and Trends
3.6.1 Smart 3D Cameras Market Concentration Rate
3.6.2 Global 5 and 10 Largest Smart 3D Cameras Players Market Share by Revenue
3.6.3 Mergers & Acquisitions, Expansion
4 Smart 3D Cameras Industry Chain Analysis
4.1 Smart 3D Cameras Industry Chain Analysis
4.2 Market Overview of Key Raw Materials
4.3 Midstream Market Analysis
4.4 Downstream Customer Analysis
5 The Development and Dynamics of Smart 3D Cameras Market
5.1 Key Development Trends
5.2 Driving Factors
5.3 Market Challenges
5.4 Market Restraints
5.5 Industry News
5.5.1 New Product Developments
5.5.2 Mergers & Acquisitions
5.5.3 Expansions
5.5.4 Collaboration/Supply Contracts
5.6 Industry Policies
6 Smart 3D Cameras Market Segmentation by Type
6.1 Evaluation Matrix of Segment Market Development Potential (Type)
6.2 Global Smart 3D Cameras Sales Market Share by Type (2019-2025)
6.3 Global Smart 3D Cameras Market Size Market Share by Type (2019-2025)
6.4 Global Smart 3D Cameras Price by Type (2019-2025)
7 Smart 3D Cameras Market Segmentation by Application
7.1 Evaluation Matrix of Segment Market Development Potential (Application)
7.2 Global Smart 3D Cameras Market Sales by Application (2019-2025)
7.3 Global Smart 3D Cameras Market Size (M USD) by Application (2019-2025)
7.4 Global Smart 3D Cameras Sales Growth Rate by Application (2019-2025)
8 Smart 3D Cameras Market Segmentation by Region
8.1 Global Smart 3D Cameras Sales by Region
8.1.1 Global Smart 3D Cameras Sales by Region
8.1.2 Global Smart 3D Cameras Sales Market Share by Region
8.2 North America
8.2.1 North America Smart 3D Cameras Sales by Country
8.2.2 U.S.
8.2.3 Canada
8.2.4 Mexico
8.3 Europe
8.3.1 Europe Smart 3D Cameras Sales by Country
8.3.2 Germany
8.3.3 France
8.3.4 U.K.
8.3.5 Italy
8.3.6 Russia
8.4 Asia Pacific
8.4.1 Asia Pacific Smart 3D Cameras Sales by Region
8.4.2 China
8.4.3 Japan
8.4.4 South Korea
8.4.5 India
8.4.6 Southeast Asia
8.5 South America
8.5.1 South America Smart 3D Cameras Sales by Country
8.5.2 Brazil
8.5.3 Argentina
8.5.4 Columbia
8.6 Middle East and Africa
8.6.1 Middle East and Africa Smart 3D Cameras Sales by Region
8.6.2 Saudi Arabia
8.6.3 UAE
8.6.4 Egypt
8.6.5 Nigeria
8.6.6 South Africa
9 Key Companies Profile
9.1 Stemmer Imaging
9.1.1 Stemmer Imaging Smart 3D Cameras Basic Information
9.1.2 Stemmer Imaging Smart 3D Cameras Product Overview
9.1.3 Stemmer Imaging Smart 3D Cameras Product Market Performance
9.1.4 Stemmer Imaging Business Overview
9.1.5 Stemmer Imaging Smart 3D Cameras SWOT Analysis
9.1.6 Stemmer Imaging Recent Developments
9.2 Basler
9.2.1 Basler Smart 3D Cameras Basic Information
9.2.2 Basler Smart 3D Cameras Product Overview
9.2.3 Basler Smart 3D Cameras Product Market Performance
9.2.4 Basler Business Overview
9.2.5 Basler Smart 3D Cameras SWOT Analysis
9.2.6 Basler Recent Developments
9.3 HP
9.3.1 HP Smart 3D Cameras Basic Information
9.3.2 HP Smart 3D Cameras Product Overview
9.3.3 HP Smart 3D Cameras Product Market Performance
9.3.4 HP Smart 3D Cameras SWOT Analysis
9.3.5 HP Business Overview
9.3.6 HP Recent Developments
9.4 Nikon
9.4.1 Nikon Smart 3D Cameras Basic Information
9.4.2 Nikon Smart 3D Cameras Product Overview
9.4.3 Nikon Smart 3D Cameras Product Market Performance
9.4.4 Nikon Business Overview
9.4.5 Nikon Recent Developments
9.5 Cannon
9.5.1 Cannon Smart 3D Cameras Basic Information
9.5.2 Cannon Smart 3D Cameras Product Overview
9.5.3 Cannon Smart 3D Cameras Product Market Performance
9.5.4 Cannon Business Overview
9.5.5 Cannon Recent Developments
9.6 Sony
9.6.1 Sony Smart 3D Cameras Basic Information
9.6.2 Sony Smart 3D Cameras Product Overview
9.6.3 Sony Smart 3D Cameras Product Market Performance
9.6.4 Sony Business Overview
9.6.5 Sony Recent Developments
9.7 Panasonic
9.7.1 Panasonic Smart 3D Cameras Basic Information
9.7.2 Panasonic Smart 3D Cameras Product Overview
9.7.3 Panasonic Smart 3D Cameras Product Market Performance
9.7.4 Panasonic Business Overview
9.7.5 Panasonic Recent Developments
9.8 Fujifilm
9.8.1 Fujifilm Smart 3D Cameras Basic Information
9.8.2 Fujifilm Smart 3D Cameras Product Overview
9.8.3 Fujifilm Smart 3D Cameras Product Market Performance
9.8.4 Fujifilm Business Overview
9.8.5 Fujifilm Recent Developments
9.9 GoPro
9.9.1 GoPro Smart 3D Cameras Basic Information
9.9.2 GoPro Smart 3D Cameras Product Overview
9.9.3 GoPro Smart 3D Cameras Product Market Performance
9.9.4 GoPro Business Overview
9.9.5 GoPro Recent Developments
9.10 Kodak
9.10.1 Kodak Smart 3D Cameras Basic Information
9.10.2 Kodak Smart 3D Cameras Product Overview
9.10.3 Kodak Smart 3D Cameras Product Market Performance
9.10.4 Kodak Business Overview
9.10.5 Kodak Recent Developments
9.11 LG
9.11.1 LG Smart 3D Cameras Basic Information
9.11.2 LG Smart 3D Cameras Product Overview
9.11.3 LG Smart 3D Cameras Product Market Performance
9.11.4 LG Business Overview
9.11.5 LG Recent Developments
9.12 Samsung
9.12.1 Samsung Smart 3D Cameras Basic Information
9.12.2 Samsung Smart 3D Cameras Product Overview
9.12.3 Samsung Smart 3D Cameras Product Market Performance
9.12.4 Samsung Business Overview
9.12.5 Samsung Recent Developments
9.13 Sharp
9.13.1 Sharp Smart 3D Cameras Basic Information
9.13.2 Sharp Smart 3D Cameras Product Overview
9.13.3 Sharp Smart 3D Cameras Product Market Performance
9.13.4 Sharp Business Overview
9.13.5 Sharp Recent Developments
9.14 Microsoft
9.14.1 Microsoft Smart 3D Cameras Basic Information
9.14.2 Microsoft Smart 3D Cameras Product Overview
9.14.3 Microsoft Smart 3D Cameras Product Market Performance
9.14.4 Microsoft Business Overview
9.14.5 Microsoft Recent Developments
9.15 Infineon Technologies
9.15.1 Infineon Technologies Smart 3D Cameras Basic Information
9.15.2 Infineon Technologies Smart 3D Cameras Product Overview
9.15.3 Infineon Technologies Smart 3D Cameras Product Market Performance
9.15.4 Infineon Technologies Business Overview
9.15.5 Infineon Technologies Recent Developments
10 Smart 3D Cameras Market Forecast by Region
10.1 Global Smart 3D Cameras Market Size Forecast
10.2 Global Smart 3D Cameras Market Forecast by Region
10.2.1 North America Market Size Forecast by Country
10.2.2 Europe Smart 3D Cameras Market Size Forecast by Country
10.2.3 Asia Pacific Smart 3D Cameras Market Size Forecast by Region
10.2.4 South America Smart 3D Cameras Market Size Forecast by Country
10.2.5 Middle East and Africa Forecasted Consumption of Smart 3D Cameras by Country
11 Forecast Market by Type and by Application (2025-2030)
11.1 Global Smart 3D Cameras Market Forecast by Type (2025-2030)
11.1.1 Global Forecasted Sales of Smart 3D Cameras by Type (2025-2030)
11.1.2 Global Smart 3D Cameras Market Size Forecast by Type (2025-2030)
11.1.3 Global Forecasted Price of Smart 3D Cameras by Type (2025-2030)
11.2 Global Smart 3D Cameras Market Forecast by Application (2025-2030)
11.2.1 Global Smart 3D Cameras Sales (K Units) Forecast by Application
11.2.2 Global Smart 3D Cameras Market Size (M USD) Forecast by Application (2025-2030)
12 Conclusion and Key FindingsList of Tables
Table 1. Introduction of the Type
Table 2. Introduction of the Application
Table 3. Market Size (M USD) Segment Executive Summary
Table 4. Smart 3D Cameras Market Size Comparison by Region (M USD)
Table 5. Global Smart 3D Cameras Sales (K Units) by Manufacturers (2019-2025)
Table 6. Global Smart 3D Cameras Sales Market Share by Manufacturers (2019-2025)
Table 7. Global Smart 3D Cameras Revenue (M USD) by Manufacturers (2019-2025)
Table 8. Global Smart 3D Cameras Revenue Share by Manufacturers (2019-2025)
Table 9. Company Type (Tier 1, Tier 2, and Tier 3) & (based on the Revenue in Smart 3D Cameras as of 2022)
Table 10. Global Market Smart 3D Cameras Average Price (USD/Unit) of Key Manufacturers (2019-2025)
Table 11. Manufacturers Smart 3D Cameras Sales Sites and Area Served
Table 12. Manufacturers Smart 3D Cameras Product Type
Table 13. Global Smart 3D Cameras Manufacturers Market Concentration Ratio (CR5 and HHI)
Table 14. Mergers & Acquisitions, Expansion Plans
Table 15. Industry Chain Map of Smart 3D Cameras
Table 16. Market Overview of Key Raw Materials
Table 17. Midstream Market Analysis
Table 18. Downstream Customer Analysis
Table 19. Key Development Trends
Table 20. Driving Factors
Table 21. Smart 3D Cameras Market Challenges
Table 22. Global Smart 3D Cameras Sales by Type (K Units)
Table 23. Global Smart 3D Cameras Market Size by Type (M USD)
Table 24. Global Smart 3D Cameras Sales (K Units) by Type (2019-2025)
Table 25. Global Smart 3D Cameras Sales Market Share by Type (2019-2025)
Table 26. Global Smart 3D Cameras Market Size (M USD) by Type (2019-2025)
Table 27. Global Smart 3D Cameras Market Size Share by Type (2019-2025)
Table 28. Global Smart 3D Cameras Price (USD/Unit) by Type (2019-2025)
Table 29. Global Smart 3D Cameras Sales (K Units) by Application
Table 30. Global Smart 3D Cameras Market Size by Application
Table 31. Global Smart 3D Cameras Sales by Application (2019-2025) & (K Units)
Table 32. Global Smart 3D Cameras Sales Market Share by Application (2019-2025)
Table 33. Global Smart 3D Cameras Sales by Application (2019-2025) & (M USD)
Table 34. Global Smart 3D Cameras Market Share by Application (2019-2025)
Table 35. Global Smart 3D Cameras Sales Growth Rate by Application (2019-2025)
Table 36. Global Smart 3D Cameras Sales by Region (2019-2025) & (K Units)
Table 37. Global Smart 3D Cameras Sales Market Share by Region (2019-2025)
Table 38. North America Smart 3D Cameras Sales by Country (2019-2025) & (K Units)
Table 39. Europe Smart 3D Cameras Sales by Country (2019-2025) & (K Units)
Table 40. Asia Pacific Smart 3D Cameras Sales by Region (2019-2025) & (K Units)
Table 41. South America Smart 3D Cameras Sales by Country (2019-2025) & (K Units)
Table 42. Middle East and Africa Smart 3D Cameras Sales by Region (2019-2025) & (K Units)
Table 43. Stemmer Imaging Smart 3D Cameras Basic Information
Table 44. Stemmer Imaging Smart 3D Cameras Product Overview
Table 45. Stemmer Imaging Smart 3D Cameras Sales (K Units), Revenue (M USD), Price (USD/Unit) and Gross Margin (2019-2025)
Table 46. Stemmer Imaging Business Overview
Table 47. Stemmer Imaging Smart 3D Cameras SWOT Analysis
Table 48. Stemmer Imaging Recent Developments
Table 49. Basler Smart 3D Cameras Basic Information
Table 50. Basler Smart 3D Cameras Product Overview
Table 51. Basler Smart 3D Cameras Sales (K Units), Revenue (M USD), Price (USD/Unit) and Gross Margin (2019-2025)
Table 52. Basler Business Overview
Table 53. Basler Smart 3D Cameras SWOT Analysis
Table 54. Basler Recent Developments
Table 55. HP Smart 3D Cameras Basic Information
Table 56. HP Smart 3D Cameras Product Overview
Table 57. HP Smart 3D Cameras Sales (K Units), Revenue (M USD), Price (USD/Unit) and Gross Margin (2019-2025)
Table 58. HP Smart 3D Cameras SWOT Analysis
Table 59. HP Business Overview
Table 60. HP Recent Developments
Table 61. Nikon Smart 3D Cameras Basic Information
Table 62. Nikon Smart 3D Cameras Product Overview
Table 63. Nikon Smart 3D Cameras Sales (K Units), Revenue (M USD), Price (USD/Unit) and Gross Margin (2019-2025)
Table 64. Nikon Business Overview
Table 65. Nikon Recent Developments
Table 66. Cannon Smart 3D Cameras Basic Information
Table 67. Cannon Smart 3D Cameras Product Overview
Table 68. Cannon Smart 3D Cameras Sales (K Units), Revenue (M USD), Price (USD/Unit) and Gross Margin (2019-2025)
Table 69. Cannon Business Overview
Table 70. Cannon Recent Developments
Table 71. Sony Smart 3D Cameras Basic Information
Table 72. Sony Smart 3D Cameras Product Overview
Table 73. Sony Smart 3D Cameras Sales (K Units), Revenue (M USD), Price (USD/Unit) and Gross Margin (2019-2025)
Table 74. Sony Business Overview
Table 75. Sony Recent Developments
Table 76. Panasonic Smart 3D Cameras Basic Information
Table 77. Panasonic Smart 3D Cameras Product Overview
Table 78. Panasonic Smart 3D Cameras Sales (K Units), Revenue (M USD), Price (USD/Unit) and Gross Margin (2019-2025)
Table 79. Panasonic Business Overview
Table 80. Panasonic Recent Developments
Table 81. Fujifilm Smart 3D Cameras Basic Information
Table 82. Fujifilm Smart 3D Cameras Product Overview
Table 83. Fujifilm Smart 3D Cameras Sales (K Units), Revenue (M USD), Price (USD/Unit) and Gross Margin (2019-2025)
Table 84. Fujifilm Business Overview
Table 85. Fujifilm Recent Developments
Table 86. GoPro Smart 3D Cameras Basic Information
Table 87. GoPro Smart 3D Cameras Product Overview
Table 88. GoPro Smart 3D Cameras Sales (K Units), Revenue (M USD), Price (USD/Unit) and Gross Margin (2019-2025)
Table 89. GoPro Business Overview
Table 90. GoPro Recent Developments
Table 91. Kodak Smart 3D Cameras Basic Information
Table 92. Kodak Smart 3D Cameras Product Overview
Table 93. Kodak Smart 3D Cameras Sales (K Units), Revenue (M USD), Price (USD/Unit) and Gross Margin (2019-2025)
Table 94. Kodak Business Overview
Table 95. Kodak Recent Developments
Table 96. LG Smart 3D Cameras Basic Information
Table 97. LG Smart 3D Cameras Product Overview
Table 98. LG Smart 3D Cameras Sales (K Units), Revenue (M USD), Price (USD/Unit) and Gross Margin (2019-2025)
Table 99. LG Business Overview
Table 100. LG Recent Developments
Table 101. Samsung Smart 3D Cameras Basic Information
Table 102. Samsung Smart 3D Cameras Product Overview
Table 103. Samsung Smart 3D Cameras Sales (K Units), Revenue (M USD), Price (USD/Unit) and Gross Margin (2019-2025)
Table 104. Samsung Business Overview
Table 105. Samsung Recent Developments
Table 106. Sharp Smart 3D Cameras Basic Information
Table 107. Sharp Smart 3D Cameras Product Overview
Table 108. Sharp Smart 3D Cameras Sales (K Units), Revenue (M USD), Price (USD/Unit) and Gross Margin (2019-2025)
Table 109. Sharp Business Overview
Table 110. Sharp Recent Developments
Table 111. Microsoft Smart 3D Cameras Basic Information
Table 112. Microsoft Smart 3D Cameras Product Overview
Table 113. Microsoft Smart 3D Cameras Sales (K Units), Revenue (M USD), Price (USD/Unit) and Gross Margin (2019-2025)
Table 114. Microsoft Business Overview
Table 115. Microsoft Recent Developments
Table 116. Infineon Technologies Smart 3D Cameras Basic Information
Table 117. Infineon Technologies Smart 3D Cameras Product Overview
Table 118. Infineon Technologies Smart 3D Cameras Sales (K Units), Revenue (M USD), Price (USD/Unit) and Gross Margin (2019-2025)
Table 119. Infineon Technologies Business Overview
Table 120. Infineon Technologies Recent Developments
Table 121. Global Smart 3D Cameras Sales Forecast by Region (2025-2030) & (K Units)
Table 122. Global Smart 3D Cameras Market Size Forecast by Region (2025-2030) & (M USD)
Table 123. North America Smart 3D Cameras Sales Forecast by Country (2025-2030) & (K Units)
Table 124. North America Smart 3D Cameras Market Size Forecast by Country (2025-2030) & (M USD)
Table 125. Europe Smart 3D Cameras Sales Forecast by Country (2025-2030) & (K Units)
Table 126. Europe Smart 3D Cameras Market Size Forecast by Country (2025-2030) & (M USD)
Table 127. Asia Pacific Smart 3D Cameras Sales Forecast by Region (2025-2030) & (K Units)
Table 128. Asia Pacific Smart 3D Cameras Market Size Forecast by Region (2025-2030) & (M USD)
Table 129. South America Smart 3D Cameras Sales Forecast by Country (2025-2030) & (K Units)
Table 130. South America Smart 3D Cameras Market Size Forecast by Country (2025-2030) & (M USD)
Table 131. Middle East and Africa Smart 3D Cameras Consumption Forecast by Country (2025-2030) & (Units)
Table 132. Middle East and Africa Smart 3D Cameras Market Size Forecast by Country (2025-2030) & (M USD)
Table 133. Global Smart 3D Cameras Sales Forecast by Type (2025-2030) & (K Units)
Table 134. Global Smart 3D Cameras Market Size Forecast by Type (2025-2030) & (M USD)
Table 135. Global Smart 3D Cameras Price Forecast by Type (2025-2030) & (USD/Unit)
Table 136. Global Smart 3D Cameras Sales (K Units) Forecast by Application (2025-2030)
Table 137. Global Smart 3D Cameras Market Size Forecast by Application (2025-2030) & (M USD)
List of Figures
Figure 1. Product Picture of Smart 3D Cameras
Figure 2. Data Triangulation
Figure 3. Key Caveats
Figure 4. Global Smart 3D Cameras Market Size (M USD), 2019-2030
Figure 5. Global Smart 3D Cameras Market Size (M USD) (2019-2030)
Figure 6. Global Smart 3D Cameras Sales (K Units) & (2019-2030)
Figure 7. Evaluation Matrix of Segment Market Development Potential (Type)
Figure 8. Evaluation Matrix of Segment Market Development Potential (Application)
Figure 9. Evaluation Matrix of Regional Market Development Potential
Figure 10. Smart 3D Cameras Market Size by Country (M USD)
Figure 11. Smart 3D Cameras Sales Share by Manufacturers in 2023
Figure 12. Global Smart 3D Cameras Revenue Share by Manufacturers in 2023
Figure 13. Smart 3D Cameras Market Share by Company Type (Tier 1, Tier 2 and Tier 3): 2023
Figure 14. Global Market Smart 3D Cameras Average Price (USD/Unit) of Key Manufacturers in 2023
Figure 15. The Global 5 and 10 Largest Players: Market Share by Smart 3D Cameras Revenue in 2023
Figure 16. Evaluation Matrix of Segment Market Development Potential (Type)
Figure 17. Global Smart 3D Cameras Market Share by Type
Figure 18. Sales Market Share of Smart 3D Cameras by Type (2019-2025)
Figure 19. Sales Market Share of Smart 3D Cameras by Type in 2023
Figure 20. Market Size Share of Smart 3D Cameras by Type (2019-2025)
Figure 21. Market Size Market Share of Smart 3D Cameras by Type in 2023
Figure 22. Evaluation Matrix of Segment Market Development Potential (Application)
Figure 23. Global Smart 3D Cameras Market Share by Application
Figure 24. Global Smart 3D Cameras Sales Market Share by Application (2019-2025)
Figure 25. Global Smart 3D Cameras Sales Market Share by Application in 2023
Figure 26. Global Smart 3D Cameras Market Share by Application (2019-2025)
Figure 27. Global Smart 3D Cameras Market Share by Application in 2023
Figure 28. Global Smart 3D Cameras Sales Growth Rate by Application (2019-2025)
Figure 29. Global Smart 3D Cameras Sales Market Share by Region (2019-2025)
Figure 30. North America Smart 3D Cameras Sales and Growth Rate (2019-2025) & (K Units)
Figure 31. North America Smart 3D Cameras Sales Market Share by Country in 2023
Figure 32. U.S. Smart 3D Cameras Sales and Growth Rate (2019-2025) & (K Units)
Figure 33. Canada Smart 3D Cameras Sales (K Units) and Growth Rate (2019-2025)
Figure 34. Mexico Smart 3D Cameras Sales (Units) and Growth Rate (2019-2025)
Figure 35. Europe Smart 3D Cameras Sales and Growth Rate (2019-2025) & (K Units)
Figure 36. Europe Smart 3D Cameras Sales Market Share by Country in 2023
Figure 37. Germany Smart 3D Cameras Sales and Growth Rate (2019-2025) & (K Units)
Figure 38. France Smart 3D Cameras Sales and Growth Rate (2019-2025) & (K Units)
Figure 39. U.K. Smart 3D Cameras Sales and Growth Rate (2019-2025) & (K Units)
Figure 40. Italy Smart 3D Cameras Sales and Growth Rate (2019-2025) & (K Units)
Figure 41. Russia Smart 3D Cameras Sales and Growth Rate (2019-2025) & (K Units)
Figure 42. Asia Pacific Smart 3D Cameras Sales and Growth Rate (K Units)
Figure 43. Asia Pacific Smart 3D Cameras Sales Market Share by Region in 2023
Figure 44. China Smart 3D Cameras Sales and Growth Rate (2019-2025) & (K Units)
Figure 45. Japan Smart 3D Cameras Sales and Growth Rate (2019-2025) & (K Units)
Figure 46. South Korea Smart 3D Cameras Sales and Growth Rate (2019-2025) & (K Units)
Figure 47. India Smart 3D Cameras Sales and Growth Rate (2019-2025) & (K Units)
Figure 48. Southeast Asia Smart 3D Cameras Sales and Growth Rate (2019-2025) & (K Units)
Figure 49. South America Smart 3D Cameras Sales and Growth Rate (K Units)
Figure 50. South America Smart 3D Cameras Sales Market Share by Country in 2023
Figure 51. Brazil Smart 3D Cameras Sales and Growth Rate (2019-2025) & (K Units)
Figure 52. Argentina Smart 3D Cameras Sales and Growth Rate (2019-2025) & (K Units)
Figure 53. Columbia Smart 3D Cameras Sales and Growth Rate (2019-2025) & (K Units)
Figure 54. Middle East and Africa Smart 3D Cameras Sales and Growth Rate (K Units)
Figure 55. Middle East and Africa Smart 3D Cameras Sales Market Share by Region in 2023
Figure 56. Saudi Arabia Smart 3D Cameras Sales and Growth Rate (2019-2025) & (K Units)
Figure 57. UAE Smart 3D Cameras Sales and Growth Rate (2019-2025) & (K Units)
Figure 58. Egypt Smart 3D Cameras Sales and Growth Rate (2019-2025) & (K Units)
Figure 59. Nigeria Smart 3D Cameras Sales and Growth Rate (2019-2025) & (K Units)
Figure 60. South Africa Smart 3D Cameras Sales and Growth Rate (2019-2025) & (K Units)
Figure 61. Global Smart 3D Cameras Sales Forecast by Volume (2019-2030) & (K Units)
Figure 62. Global Smart 3D Cameras Market Size Forecast by Value (2019-2030) & (M USD)
Figure 63. Global Smart 3D Cameras Sales Market Share Forecast by Type (2025-2030)
Figure 64. Global Smart 3D Cameras Market Share Forecast by Type (2025-2030)
Figure 65. Global Smart 3D Cameras Sales Forecast by Application (2025-2030)
Figure 66. Global Smart 3D Cameras Market Share Forecast by Application (2025-2030)