Sharp Cut Filters Market, Trends, Business Strategies 2026-2034

Sharp Cut Filters Market size was valued at USD 320 million in 2025. The market is projected to grow from USD 345 million in 2026 to USD 520 million by 2034, exhibiting a CAGR of 5.2% during the forecast period.

PDF Icon Download Sample Report PDF
  • Quick Dispatch

    All Orders

  • Secure Payment

    100% Secure Payment

Price range: $1,500.00 through $4,250.00

Clear

Market Insights

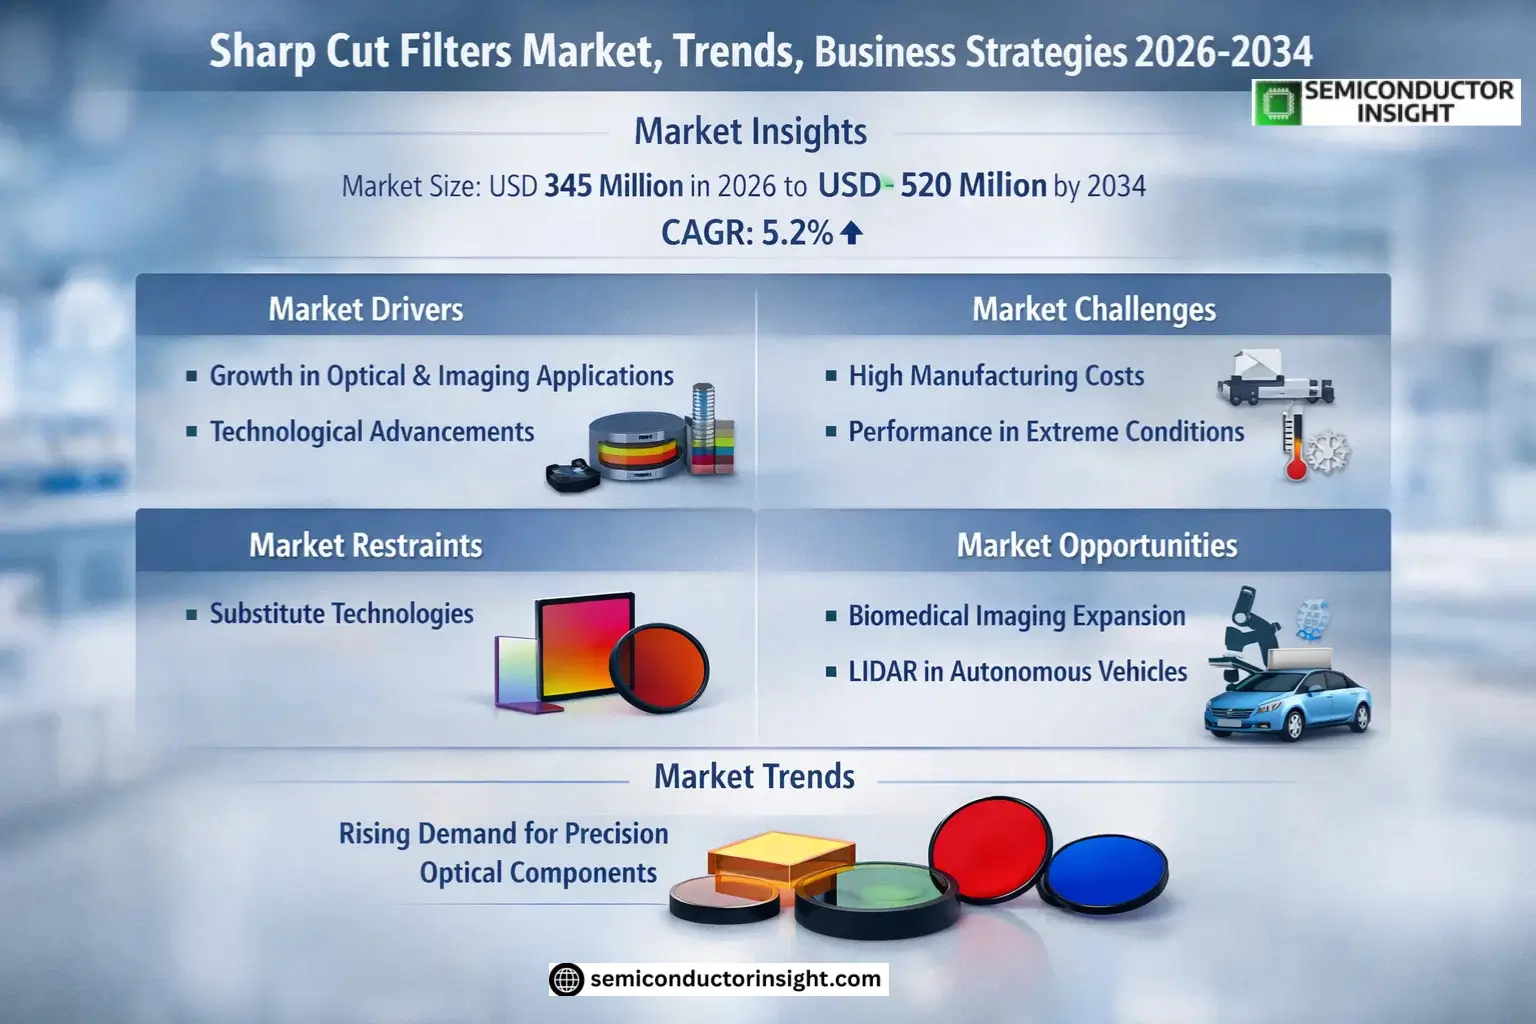
Global Sharp Cut Filters Market size was valued at USD 320 million in 2025. The market is projected to grow from USD 345 million in 2026 to USD 520 million by 2034, exhibiting a CAGR of 5.2% during the forecast period.

Sharp cut filters are optical filters designed to block light below a specific wavelength while transmitting light above that threshold, typically operating within the 350 nm to 800 nm range. These precision components are critical for applications requiring spectral purity, such as fluorescence microscopy, spectroscopy, and machine vision systems. The Y50 filter variant dominates product segmentation due to its widespread use in industrial and scientific imaging.

Market growth is driven by increasing demand for high-performance optical systems across medical diagnostics and semiconductor inspection applications. However, supply chain constraints for specialized glass substrates present ongoing challenges. Leading manufacturers like Hoya Optics and SURUGA SEIKI continue to innovate with multi-layer coating technologies that enhance filter performance while reducing thickness.
Sharp Cut Filters Market Trends

MARKET DRIVERS

Growing Demand in Optical and Imaging Applications

Sharp Cut Filters Market is experiencing robust growth due to increasing adoption in optical instruments, cameras, and medical imaging devices. These filters effectively block unwanted wavelengths while allowing precise light transmission, making them indispensable in high-precision applications. Global imaging market’s expansion, projected to grow at 6.8% annually, directly fuels demand for Sharp Cut Filters.

Technological Advancements in Filter Design

Recent breakthroughs in thin-film coating technologies have enhanced the performance of Sharp Cut Filters, enabling sharper transition edges and improved durability. Manufacturers are investing heavily in R&D to develop filters with superior optical density and thermal stability, catering to emerging requirements in aerospace and defense sectors.

Stringent quality requirements in industrial automation and machine vision systems are further accelerating market growth, as these applications demand filters with precise cutoff characteristics and minimal wavelength drift.

MARKET CHALLENGES

High Manufacturing Precision Requirements

Producing Sharp Cut Filters with exact wavelength specifications requires specialized equipment and controlled environments, resulting in high production costs. The need for nanometer-level precision in coating thickness creates significant technical barriers for new market entrants.

Other Challenges

Performance Limitations in Extreme Conditions
Maintaining filter performance under high-temperature or high-humidity conditions remains a persistent challenge, particularly for outdoor and industrial applications where environmental stability is critical.

MARKET RESTRAINTS

Substitute Technologies in Certain Applications

The emergence of tunable optical filters and digital filtering techniques has created competitive pressure on traditional Sharp Cut Filters in some application areas. While these alternatives offer flexibility, they cannot match the reliability and cost-effectiveness of Sharp Cut Filters for many critical applications.

MARKET OPPORTUNITIES

Expansion in Biomedical Imaging Systems

The growing adoption of Sharp Cut Filters in fluorescence microscopy and diagnostic equipment presents significant growth opportunities. Advancements in life sciences research and increasing healthcare expenditure worldwide are driving demand for high-performance optical filters with precise wavelength selectivity.

Emerging Applications in Autonomous Vehicles

LIDAR systems in self-driving cars require Sharp Cut Filters to enhance signal-to-noise ratios by eliminating ambient light interference. The rapid development of autonomous vehicle technology is creating new revenue streams for filter manufacturers capable of meeting automotive-grade durability requirements.

Sharp Cut Filters Market Trends
Increasing Demand for Precision Optical Components

Sharp Cut Filters Market is experiencing steady growth due to rising demand for high-precision optical components across multiple industries. These filters, which precisely transmit light above specific wavelengths while blocking shorter wavelengths, are becoming essential in medical imaging and advanced camera systems. Manufacturers are focusing on improving filter performance in the 350 nm to 800 nm range to meet stringent industry requirements.

Other Trends

Technological Advancements in Filter Design

Leading manufacturers like Hoya Optics and SURUGA SEIKI are investing in new coating technologies to enhance the performance characteristics of Sharp Cut Filters. These innovations are particularly important for applications requiring extreme precision, such as semiconductor inspection equipment and scientific instrumentation.

Regional Market Growth Patterns

Asia-Pacific is emerging as a key growth region for Sharp Cut Filters, driven by expanding electronics manufacturing in China and Japan. North America maintains strong demand from medical equipment manufacturers, while Europe sees steady adoption in industrial automation applications.

Competitive Landscape Evolution

Sharp Cut Filters Market remains concentrated among major players, with the top five companies holding significant market share. Companies are increasingly differentiating through specialized filter solutions for niche applications, with the Y50 segment showing particular promise for future growth in camera applications.

Application-Specific Filter Development

Manufacturers are developing application-specific Sharp Cut Filters, with particular focus on medical imaging systems and industrial inspection equipment. This trend is driving innovation in filter durability and transmission characteristics, with customized solutions becoming increasingly common for specialized end-use cases.

COMPETITIVE LANDSCAPE

Key Industry Players

Global Sharp Cut Filters Market Dominated by Optical Component Specialists

Global Sharp Cut Filters Market is characterized by the dominance of specialized optical component manufacturers, with Hoya Optics leading the competitive landscape. In 2025, the top five players collectively accounted for a significant revenue share, reflecting the concentrated nature of this technologically advanced sector. These filters find primary applications in high-precision imaging systems for cameras and medical equipment, demanding stringent quality standards from manufacturers.

Beyond the market leaders, several niche players have carved out specialized positions through advanced coating technologies and customized filter solutions. Regional manufacturers serve local markets with cost-effective alternatives while maintaining quality benchmarks. The competitive environment is intensifying with increasing R&D investments aimed at improving transmission efficiency and expanding wavelength coverage capabilities.

List of Key Sharp Cut Filters Companies Profiled

Segment Analysis:

Segment Category Sub-Segments Key Insights
By Type
  • Y50
  • L37
  • O56
  • R62
Y50 Filters

  • Dominates due to superior light transmission performance in critical wavelength ranges
  • Preferred for high-precision imaging applications requiring sharp spectral separation
  • Widely adopted across professional photography and scientific instrumentation
By Application
  • Camera
  • Medical Equipment
  • Industrial Imaging
  • Scientific Research
Medical Equipment

  • Critical for diagnostic imaging systems requiring precise wavelength control
  • Growing adoption in endoscopy and microscopy applications
  • Increasing demand for specialized filters in advanced medical laser systems
By End User
  • Healthcare Institutions
  • Manufacturing Companies
  • Research Laboratories
  • Photography Professionals
Research Laboratories

  • Heavy adoption in spectroscopy and fluorescence microscopy applications
  • Require customized filters for specialized experimental setups
  • Constant demand for high-precision filters with superior optical performance
By Filter Technology
  • Absorption Filters
  • Dichroic Filters
  • Interference Filters
Interference Filters

  • Preferred for applications requiring steep cut-off characteristics
  • Superior optical performance with minimal light scattering
  • Increasing adoption in high-end scientific and medical applications
By Wavelength Range
  • UV-Visible (350-450nm)
  • Visible (450-700nm)
  • Near-IR (700-800nm)
Visible Range Filters

  • Most widely used across commercial and industrial applications
  • Essential for color separation in digital imaging systems
  • Constant innovation in coating technologies for improved performance

Regional Analysis: Global Sharp Cut Filters Market

Asia-Pacific

The Asia-Pacific region dominates the Sharp Cut Filters Market, driven by robust semiconductor manufacturing in South Korea and Taiwan, alongside growing optoelectronics production in China and Japan. Local manufacturers benefit from established supply chains for optical materials and government incentives supporting precision component manufacturing. The region’s leadership stems from concentrated R&D investments in photonics technologies from both private enterprises and academic institutions. Emerging applications in smartphone camera modules and medical imaging devices are creating sustained demand. While China maintains cost advantages in production, Japan leads in high-precision filter technologies for scientific applications. Regional competition is intensifying as Vietnamese and Indian manufacturers enter the mid-range filter segment.

Manufacturing Ecosystem
Asia-Pacific hosts vertically integrated production facilities combining glass substrate manufacturing with coating technologies, enabling competitive pricing for sharp cut filters. Clusters in Osaka and Shenzhen specialize in different filter categories.
Technology Leadership
Japanese firms maintain technological edge in ultra-narrow band filters, while Chinese manufacturers excel in cost-effective multi-layer designs. South Korea leads in filters for display applications requiring precise wavelength selectivity.
End-User Industries
Semiconductor inspection tools consume 38% of regional production, followed by medical imaging systems. Emerging demand comes from machine vision systems in smart factories across the region’s manufacturing hubs.
Regulatory Environment
Japan and South Korea enforce strict optical performance standards, pushing filter quality. China’s Made in China 2025 initiative includes subsidies for advanced optical component development, including sharp cut filters.

North America
The North American Sharp Cut Filters Market benefits from strong demand in defense and aerospace applications, particularly for hyperspectral imaging systems. U.S.-based manufacturers focus on high-performance filters for scientific instrumentation and space applications. The region sees increasing adoption in biomedical research equipment, with universities and pharmaceutical companies driving specifications. Local production faces challenges from Asian imports in consumer applications, but maintains leadership in custom-designed filters for specialized uses. Collaborative developments between filter manufacturers and end-users are common, particularly in the Boston and Silicon Valley tech corridors.

Europe
European demand for sharp cut filters centers on industrial automation and automotive LiDAR systems. German manufacturers lead in precision filters for machine vision, while French companies specialize in artistic and cinematographic applications. The region shows growing interest in environmentally sustainable filter manufacturing processes. Medical technology applications, particularly in diagnostic equipment, represent a stable demand sector. European Union research grants continue to support developments in next-generation optical filtration technologies through public-private partnerships.

Middle East & Africa
This emerging market for sharp cut filters shows particular growth in oil & gas sensing applications and security surveillance systems. UAE-based companies are investing in local filter coating facilities to reduce import dependence. The region’s harsh environmental conditions drive demand for durable filters with stable performance in extreme temperatures. Partnerships with European and Asian suppliers are helping build technical capabilities in optical component manufacturing across the GCC countries.

South America
Brazil dominates the regional sharp cut filter market, with applications primarily in agricultural sensing and mining equipment. Local manufacturing remains limited, with most filters imported from Asia and North America. Growing investments in scientific infrastructure are creating new demand for high-end optical filters in research institutions. The region shows potential for growth in medical imaging applications as healthcare modernization programs expand.

Report Scope

This market research report provides a comprehensive analysis of the Sharp Cut Filters Market, covering the forecast period 2025–2034. It offers detailed insights into market dynamics, technological advancements, competitive landscape, and key trends shaping the industry.

Key focus areas of the report include:

  • Market Overview: The report begins with an overview outlining its current market scenario, key growth indicators, and industry transformation drivers. It discusses macroeconomic factors, demand–supply balance, regulatory landscape, and the strategic role of sharp cut filters in applications such as cameras, medical equipment, and others.
  • Market Size & Forecast: Historical data and future projections for revenue, unit shipments, and market value across major regions and segments.
  • Segmentation Analysis: Detailed breakdown by product type (Y50, L37, O56, R62), application (Camera, Medical Equipment, Others), and end-user industry.
  • Regional Insights: Insights into market performance across North America, Europe, Asia, South America, and Middle East & Africa, including country-level analysis.
  • Competitive Landscape: Profiles of leading market participants, including their product offerings, manufacturing capacity, pricing strategies, and recent developments.
  • Technology Trends & Innovation: Assessment of emerging technologies and evolving industry standards in optical filtering.
  • Market Drivers & Restraints: Evaluation of factors driving market growth along with challenges, supply chain constraints, and regulatory issues.
  • Stakeholder Insights: Strategic insights for manufacturers, suppliers, distributors, and investors in the Sharp Cut Filters ecosystem.

Primary and secondary research methods are employed, including interviews with industry experts and data from verified sources to ensure accuracy and reliability.

FREQUENTLY ASKED QUESTIONS:

What is the current market size of Sharp Cut Filters Market?

-> Sharp Cut Filters Market size was valued at USD 320 million in 2025. The market is projected to grow from USD 345 million in 2026 to USD 520 million by 2034, exhibiting a CAGR of 5.2% during the forecast period.

What is the CAGR of Sharp Cut Filters Market?

-> The market is projected to grow at a CAGR of % during 2025-2034.

Which key companies operate in Sharp Cut Filters Market?

-> Key players include Hoya Optics, SURUGA SEIKI, Valley Design, Pyramid Imaging, Inc., and MidOpt, which collectively held approximately % market share in 2025.

What are the key product segments?

-> Key segments include Y50, L37, O56, and R62, with Y50 expected to reach USD million by 2034.

Which region dominates the market?

-> The U.S. market was valued at USD million in 2025, while China is expected to reach USD million during the forecast period.

Sharp Cut Filters Market, Trends, Business Strategies 2026-2034

Get Sample Report PDF for Exclusive Insights

Report Sample Includes

  • Table of Contents
  • List of Tables & Figures
  • Charts, Research Methodology, and more...
PDF Icon Download Sample Report PDF
SKU: 30229d3e9f01
Category:
License Type

Corporate License, Excel License, PDF and Excel Databook License

Download Sample Report

Table of Content

1 Introduction to Research & Analysis Reports
1.1 Sharp Cut Filters Market Definition
1.2 Market Segments
1.2.1 Segment by Type
1.2.2 Segment by Application
1.3 Global Sharp Cut Filters Market Overview
1.4 Features & Benefits of This Report
1.5 Methodology & Sources of Information
1.5.1 Research Methodology
1.5.2 Research Process
1.5.3 Base Year
1.5.4 Report Assumptions & Caveats
2 Global Sharp Cut Filters Overall Market Size
2.1 Global Sharp Cut Filters Market Size: 2025 VS 2034
2.2 Global Sharp Cut Filters Market Size, Prospects & Forecasts: 2021-2034
2.3 Global Sharp Cut Filters Sales: 2021-2034
3 Company Landscape
3.1 Top Sharp Cut Filters Players in Global Market
3.2 Top Global Sharp Cut Filters Companies Ranked by Revenue
3.3 Global Sharp Cut Filters Revenue by Companies
3.4 Global Sharp Cut Filters Sales by Companies
3.5 Global Sharp Cut Filters Price by Manufacturer (2021-2026)
3.6 Top 3 and Top 5 Sharp Cut Filters Companies in Global Market, by Revenue in 2025
3.7 Global Manufacturers Sharp Cut Filters Product Type
3.8 Tier 1, Tier 2, and Tier 3 Sharp Cut Filters Players in Global Market
3.8.1 List of Global Tier 1 Sharp Cut Filters Companies
3.8.2 List of Global Tier 2 and Tier 3 Sharp Cut Filters Companies
4 Sights by Type
4.1 Overview
4.1.1 Segment by Type – Global Sharp Cut Filters Market Size Markets, 2025 & 2034
4.1.2 Y50
4.1.3 L37
4.1.4 O56
4.1.5 R62
4.2 Segment by Type – Global Sharp Cut Filters Revenue & Forecasts
4.2.1 Segment by Type – Global Sharp Cut Filters Revenue, 2021-2026
4.2.2 Segment by Type – Global Sharp Cut Filters Revenue, 2027-2034
4.2.3 Segment by Type – Global Sharp Cut Filters Revenue Market Share, 2021-2034
4.3 Segment by Type – Global Sharp Cut Filters Sales & Forecasts
4.3.1 Segment by Type – Global Sharp Cut Filters Sales, 2021-2026
4.3.2 Segment by Type – Global Sharp Cut Filters Sales, 2027-2034
4.3.3 Segment by Type – Global Sharp Cut Filters Sales Market Share, 2021-2034
4.4 Segment by Type – Global Sharp Cut Filters Price (Manufacturers Selling Prices), 2021-2034
5 Sights by Application
5.1 Overview
5.1.1 Segment by Application – Global Sharp Cut Filters Market Size, 2025 & 2034
5.1.2 Camera
5.1.3 Medical Equipment
5.1.4 Others
5.2 Segment by Application – Global Sharp Cut Filters Revenue & Forecasts
5.2.1 Segment by Application – Global Sharp Cut Filters Revenue, 2021-2026
5.2.2 Segment by Application – Global Sharp Cut Filters Revenue, 2027-2034
5.2.3 Segment by Application – Global Sharp Cut Filters Revenue Market Share, 2021-2034
5.3 Segment by Application – Global Sharp Cut Filters Sales & Forecasts
5.3.1 Segment by Application – Global Sharp Cut Filters Sales, 2021-2026
5.3.2 Segment by Application – Global Sharp Cut Filters Sales, 2027-2034
5.3.3 Segment by Application – Global Sharp Cut Filters Sales Market Share, 2021-2034
5.4 Segment by Application – Global Sharp Cut Filters Price (Manufacturers Selling Prices), 2021-2034
6 Sights Region
6.1 By Region – Global Sharp Cut Filters Market Size, 2025 & 2034
6.2 By Region – Global Sharp Cut Filters Revenue & Forecasts
6.2.1 By Region – Global Sharp Cut Filters Revenue, 2021-2026
6.2.2 By Region – Global Sharp Cut Filters Revenue, 2027-2034
6.2.3 By Region – Global Sharp Cut Filters Revenue Market Share, 2021-2034
6.3 By Region – Global Sharp Cut Filters Sales & Forecasts
6.3.1 By Region – Global Sharp Cut Filters Sales, 2021-2026
6.3.2 By Region – Global Sharp Cut Filters Sales, 2027-2034
6.3.3 By Region – Global Sharp Cut Filters Sales Market Share, 2021-2034
6.4 North America
6.4.1 By Country – North America Sharp Cut Filters Revenue, 2021-2034
6.4.2 By Country – North America Sharp Cut Filters Sales, 2021-2034
6.4.3 United States Sharp Cut Filters Market Size, 2021-2034
6.4.4 Canada Sharp Cut Filters Market Size, 2021-2034
6.4.5 Mexico Sharp Cut Filters Market Size, 2021-2034
6.5 Europe
6.5.1 By Country – Europe Sharp Cut Filters Revenue, 2021-2034
6.5.2 By Country – Europe Sharp Cut Filters Sales, 2021-2034
6.5.3 Germany Sharp Cut Filters Market Size, 2021-2034
6.5.4 France Sharp Cut Filters Market Size, 2021-2034
6.5.5 U.K. Sharp Cut Filters Market Size, 2021-2034
6.5.6 Italy Sharp Cut Filters Market Size, 2021-2034
6.5.7 Russia Sharp Cut Filters Market Size, 2021-2034
6.5.8 Nordic Countries Sharp Cut Filters Market Size, 2021-2034
6.5.9 Benelux Sharp Cut Filters Market Size, 2021-2034
6.6 Asia
6.6.1 By Region – Asia Sharp Cut Filters Revenue, 2021-2034
6.6.2 By Region – Asia Sharp Cut Filters Sales, 2021-2034
6.6.3 China Sharp Cut Filters Market Size, 2021-2034
6.6.4 Japan Sharp Cut Filters Market Size, 2021-2034
6.6.5 South Korea Sharp Cut Filters Market Size, 2021-2034
6.6.6 Southeast Asia Sharp Cut Filters Market Size, 2021-2034
6.6.7 India Sharp Cut Filters Market Size, 2021-2034
6.7 South America
6.7.1 By Country – South America Sharp Cut Filters Revenue, 2021-2034
6.7.2 By Country – South America Sharp Cut Filters Sales, 2021-2034
6.7.3 Brazil Sharp Cut Filters Market Size, 2021-2034
6.7.4 Argentina Sharp Cut Filters Market Size, 2021-2034
6.8 Middle East & Africa
6.8.1 By Country – Middle East & Africa Sharp Cut Filters Revenue, 2021-2034
6.8.2 By Country – Middle East & Africa Sharp Cut Filters Sales, 2021-2034
6.8.3 Turkey Sharp Cut Filters Market Size, 2021-2034
6.8.4 Israel Sharp Cut Filters Market Size, 2021-2034
6.8.5 Saudi Arabia Sharp Cut Filters Market Size, 2021-2034
6.8.6 UAE Sharp Cut Filters Market Size, 2021-2034
7 Manufacturers & Brands Profiles
7.1 Hoya Optics
7.1.1 Hoya Optics Company Summary
7.1.2 Hoya Optics Business Overview
7.1.3 Hoya Optics Sharp Cut Filters Major Product Offerings
7.1.4 Hoya Optics Sharp Cut Filters Sales and Revenue in Global (2021-2026)
7.1.5 Hoya Optics Key News & Latest Developments
7.2 SURUGA SEIKI
7.2.1 SURUGA SEIKI Company Summary
7.2.2 SURUGA SEIKI Business Overview
7.2.3 SURUGA SEIKI Sharp Cut Filters Major Product Offerings
7.2.4 SURUGA SEIKI Sharp Cut Filters Sales and Revenue in Global (2021-2026)
7.2.5 SURUGA SEIKI Key News & Latest Developments
7.3 Valley Design
7.3.1 Valley Design Company Summary
7.3.2 Valley Design Business Overview
7.3.3 Valley Design Sharp Cut Filters Major Product Offerings
7.3.4 Valley Design Sharp Cut Filters Sales and Revenue in Global (2021-2026)
7.3.5 Valley Design Key News & Latest Developments
7.4 Pyramid Imaging, Inc.
7.4.1 Pyramid Imaging, Inc. Company Summary
7.4.2 Pyramid Imaging, Inc. Business Overview
7.4.3 Pyramid Imaging, Inc. Sharp Cut Filters Major Product Offerings
7.4.4 Pyramid Imaging, Inc. Sharp Cut Filters Sales and Revenue in Global (2021-2026)
7.4.5 Pyramid Imaging, Inc. Key News & Latest Developments
7.5 MidOpt
7.5.1 MidOpt Company Summary
7.5.2 MidOpt Business Overview
7.5.3 MidOpt Sharp Cut Filters Major Product Offerings
7.5.4 MidOpt Sharp Cut Filters Sales and Revenue in Global (2021-2026)
7.5.5 MidOpt Key News & Latest Developments
8 Global Sharp Cut Filters Production Capacity, Analysis
8.1 Global Sharp Cut Filters Production Capacity, 2021-2034
8.2 Sharp Cut Filters Production Capacity of Key Manufacturers in Global Market
8.3 Global Sharp Cut Filters Production by Region
9 Key Market Trends, Opportunity, Drivers and Restraints
9.1 Market Opportunities & Trends
9.2 Market Drivers
9.3 Market Restraints
10 Sharp Cut Filters Supply Chain Analysis
10.1 Sharp Cut Filters Industry Value Chain
10.2 Sharp Cut Filters Upstream Market
10.3 Sharp Cut Filters Downstream and Clients
10.4 Marketing Channels Analysis
10.4.1 Marketing Channels
10.4.2 Sharp Cut Filters Distributors and Sales Agents in Global
11 Conclusion
12 Appendix
12.1 Note
12.2 Examples of Clients
12.3 DisclaimerList of Tables
Table 1. Key Players of Sharp Cut Filters in Global Market
Table 2. Top Sharp Cut Filters Players in Global Market, Ranking by Revenue (2025)
Table 3. Global Sharp Cut Filters Revenue by Companies, (US$, Mn), 2021-2026
Table 4. Global Sharp Cut Filters Revenue Share by Companies, 2021-2026
Table 5. Global Sharp Cut Filters Sales by Companies, (K Units), 2021-2026
Table 6. Global Sharp Cut Filters Sales Share by Companies, 2021-2026
Table 7. Key Manufacturers Sharp Cut Filters Price (2021-2026) & (US$/Unit)
Table 8. Global Manufacturers Sharp Cut Filters Product Type
Table 9. List of Global Tier 1 Sharp Cut Filters Companies, Revenue (US$, Mn) in 2025 and Market Share
Table 10. List of Global Tier 2 and Tier 3 Sharp Cut Filters Companies, Revenue (US$, Mn) in 2025 and Market Share
Table 11. Segment by Type – Global Sharp Cut Filters Revenue, (US$, Mn), 2025 & 2034
Table 12. Segment by Type – Global Sharp Cut Filters Revenue (US$, Mn), 2021-2026
Table 13. Segment by Type – Global Sharp Cut Filters Revenue (US$, Mn), 2027-2034
Table 14. Segment by Type – Global Sharp Cut Filters Sales (K Units), 2021-2026
Table 15. Segment by Type – Global Sharp Cut Filters Sales (K Units), 2027-2034
Table 16. Segment by Application – Global Sharp Cut Filters Revenue, (US$, Mn), 2025 & 2034
Table 17. Segment by Application – Global Sharp Cut Filters Revenue, (US$, Mn), 2021-2026
Table 18. Segment by Application – Global Sharp Cut Filters Revenue, (US$, Mn), 2027-2034
Table 19. Segment by Application – Global Sharp Cut Filters Sales, (K Units), 2021-2026
Table 20. Segment by Application – Global Sharp Cut Filters Sales, (K Units), 2027-2034
Table 21. By Region – Global Sharp Cut Filters Revenue, (US$, Mn), 2025 & 2034
Table 22. By Region – Global Sharp Cut Filters Revenue, (US$, Mn), 2021-2026
Table 23. By Region – Global Sharp Cut Filters Revenue, (US$, Mn), 2027-2034
Table 24. By Region – Global Sharp Cut Filters Sales, (K Units), 2021-2026
Table 25. By Region – Global Sharp Cut Filters Sales, (K Units), 2027-2034
Table 26. By Country – North America Sharp Cut Filters Revenue, (US$, Mn), 2021-2026
Table 27. By Country – North America Sharp Cut Filters Revenue, (US$, Mn), 2027-2034
Table 28. By Country – North America Sharp Cut Filters Sales, (K Units), 2021-2026
Table 29. By Country – North America Sharp Cut Filters Sales, (K Units), 2027-2034
Table 30. By Country – Europe Sharp Cut Filters Revenue, (US$, Mn), 2021-2026
Table 31. By Country – Europe Sharp Cut Filters Revenue, (US$, Mn), 2027-2034
Table 32. By Country – Europe Sharp Cut Filters Sales, (K Units), 2021-2026
Table 33. By Country – Europe Sharp Cut Filters Sales, (K Units), 2027-2034
Table 34. By Region – Asia Sharp Cut Filters Revenue, (US$, Mn), 2021-2026
Table 35. By Region – Asia Sharp Cut Filters Revenue, (US$, Mn), 2027-2034
Table 36. By Region – Asia Sharp Cut Filters Sales, (K Units), 2021-2026
Table 37. By Region – Asia Sharp Cut Filters Sales, (K Units), 2027-2034
Table 38. By Country – South America Sharp Cut Filters Revenue, (US$, Mn), 2021-2026
Table 39. By Country – South America Sharp Cut Filters Revenue, (US$, Mn), 2027-2034
Table 40. By Country – South America Sharp Cut Filters Sales, (K Units), 2021-2026
Table 41. By Country – South America Sharp Cut Filters Sales, (K Units), 2027-2034
Table 42. By Country – Middle East & Africa Sharp Cut Filters Revenue, (US$, Mn), 2021-2026
Table 43. By Country – Middle East & Africa Sharp Cut Filters Revenue, (US$, Mn), 2027-2034
Table 44. By Country – Middle East & Africa Sharp Cut Filters Sales, (K Units), 2021-2026
Table 45. By Country – Middle East & Africa Sharp Cut Filters Sales, (K Units), 2027-2034
Table 46. Hoya Optics Company Summary
Table 47. Hoya Optics Sharp Cut Filters Product Offerings
Table 48. Hoya Optics Sharp Cut Filters Sales (K Units), Revenue (US$, Mn) and Average Price (US$/Unit) & (2021-2026)
Table 49. Hoya Optics Key News & Latest Developments
Table 50. SURUGA SEIKI Company Summary
Table 51. SURUGA SEIKI Sharp Cut Filters Product Offerings
Table 52. SURUGA SEIKI Sharp Cut Filters Sales (K Units), Revenue (US$, Mn) and Average Price (US$/Unit) & (2021-2026)
Table 53. SURUGA SEIKI Key News & Latest Developments
Table 54. Valley Design Company Summary
Table 55. Valley Design Sharp Cut Filters Product Offerings
Table 56. Valley Design Sharp Cut Filters Sales (K Units), Revenue (US$, Mn) and Average Price (US$/Unit) & (2021-2026)
Table 57. Valley Design Key News & Latest Developments
Table 58. Pyramid Imaging, Inc. Company Summary
Table 59. Pyramid Imaging, Inc. Sharp Cut Filters Product Offerings
Table 60. Pyramid Imaging, Inc. Sharp Cut Filters Sales (K Units), Revenue (US$, Mn) and Average Price (US$/Unit) & (2021-2026)
Table 61. Pyramid Imaging, Inc. Key News & Latest Developments
Table 62. MidOpt Company Summary
Table 63. MidOpt Sharp Cut Filters Product Offerings
Table 64. MidOpt Sharp Cut Filters Sales (K Units), Revenue (US$, Mn) and Average Price (US$/Unit) & (2021-2026)
Table 65. MidOpt Key News & Latest Developments
Table 66. Sharp Cut Filters Capacity of Key Manufacturers in Global Market, 2024-2026 (K Units)
Table 67. Global Sharp Cut Filters Capacity Market Share of Key Manufacturers, 2024-2026
Table 68. Global Sharp Cut Filters Production by Region, 2021-2026 (K Units)
Table 69. Global Sharp Cut Filters Production by Region, 2027-2034 (K Units)
Table 70. Sharp Cut Filters Market Opportunities & Trends in Global Market
Table 71. Sharp Cut Filters Market Drivers in Global Market
Table 72. Sharp Cut Filters Market Restraints in Global Market
Table 73. Sharp Cut Filters Raw Materials
Table 74. Sharp Cut Filters Raw Materials Suppliers in Global Market
Table 75. Typical Sharp Cut Filters Downstream
Table 76. Sharp Cut Filters Downstream Clients in Global Market
Table 77. Sharp Cut Filters Distributors and Sales Agents in Global Market

List of Figures
Figure 1. Sharp Cut Filters Product Picture
Figure 2. Sharp Cut Filters Segment by Type in 2025
Figure 3. Sharp Cut Filters Segment by Application in 2025
Figure 4. Global Sharp Cut Filters Market Overview: 2025
Figure 5. Key Caveats
Figure 6. Global Sharp Cut Filters Market Size: 2025 VS 2034 (US$, Mn)
Figure 7. Global Sharp Cut Filters Revenue: 2021-2034 (US$, Mn)
Figure 8. Sharp Cut Filters Sales in Global Market: 2021-2034 (K Units)
Figure 9. The Top 3 and 5 Players Market Share by Sharp Cut Filters Revenue in 2025
Figure 10. Segment by Type – Global Sharp Cut Filters Revenue, (US$, Mn), 2025 & 2034
Figure 11. Segment by Type – Global Sharp Cut Filters Revenue Market Share, 2021-2034
Figure 12. Segment by Type – Global Sharp Cut Filters Sales Market Share, 2021-2034
Figure 13. Segment by Type – Global Sharp Cut Filters Price (US$/Unit), 2021-2034
Figure 14. Segment by Application – Global Sharp Cut Filters Revenue, (US$, Mn), 2025 & 2034
Figure 15. Segment by Application – Global Sharp Cut Filters Revenue Market Share, 2021-2034
Figure 16. Segment by Application – Global Sharp Cut Filters Sales Market Share, 2021-2034
Figure 17. Segment by Application -Global Sharp Cut Filters Price (US$/Unit), 2021-2034
Figure 18. By Region – Global Sharp Cut Filters Revenue, (US$, Mn), 2025 & 2034
Figure 19. By Region – Global Sharp Cut Filters Revenue Market Share, 2021 VS 2025 VS 2034
Figure 20. By Region – Global Sharp Cut Filters Revenue Market Share, 2021-2034
Figure 21. By Region – Global Sharp Cut Filters Sales Market Share, 2021-2034
Figure 22. By Country – North America Sharp Cut Filters Revenue Market Share, 2021-2034
Figure 23. By Country – North America Sharp Cut Filters Sales Market Share, 2021-2034
Figure 24. United States Sharp Cut Filters Revenue, (US$, Mn), 2021-2034
Figure 25. Canada Sharp Cut Filters Revenue, (US$, Mn), 2021-2034
Figure 26. Mexico Sharp Cut Filters Revenue, (US$, Mn), 2021-2034
Figure 27. By Country – Europe Sharp Cut Filters Revenue Market Share, 2021-2034
Figure 28. By Country – Europe Sharp Cut Filters Sales Market Share, 2021-2034
Figure 29. Germany Sharp Cut Filters Revenue, (US$, Mn), 2021-2034
Figure 30. France Sharp Cut Filters Revenue, (US$, Mn), 2021-2034
Figure 31. U.K. Sharp Cut Filters Revenue, (US$, Mn), 2021-2034
Figure 32. Italy Sharp Cut Filters Revenue, (US$, Mn), 2021-2034
Figure 33. Russia Sharp Cut Filters Revenue, (US$, Mn), 2021-2034
Figure 34. Nordic Countries Sharp Cut Filters Revenue, (US$, Mn), 2021-2034
Figure 35. Benelux Sharp Cut Filters Revenue, (US$, Mn), 2021-2034
Figure 36. By Region – Asia Sharp Cut Filters Revenue Market Share, 2021-2034
Figure 37. By Region – Asia Sharp Cut Filters Sales Market Share, 2021-2034
Figure 38. China Sharp Cut Filters Revenue, (US$, Mn), 2021-2034
Figure 39. Japan Sharp Cut Filters Revenue, (US$, Mn), 2021-2034
Figure 40. South Korea Sharp Cut Filters Revenue, (US$, Mn), 2021-2034
Figure 41. Southeast Asia Sharp Cut Filters Revenue, (US$, Mn), 2021-2034
Figure 42. India Sharp Cut Filters Revenue, (US$, Mn), 2021-2034
Figure 43. By Country – South America Sharp Cut Filters Revenue Market Share, 2021-2034
Figure 44. By Country – South America Sharp Cut Filters Sales, Market Share, 2021-2034
Figure 45. Brazil Sharp Cut Filters Revenue, (US$, Mn), 2021-2034
Figure 46. Argentina Sharp Cut Filters Revenue, (US$, Mn), 2021-2034
Figure 47. By Country – Middle East & Africa Sharp Cut Filters Revenue, Market Share, 2021-2034
Figure 48. By Country – Middle East & Africa Sharp Cut Filters Sales, Market Share, 2021-2034
Figure 49. Turkey Sharp Cut Filters Revenue, (US$, Mn), 2021-2034
Figure 50. Israel Sharp Cut Filters Revenue, (US$, Mn), 2021-2034
Figure 51. Saudi Arabia Sharp Cut Filters Revenue, (US$, Mn), 2021-2034
Figure 52. UAE Sharp Cut Filters Revenue, (US$, Mn), 2021-2034
Figure 53. Global Sharp Cut Filters Production Capacity (K Units), 2021-2034
Figure 54. The Percentage of Production Sharp Cut Filters by Region, 2025 VS 2034
Figure 55. Sharp Cut Filters Industry Value Chain
Figure 56. Marketing Channels