Sense Cable Market Overview
The sense cable is a kind of signal transmission tool. Generally, the signal transmitted by the sensor is very weak. In order to avoid signal interference, the signal cable has a shielding layer outside, and the shielding layer of the wrapped conductor is generally a conductive cloth, a braided copper mesh or a copper pouch (Aluminum), the shielding layer needs to be grounded, and external interference signals can be introduced into the earth by this layer to avoid interference signals entering the inner conductor interference and reduce the loss of transmission signals.
This report provides a deep insight into the global Sense Cable market covering all its essential aspects. This ranges from a macro overview of the market to micro details of the market size, competitive landscape, development trend, niche market, key market drivers and challenges, SWOT analysis, value chain analysis, etc.
The analysis helps the reader to shape the competition within the industries and strategies for the competitive environment to enhance the potential profit. Furthermore, it provides a simple framework for evaluating and accessing the position of the business organization. The report structure also focuses on the competitive landscape of the Global Sense Cable Market, this report introduces in detail the market share, market performance, product situation, operation situation, etc. of the main players, which helps the readers in the industry to identify the main competitors and deeply understand the competition pattern of the market.
In a word, this report is a must-read for industry players, investors, researchers, consultants, business strategists, and all those who have any kind of stake or are planning to foray into the Sense Cable market in any manner.
Sense Cable Market Analysis:
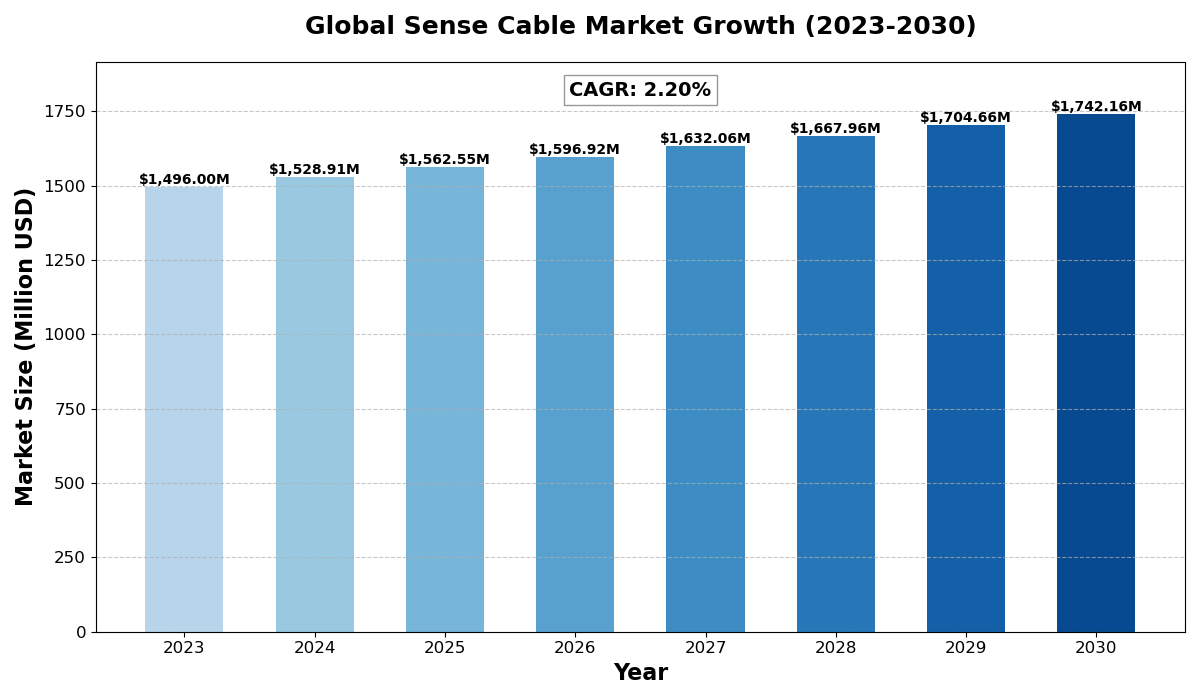
The global Sense Cable Market size was estimated at USD 1496 million in 2023 and is projected to reach USD 1742.16 million by 2030, exhibiting a CAGR of 2.20% during the forecast period.
North America Sense Cable market size was USD 389.81 million in 2023, at a CAGR of 1.89% during the forecast period of 2025 through 2030.
Sense Cable Key Market Trends :
- Growing Demand for Industrial Automation
The increasing adoption of industrial automation is driving the need for reliable sensing and monitoring systems, boosting the demand for sense cables. - Advancements in Smart Cable Technology
Innovations such as self-diagnosing cables and real-time monitoring solutions are enhancing the performance and reliability of sense cables. - Rising Investments in Renewable Energy
The transition towards clean energy sources like wind and solar power requires efficient power transmission and monitoring, increasing the demand for sense cables. - Expansion of Smart Infrastructure Projects
The development of smart cities and intelligent transportation systems is contributing to the increased use of advanced sensing technologies, including sense cables. - Focus on High-Voltage Transmission Efficiency
With the need for better power distribution, high-voltage sense cables are being increasingly used in energy and utility applications.
Sense Cable Market Regional Analysis :

-
North America:
Strong demand driven by EVs, 5G infrastructure, and renewable energy, with the U.S. leading the market.
-
Europe:
Growth fueled by automotive electrification, renewable energy, and strong regulatory support, with Germany as a key player.
-
Asia-Pacific:
Dominates the market due to large-scale manufacturing in China and Japan, with growing demand from EVs, 5G, and semiconductors.
-
South America:
Emerging market, driven by renewable energy and EV adoption, with Brazil leading growth.
-
Middle East & Africa:
Gradual growth, mainly due to investments in renewable energy and EV infrastructure, with Saudi Arabia and UAE as key contributors.
Sense Cable Market Segmentation :
The research report includes specific segments by region (country), manufacturers, Type, and Application. Market segmentation creates subsets of a market based on product type, end-user or application, Geographic, and other factors. By understanding the market segments, the decision-maker can leverage this targeting in the product, sales, and marketing strategies. Market segments can power your product development cycles by informing how you create product offerings for different segments.
Key Company
- Prysmian Group
- Nexans
- Corning
- NKT
- Leoni
- HELUKABEL
- Lyudinovokabel
- Lapp Group
- Jiangsu Tongguang Electronic Wire & Cable Corp.
- Ltd.
- Yokogawa Electric
- Hansen
- Low Voltage Sense Cable
- Medium Voltage Sense Cable
- High Voltage Sense Cable
- Industrial & Energy
- Commercial
- Home
- Utilities
- Others
Market Drivers:
- Increasing Industrial Automation
Industries are rapidly integrating automation and IoT technologies, which require sense cables for accurate data transmission and system monitoring. - Growing Energy Sector Demand
The expansion of power grids, renewable energy projects, and electrical infrastructure is creating a steady demand for sense cables. - Rising Focus on Safety & Monitoring
Enhanced safety regulations and real-time monitoring needs in industries are fueling the demand for high-quality sense cables.
Market Restraints:
- High Initial Investment Costs
The cost of advanced sense cable technologies and installation is a challenge for small and medium-sized enterprises. - Complexity in Maintenance
Sense cables, especially in industrial and energy applications, require regular maintenance, which can be time-consuming and costly. - Fluctuations in Raw Material Prices
Variations in the prices of copper, aluminum, and other essential materials impact the overall cost and profitability of sense cables.
Market Opportunities:
- Technological Advancements
Innovations in fiber optics and smart sensor cables present new growth opportunities in multiple industries. - Expansion in Emerging Markets
Rapid industrialization in countries like India, China, and Brazil is driving the demand for advanced sensing solutions. - Integration with AI & IoT
The growing use of AI and IoT-based monitoring systems opens new avenues for advanced sense cable applications.
Market Challenges:
- Intense Market Competition
The presence of multiple key players makes it challenging for new entrants to establish a strong foothold. - Stringent Regulatory Standards
Compliance with industry regulations and safety standards can be complex and costly for manufacturers. - Impact of Supply Chain Disruptions
Global supply chain disruptions, including raw material shortages and logistical delays, affect market growth.
Key Benefits of This Market Research:
- Industry drivers, restraints, and opportunities covered in the study
- Neutral perspective on the market performance
- Recent industry trends and developments
- Competitive landscape & strategies of key players
- Potential & niche segments and regions exhibiting promising growth covered
- Historical, current, and projected market size, in terms of value
- In-depth analysis of the Sense Cable Market
- Overview of the regional outlook of the Sense Cable Market:
Key Reasons to Buy this Report:
- Access to date statistics compiled by our researchers. These provide you with historical and forecast data, which is analyzed to tell you why your market is set to change
- This enables you to anticipate market changes to remain ahead of your competitors
- You will be able to copy data from the Excel spreadsheet straight into your marketing plans, business presentations, or other strategic documents
- The concise analysis, clear graph, and table format will enable you to pinpoint the information you require quickly
- Provision of market value (USD Billion) data for each segment and sub-segment
- Indicates the region and segment that is expected to witness the fastest growth as well as to dominate the market
- Provides insight into the market through Value Chain
- Market dynamics scenario, along with growth opportunities of the market in the years to come
- 6-month post-sales analyst support
Customization of the Report
In case of any queries or customization requirements, please connect with our sales team, who will ensure that your requirements are met.
FAQs
Q: What are the key driving factors and opportunities in the Sense Cable market?
A: The key driving factors include industrial automation, the growing energy sector, and increasing safety regulations. Opportunities lie in technological advancements, emerging markets, and AI & IoT integration.
Q: Which region is projected to have the largest market share?
A: Asia-Pacific is expected to dominate the market due to rapid industrialization, infrastructure development, and rising energy demands.
Q: Who are the top players in the global Sense Cable market?
A: Leading companies include Prysmian Group, Nexans, Corning, NKT, Leoni, and HELUKABEL.
Q: What are the latest technological advancements in the industry?
A: Innovations such as smart sense cables with real-time monitoring, AI-driven diagnostics, and enhanced shielding technologies are shaping the industry.
Q: What is the current size of the global Sense Cable market?
A: The market was valued at USD 1,496 million in 2023 and is projected to reach USD 1,742.16 million by 2030, with a CAGR of 2.20%.

Get Sample Report PDF for Exclusive Insights
Report Sample Includes
- Table of Contents
- List of Tables & Figures
- Charts, Research Methodology, and more...


