SEMICONDUCTOR INSIGHT
MARKET RESEARCH REPORT

Semiconductor Memory Market

2026 to 2034
MARKET INTELLIGENCE
ACROSS KEY REGIONS
2026 EDITION
SEMICONDUCTOR MEMORY Semiconductor Market Research

Semiconductor Memory Market

Emerging Trends, Technological Advancements, and Business Strategies 2025-2032

◷
UPDATED 06 October 2026
▤
REPORT LENGTH Detailed Report
▣
REPORT CODE e59d185701c3
▯
FORMATS PDF

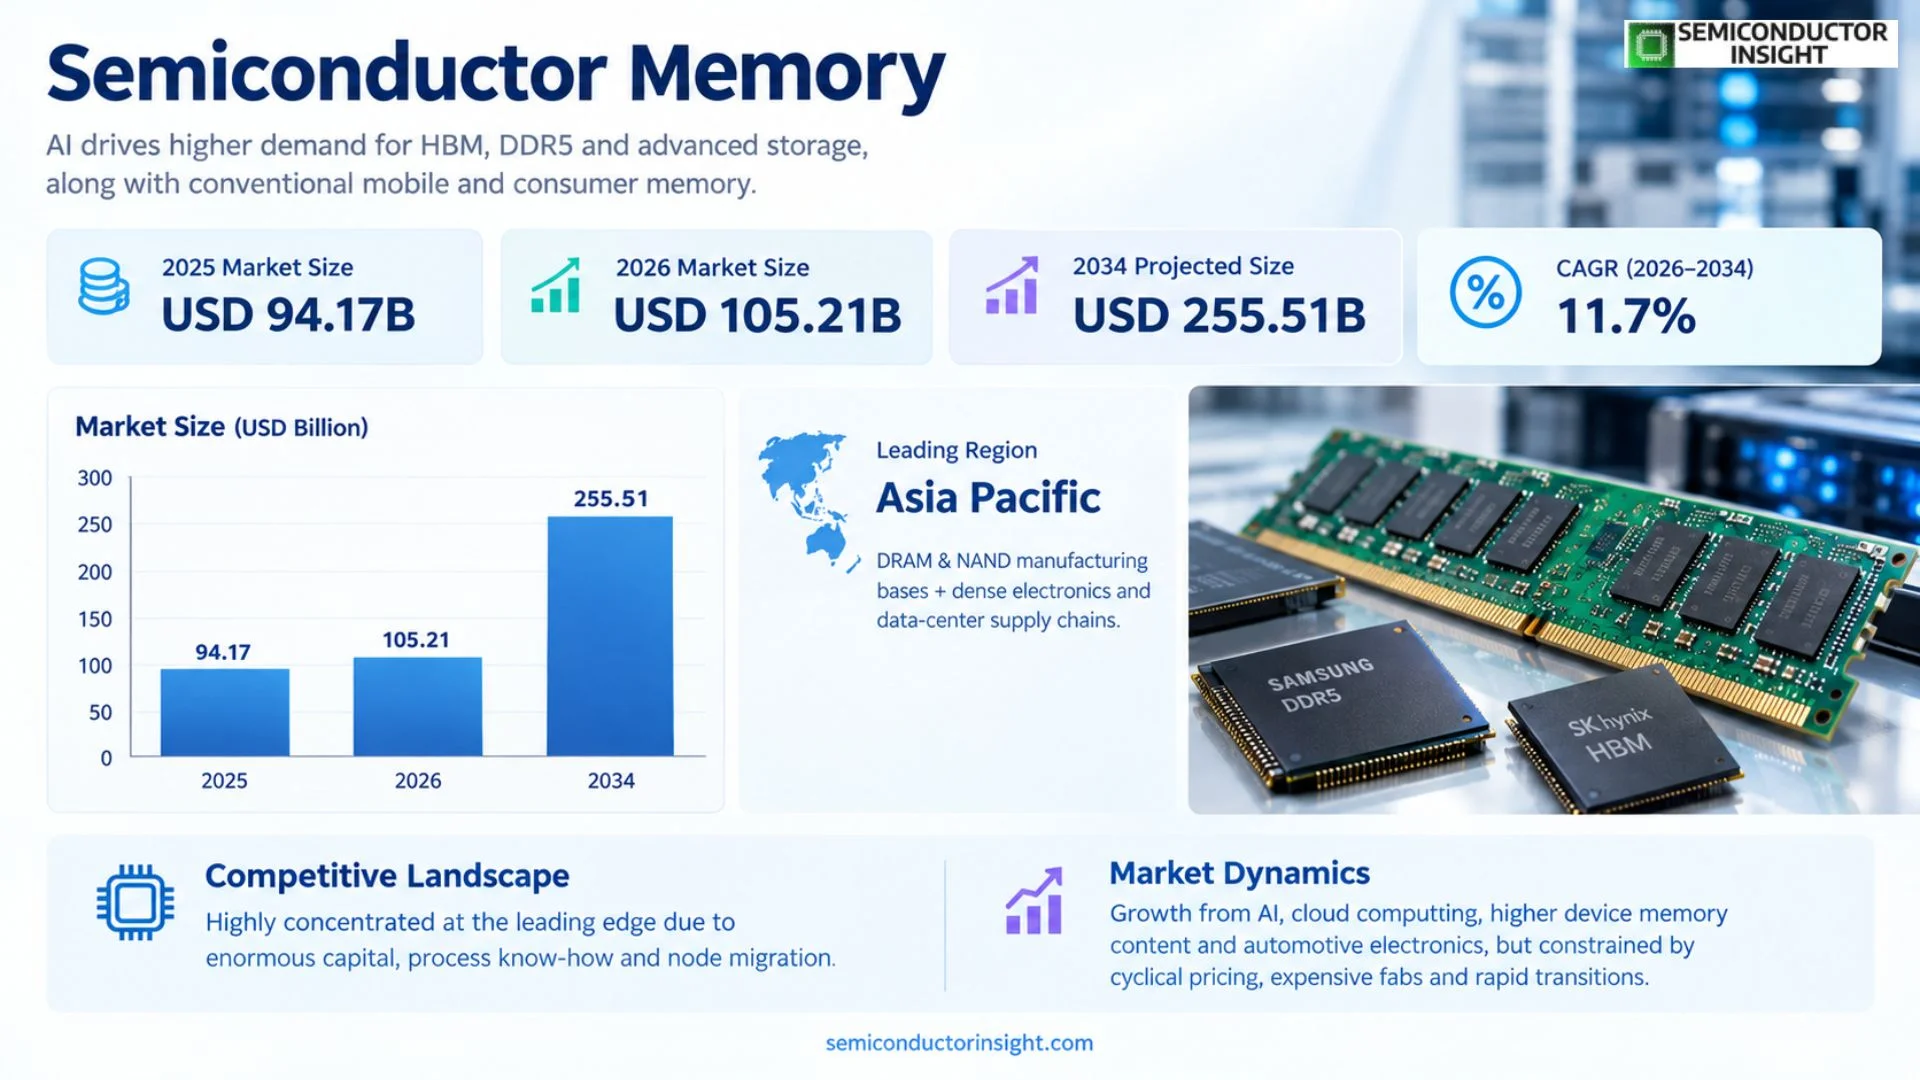
Semiconductor Memory Market is valued at USD 94.17 billion in 2025 and is projected to reach USD 255.51 billion by 2034, expanding at a 11.7% CAGR during 2026–2034. The 2026 market level is USD 105.21 billion. Asia Pacific holds the leading regional position because the region combines the core manufacturing bases for DRAM and NAND with dense electronics and data-center supply chains. AI-oriented memory is the most important mix shift, raising demand for HBM, DDR5 and higher-performance storage alongside conventional mobile and consumer memory.

Get the sample PDF with study scope, segmentation and methodology details.

Key Statistics

2025 Market Size
USD 94.17 billion
2034 Projected Market Size
USD 255.51 billion
CAGR (2026–2034)
11.7%
Largest Market in 2025
Asia Pacific

Key Takeaways

  • Market size: The market stands at USD 94.17 billion in 2025 and is projected to reach USD 255.51 billion by 2034, representing a 11.7% CAGR across 2026–2034.
  • AI infrastructure is changing the value mix, with HBM, server DRAM and high-performance NAND attracting more investment because bandwidth and power efficiency increasingly constrain accelerator performance.
  • NAND remains the largest persistent-memory segment, while DRAM gains strategic value through HBM and DDR5 demand in AI servers and high-performance computing.
  • Asia Pacific is the central production and consumption region, led by South Korea, Japan, China and Taiwan across DRAM, NAND, packaging and electronics manufacturing.
  • Cyclicality remains structural; suppliers must balance rapid node migration and capacity investment against inventory corrections, pricing volatility and demand swings.

Semiconductor Memory Market Overview

Semiconductor Memory Market is valued at USD 94.17 billion in 2025 and is projected to reach USD 255.51 billion by 2034, expanding at a 11.7% CAGR during 2026–2034. The 2026 market level is USD 105.21 billion. Asia Pacific holds the leading regional position because the region combines the core manufacturing bases for DRAM and NAND with dense electronics and data-center supply chains. AI-oriented memory is the most important mix shift, raising demand for HBM, DDR5 and higher-performance storage alongside conventional mobile and consumer memory.

Base year: 2025 · Estimated year: 2026 · Forecast period: 2026–2034 · Values stated in U.S. dollars unless otherwise noted

Semiconductor memory comprises integrated circuits used to store program code, working data and persistent information in electronic systems. The market includes volatile technologies such as DRAM and non-volatile technologies such as NAND, ROM and specialty flash. Commercial performance depends on density, bandwidth, latency, power, endurance and cost per bit, while supplier economics are shaped by fabrication scale, node migration, packaging complexity and the speed at which customers qualify new generations.

The market is becoming more heterogeneous. Mobile devices still consume enormous memory volumes, but AI servers are increasing the value of bandwidth-intensive products such as HBM and high-capacity DDR5. Automotive systems need long-lived, high-reliability memory, while industrial and embedded platforms emphasize continuity and qualification. This mix shift makes product portfolio discipline more important: the same supplier may face commodity pricing in mainstream NAND while earning structurally higher value in specialized server and accelerator memory.

Investment intensity is rising alongside technical complexity. Advanced DRAM nodes, high-layer-count 3D NAND and HBM require sophisticated lithography, bonding, packaging and test capability. Memory producers must synchronize wafer capacity with advanced packaging and substrate availability, because an HBM bottleneck can occur after front-end fabrication even when DRAM die output is sufficient. The result is a supply chain where packaging technology and yield management increasingly influence market share.

Segment Analysis: By Type

By type, the market is segmented into DRAM, NAND, ROM and other memory technologies. NAND provides the largest persistent-storage revenue pool, while DRAM is gaining strategic importance through HBM and DDR5. ROM and specialty memory serve embedded, automotive and industrial systems where predictable behavior and long support cycles matter more than maximum density.

Type Technical / commercial role Market position
DRAM Volatile working memory for mobile, PC, server and accelerator systems; includes DDR, LPDDR and HBM product families. High-value growth is concentrated in HBM and server DRAM as AI workloads increase bandwidth and capacity requirements.
NAND Non-volatile storage used in smartphones, SSDs, data centers and embedded systems, increasingly built as high-layer-count 3D NAND. Largest persistent-memory segment; scale economics and controller integration drive intense price competition.
ROM Non-volatile code and configuration storage for embedded electronics, microcontrollers and specialized systems. Stable specialist demand where deterministic behavior, long retention and lifecycle continuity are valued.
Other Includes NOR flash, MRAM, ReRAM and other specialty or emerging architectures. Smaller revenue base but strategically important for embedded, industrial and memory-class applications.

Additional Segmentation: By End User

End-user demand separates into consumer electronics, enterprise and data centers, automotive, and industrial or other embedded systems. Consumer products remain volume-heavy, while enterprise and data centers generate stronger value growth because AI servers combine large DRAM capacities, HBM stacks and high-performance NAND storage. Automotive and industrial customers add a different requirement set centered on endurance, temperature range, qualification and product longevity.

End User Demand characteristics
Consumer Electronics Smartphones, PCs, tablets, gaming devices and smart appliances drive high unit volumes and fast technology transitions.
Enterprise & Data Centers AI, cloud and database workloads require high-bandwidth DRAM, DDR5 and high-capacity NAND with strict performance and reliability targets.
Automotive Industry ADAS, infotainment, central compute and connected vehicles require reliable memory with long platform lifecycles and qualified operating ranges.
Industrial & Others Industrial control, networking and embedded systems favor lifecycle support, deterministic behavior and robust non-volatile memory.

Segment Analysis: By Application

By application, mobile devices remain a major volume engine, while server demand is the fastest value-growth area because AI and cloud computing increase both memory capacity and bandwidth per system. Computers contribute broad DRAM and NAND demand, and automotive systems are expanding as vehicle software, sensing and central computing architectures become more complex.

Application Demand characteristics
Mobile Device Smartphones require LPDDR and NAND with tight power budgets, small footprints and rapid density migration; on-device AI increases capacity requirements.
Computers PCs and workstations use DRAM and SSD NAND across mainstream and high-performance tiers, with replacement cycles influencing demand volatility.
Server AI and cloud systems combine large DDR5 capacities, HBM on accelerators and enterprise NAND; this is the strongest value-growth application.
Automotive Central compute, ADAS, infotainment and software updates increase embedded DRAM and non-volatile memory content per vehicle.
Others Networking, industrial, telecom and embedded applications create diversified demand for specialty and long-lifecycle memory products.

Additional Segmentation: By Technology Architecture

Technology architecture divides the market into volatile memory, non-volatile memory and emerging memory technologies. Volatile architectures dominate active processing, while non-volatile products retain data without power and serve storage and code functions. Emerging architectures target niches where endurance, persistence or latency can outperform established approaches, but adoption depends on manufacturing maturity, cost and integration with existing semiconductor processes.

Technology Architecture Commercial relevance
Volatile Memory DRAM and related architectures provide fast working memory and dominate system memory in PCs, servers and mobile devices.
Non-Volatile Memory NAND, NOR and ROM retain information without power and underpin storage, firmware and embedded applications.
Emerging Memory Technologies MRAM, ReRAM and related technologies address embedded, persistent or specialty use cases where endurance or latency justify higher cost.

Semiconductor Memory Market Outlook

Regional Analysis

Asia Pacific leads the semiconductor memory market because South Korea, Japan, China and Taiwan combine memory fabrication, materials, equipment, packaging and electronics manufacturing at unmatched scale. North America is a major demand and technology region for AI infrastructure and enterprise computing. Europe is weighted toward automotive and industrial memory, while South America and the Middle East & Africa are primarily consumption markets with limited front-end memory fabrication.

Why does the regional memory market differ so sharply between production hubs and consumption centers?

Memory is unusually concentrated because leading-edge production requires multibillion-dollar fabs, fast node transitions and very high utilization. Regions with installed DRAM and NAND capacity gain cost, engineering and ecosystem advantages, while regions without fabs participate mainly through data-center demand, device assembly or specialty applications. AI is also changing the map by concentrating investment around HBM production and advanced packaging.

Region Position Growth outlook Demand profile Supplier selection
Asia Pacific Largest High Manufacturing + electronics demand Technology leadership, scale, yield and customer proximity
North America High-value demand High AI, cloud, enterprise HBM availability, server qualification and technology partnerships
Europe Specialist Steady Automotive, industrial Reliability, long lifecycle and functional safety
South America Consumption-led Moderate Consumer and enterprise Pricing, channel availability and currency risk
Middle East & Africa Emerging Selective Data centers, telecom Supply availability and infrastructure investment
Asia Pacific LARGEST

Why does Asia Pacific lead semiconductor memory?

Asia Pacific leads because South Korea hosts Samsung and SK hynix, Japan hosts Kioxia and key materials suppliers, and China and Taiwan anchor electronics manufacturing, packaging and a large share of regional semiconductor demand. The region captures both supply and consumption, which shortens qualification cycles and supports rapid capacity deployment for DRAM, NAND and HBM.

Market positionLargest
Growth outlookHigh
Demand profileMemory manufacturing + electronics
Access gateTechnology and scale
Country / submarket Commercial logic
South Korea Core DRAM, NAND and HBM production through Samsung and SK hynix.
Japan NAND manufacturing, materials and equipment ecosystem led by Kioxia and supplier clusters.
China / Taiwan Large electronics manufacturing, data-center demand, packaging and growing domestic memory capability.

Market instances

  • Samsung began commercial HBM4 shipments in February 2026, signaling a major step in next-generation AI-memory supply.
  • SK hynix completed HBM4 development and mass-production readiness in September 2025, citing doubled bandwidth and improved power efficiency.
  • SEMI projected worldwide 300mm memory capacity at 4.1 million wafers per month in 2026, showing the scale of ongoing memory investment.
Regional leadership reflects the concentration of memory fabrication and electronics supply chains.
North America AI DEMAND

What drives North American semiconductor memory demand?

North America is a high-value demand center because hyperscale cloud providers, AI accelerator developers and enterprise computing platforms consume large volumes of HBM, server DRAM and enterprise NAND. Micron also provides domestic manufacturing and technology capability, while U.S. system companies influence memory specifications through accelerator, server and storage architectures.

Market positionHigh-value demand
Growth outlookHigh
Demand profileAI + cloud
Access gatePlatform qualification
Country / submarket Commercial logic
United States Hyperscale AI infrastructure, enterprise computing and Micron manufacturing.
Canada Cloud and research computing demand with limited front-end memory production.
Mexico Electronics and server-system manufacturing links demand to North American supply chains.

Market instances

  • Micron reports HBM4 high-volume production with more than 2.8 TB/s bandwidth per stack.
  • AI server deployments make memory bandwidth and energy efficiency central to system-level purchasing decisions.
  • Platform qualification with accelerator and server vendors is increasingly important to capture premium memory demand.
North American demand is value-dense even though regional manufacturing share is smaller than Asia Pacific.
Europe AUTOMOTIVE

Where does Europe create value in semiconductor memory?

Europe’s strength is in high-reliability automotive, industrial and embedded applications rather than commodity DRAM or NAND volume. Vehicle electronics, industrial automation and safety-critical systems require long qualification cycles, controlled product changes and extended availability, creating attractive niches for specialty flash, embedded memory and ruggedized products.

Market positionSpecialist
Growth outlookSteady
Demand profileAutomotive + industrial
Access gateReliability and lifecycle
Country / submarket Commercial logic
Germany Automotive OEM and industrial automation demand.
France Aerospace, automotive and industrial electronics.
Italy / Nordics Industrial, power and embedded systems with long lifecycle requirements.

Market instances

  • European demand emphasizes qualification and long-term supply rather than rapid consumer-node migration.
  • Automotive central-compute architectures increase memory content per vehicle while maintaining strict reliability requirements.
  • Industrial users reward suppliers able to preserve qualified products across long equipment lifetimes.
Europe is a high-value specialty market with limited commodity memory fabrication.
South America CONSUMPTION

How does South America participate in the memory market?

South America is primarily a consumption market for smartphones, PCs, enterprise storage and automotive electronics. Brazil is the largest national electronics market in the region, but limited local front-end fabrication means supply depends on imports and global pricing. Currency movements and channel inventory therefore have a stronger effect on regional demand than local wafer capacity.

Market positionConsumption-led
Growth outlookModerate
Demand profileConsumer + enterprise
Access gatePrice and availability
Country / submarket Commercial logic
Brazil Largest regional electronics and enterprise demand base.
Argentina Smaller demand with higher exposure to currency and import conditions.
Chile / Colombia Enterprise, telecom and consumer device demand.

Market instances

  • Regional buyers are exposed to global DRAM and NAND pricing cycles because local fabrication is limited.
  • Cloud and enterprise digitization support server and storage demand despite a smaller manufacturing base.
  • Consumer electronics remain the main volume channel for memory in the region.
Regional performance is linked to imported device demand and global memory pricing.
Middle East & Africa DATA CENTER GROWTH

What is expanding memory demand in the Middle East and Africa?

The region is an emerging memory demand center led by data-center investment, telecom infrastructure, smartphones and connected government services. Gulf markets are building large digital infrastructure projects, while African demand is weighted toward mobile devices and telecom. With little local memory fabrication, suppliers compete through availability, channel partnerships and integration with imported servers, networking equipment and consumer electronics.

Market positionEmerging
Growth outlookSelective
Demand profileData centers + mobile
Access gateChannel and infrastructure
Country / submarket Commercial logic
Gulf states Data centers, cloud services and premium electronics.
South Africa Enterprise, telecom and consumer electronics demand.
North / East Africa Mobile-first demand with growing digital infrastructure.

Market instances

  • AI and cloud investment in Gulf markets raises demand for high-capacity server memory and enterprise storage.
  • Mobile device penetration keeps NAND and LPDDR central to African memory consumption.
  • Regional supply remains import-dependent, making lead times and distributor inventory commercially important.
Growth depends on infrastructure expansion rather than local wafer fabrication.

Competitive Landscape

The market is highly concentrated at the leading edge because DRAM and NAND fabrication require enormous capital, process know-how and continuous node migration. Samsung Electronics, SK hynix and Micron dominate advanced DRAM, while Samsung, Kioxia, Western Digital/Sandisk, SK hynix and Micron are major NAND suppliers. Specialty vendors such as Winbond, Nanya, Macronix, GigaDevice and ISSI compete in embedded, NOR and specialty memory categories.

AI has intensified competition around HBM, where front-end DRAM technology must be combined with TSVs, stacking, packaging and thermal management. A supplier can hold advanced DRAM capability yet still face constraints if packaging yield or customer qualification lags. This makes integrated manufacturing and close collaboration with accelerator vendors increasingly important to share gains.

Memory competition remains cyclical. Suppliers respond to downturns by slowing capital expenditure and wafer starts, then accelerate when inventories normalize. Because pricing can change faster than fab capacity, disciplined supply management is a strategic capability. Product mix toward HBM, enterprise SSD and automotive memory can reduce exposure to the most volatile commodity segments.

Competitive tier Representative companies Primary differentiation
Leading integrated memory manufacturers Samsung Electronics, SK hynix, Micron Technology Advanced DRAM, HBM, NAND, scale manufacturing and broad customer access.
Major NAND and specialty suppliers Kioxia, Western Digital/Sandisk, Winbond, Nanya, Macronix NAND scale or focused specialty memory portfolios with established customer relationships.
Embedded and emerging suppliers GigaDevice, YMTC, ISSI, Microchip, Infineon Embedded flash, specialty memory, regional growth and application-specific qualification.

Key companies profiled

Samsung Electronics, SK hynix, Micron Technology, Kioxia Corporation, Western Digital/Sandisk, Winbond Electronics, Nanya Technology, Macronix International, GigaDevice Semiconductor, Yangtze Memory Technologies Corp., Texas Instruments, Microchip Technology, Infineon Technologies, Cypress Semiconductor within Infineon, and Integrated Silicon Solution Inc. are included in the competitive scope. Their roles differ across DRAM, NAND, NOR, embedded memory and specialty categories.

Production Capacity Analysis

Memory capacity is dominated by 300mm fabs because advanced DRAM and NAND require scale, leading-edge process control and large capital programs. SEMI reported in June 2026 that worldwide 300mm memory capacity was projected to reach 4.1 million wafers per month in 2026 and 4.2 million in 2027. HBM demand is also pushing investment into advanced packaging, where TSV formation, wafer thinning, bonding and stack test can become capacity constraints separate from DRAM wafer output.

Capacity expansion is geographically concentrated. South Korea remains central for Samsung and SK hynix, Japan for Kioxia, and the United States for Micron. China continues investing in domestic memory supply, while packaging and electronics assembly capacity spans Taiwan, China and Southeast Asia. Effective capacity therefore depends on more than fab starts: yield, layer count, die stacking and qualified packaging throughput determine saleable output.

Market Dynamics

The market is pulled upward by AI, cloud computing, higher device memory content and automotive electronics, but remains constrained by cyclical pricing, expensive fabs and rapid technology transitions. The most important structural change is the movement from cost-per-bit competition toward performance-per-watt and bandwidth in AI systems. HBM and advanced server memory can support premium economics, while mainstream NAND and DRAM continue to experience inventory-driven pricing cycles.

Market Drivers

Driver Impact Commercial mechanism
AI and HBM demand High Accelerators require rapidly rising memory bandwidth and capacity, lifting HBM and advanced DRAM investment.
Cloud and data-center expansion High Servers consume large DDR5 pools and enterprise NAND, with capacity scaling alongside compute infrastructure.
Higher memory content per device Medium-High Smartphones, PCs and vehicles add more DRAM and non-volatile storage as software complexity rises.
Automotive electronics Medium ADAS, central compute and connected functions increase qualified memory content per vehicle.

AI systems raise the value of bandwidth

AI accelerators require far more bandwidth than conventional processors, making HBM a strategic system component rather than a commodity memory device. Samsung, SK hynix and Micron are all moving HBM4 into production or customer qualification. This shifts industry value toward suppliers able to combine advanced DRAM, stacking and packaging at high yield while meeting power-efficiency requirements.

Cloud infrastructure sustains server memory demand

Cloud and enterprise data centers need large DRAM capacities and high-performance NAND for databases, virtualization and AI inference. As server platforms migrate to newer CPU and accelerator generations, memory channels and capacities expand. This creates recurring demand for DDR5, HBM and enterprise SSD NAND, with purchasing concentrated among a relatively small set of hyperscale and OEM customers.

Consumer devices continue to provide scale

Smartphones and PCs remain crucial because their unit volumes support enormous DRAM and NAND manufacturing scale. On-device AI, higher-resolution media and richer applications increase capacity per device even when unit shipments grow slowly. Suppliers use these markets to absorb large wafer volumes, but must manage faster pricing pressure than in specialized enterprise or automotive products.

Automotive memory content rises with central compute

Vehicles are becoming distributed computing platforms with ADAS, infotainment, connectivity and over-the-air software. These functions require DRAM for active processing and non-volatile memory for code, maps and data. Automotive qualification cycles are long, which can improve design-win durability and pricing stability for suppliers that support extended product lifecycles.

Market Restraints

Restraint Impact Commercial consequence
Cyclical pricing High Inventory corrections can sharply change ASPs and supplier profitability.
Capital intensity High Leading fabs and packaging lines require multibillion-dollar investment and long ramp periods.
Technology-transition risk Medium-High Node and layer migrations can create yield losses or product qualification delays.
Geopolitical concentration Medium-High Production is concentrated in a small number of countries and exposed to trade controls and supply disruptions.

Pricing cycles remain unavoidable

Memory is produced in enormous fixed-cost fabs, so modest changes in demand or utilization can create oversupply and steep price declines. Suppliers cannot instantly remove capacity after a downturn, and customers often reduce inventory at the same time. This amplifies earnings volatility and makes capital discipline essential even when long-term bit demand remains attractive.

Advanced manufacturing requires sustained capital

New DRAM nodes, 3D NAND layer transitions and HBM packaging demand continuous investment in lithography, deposition, etch, metrology and advanced packaging. The capital burden narrows the field of viable leading-edge suppliers. It also creates timing risk because capacity ordered during a boom can arrive after demand has softened.

Qualification can lag technology transitions

Each new DRAM process, NAND generation or HBM stack must achieve stable yield and pass customer qualification. A technically advanced product may still miss a market window if packaging, controller firmware or platform validation slips. The risk is especially important in AI, where accelerator launch cycles are fast and a delayed HBM generation can shift share.

Supply concentration raises resilience concerns

A large share of advanced memory is fabricated in South Korea, Japan, the United States and China. Earthquakes, power events, export controls or geopolitical disputes can affect supply availability. Customers increasingly use multi-sourcing and inventory planning, but true interchangeability remains limited for highly qualified server, HBM and automotive products.

Market Opportunities

HBM4 and next-generation AI memory

HBM4 doubles bus width versus HBM3E and raises stack bandwidth into multi-terabyte-per-second territory. Suppliers that scale HBM4 with high yield can capture premium revenue as AI accelerator demand expands. The opportunity extends into base dies, advanced packaging, bonding equipment, substrates, thermal solutions and test.

Enterprise NAND and high-capacity storage

AI data pipelines need both fast working memory and persistent storage. Enterprise SSDs, high-layer-count NAND and advanced controllers can benefit from growing training data, inference caches and vector databases. The most attractive products combine density with endurance, power efficiency and consistent latency.

Automotive and industrial specialty memory

Long-lifecycle markets reward reliability and supply continuity rather than the lowest cost per bit. Specialty DRAM, NOR flash, embedded non-volatile memory and qualified NAND can therefore support more stable economics. Suppliers with automotive quality systems and controlled product-change processes have an advantage.

Emerging non-volatile architectures

MRAM, ReRAM and related technologies can address embedded and storage-class niches where persistence, endurance or latency matters more than density. Adoption will remain selective, but integration into microcontrollers, edge AI and industrial systems creates a path to commercialization without directly replacing commodity NAND.

Supply Chain Analysis

Silicon wafers, gases & materials
DRAM/NAND wafer fabrication
HBM/advanced packaging & test
OEM, cloud, mobile & automotive deployment

Materials and equipment. Memory fabrication depends on high-purity silicon wafers, specialty gases, photoresists, deposition materials and advanced lithography, etch and metrology equipment. Shrinking DRAM nodes and higher 3D NAND layer counts increase process steps and sensitivity to contamination, raising the value of supplier consistency and process control.

Wafer fabrication. DRAM and NAND fabs convert materials into memory die through hundreds of process steps. Yield, node maturity and wafer utilization determine cost competitiveness. Because fixed costs are high, suppliers seek large-scale utilization while carefully managing bit growth to avoid creating oversupply.

Packaging and test. Standard memory uses mature packages, but HBM requires TSVs, wafer thinning, stacking and high-density interconnects. Advanced packaging capacity has become strategically important because a shortage can limit HBM shipments even when DRAM wafer output is sufficient. Test complexity also rises with stack height and bandwidth.

Downstream systems. Smartphones, PCs, servers, accelerators, vehicles and industrial systems translate memory into end demand. Hyperscale and accelerator customers increasingly influence roadmaps through direct qualification, while consumer OEMs provide scale. Automotive and industrial customers extend product lifecycles and require tighter change control.

Recent Developments in the Semiconductor Memory Market

Developments tracked through September 2026. Entries are limited to events that materially affect product capability, manufacturing capacity, customer adoption, channel access or the competitive structure of the market.

  • 29 June 2026
    SEMI reported that worldwide 300mm memory fab equipment investment was projected to exceed USD 50 billion in 2026, with memory capacity reaching 4.1 million wafers per month. The investment outlook reflects AI-driven demand for HBM, DDR5 and data storage. Source
  • 12 February 2026
    Samsung Electronics announced commercial HBM4 shipments and mass production, using a 4nm logic base die and 11.7Gbps transfer speed with capability up to 13Gbps. The launch strengthens competition for next-generation AI accelerator memory. Source
  • 12 September 2025
    SK hynix completed HBM4 development and readiness for mass production, stating that bandwidth doubled and power efficiency improved by 40% compared with the previous generation. The milestone increases competitive pressure in high-value AI memory. Source

Report Scope & Segmentation

Attribute Scope
Base year 2025
Estimated year 2026
Forecast period 2026–2034
2025 market size USD 94.17 billion
2026 estimated size USD 105.21 billion
2034 projected size USD 255.51 billion
CAGR (2026–2034) 11.7%
Largest market in 2025 Asia Pacific
By Type DRAM; NAND; ROM; Other
By Application Mobile Device; Computers; Server; Automotive; Others
By End User Consumer Electronics; Enterprise & Data Centers; Automotive Industry; Industrial & Others
By Technology Architecture Volatile Memory; Non-Volatile Memory; Emerging Memory Technologies
Companies profiled Samsung Electronics; SK hynix; Micron Technology; Kioxia; Western Digital/Sandisk; Winbond; Nanya; Macronix; GigaDevice; YMTC; Texas Instruments; Microchip; Infineon; Cypress; ISSI

Frequently Asked Questions

What is the semiconductor memory market size in 2025?

The global semiconductor memory market is valued at USD 94.17 billion in 2025. The scope includes volatile and non-volatile semiconductor memory used across mobile devices, PCs, servers, automotive electronics, industrial systems and other digital equipment.

What is the semiconductor memory market forecast for 2034?

The market is projected to reach USD 255.51 billion by 2034, representing a 11.7% CAGR during 2026–2034. The corresponding 2026 market level is USD 105.21 billion, reflecting continued expansion in AI, cloud and higher-capacity electronic systems.

Which region leads the semiconductor memory market?

Asia Pacific leads because it contains the principal DRAM and NAND manufacturing clusters in South Korea and Japan alongside major electronics, packaging and data-center supply chains in China, Taiwan and Southeast Asia.

Which type is the largest semiconductor memory segment?

NAND is the largest persistent-memory segment by revenue mix and supports smartphones, SSDs and data storage. DRAM is strategically important and is gaining value through HBM and DDR5 demand in AI servers and high-performance computing.

What is driving the fastest value growth in memory?

AI infrastructure is the strongest value-growth driver because accelerators require HBM with very high bandwidth, while servers also need large DDR5 pools and high-performance NAND. These requirements increase memory content and support premium products.

Why is the memory market cyclical?

Memory fabs carry high fixed costs and large output, so small changes in demand or utilization can create oversupply or tightness. Inventory corrections amplify the effect, causing sharp swings in average selling prices and supplier profitability.

How important is HBM to the market?

HBM is strategically important because AI accelerators need far more memory bandwidth than conventional processors. HBM4 development by Samsung, SK hynix and Micron illustrates how advanced packaging, stacking and power efficiency are becoming central competitive factors.

How is automotive demand different from consumer demand?

Automotive customers require long lifecycle support, qualified operating ranges and controlled product changes. These requirements create more durable design wins than consumer devices, even though total unit volumes are smaller than smartphones and PCs.

Who are the major semiconductor memory companies?

Major companies include Samsung Electronics, SK hynix, Micron Technology, Kioxia, Western Digital/Sandisk, Winbond, Nanya, Macronix, GigaDevice, YMTC and several specialty-memory suppliers serving embedded and automotive markets.

What will determine growth through 2034?

Growth will depend on AI and cloud infrastructure, HBM scaling, higher device memory content, advanced NAND density, automotive electronics and supplier discipline around capacity. Packaging yield, technology transitions and pricing cycles will remain important risks.

Research Sources & Evidence Base

View research sources used in this market overview
  1. SEMI – Memory investment outlook and 300mm fab capacity. 2026 memory equipment spending and capacity context.
  2. Samsung Electronics – Samsung Ships Industry-First Commercial HBM4. HBM4 mass-production and performance evidence, February 2026.
  3. SK hynix – SK hynix Completes HBM4 Development and Readies Mass Production. HBM4 readiness and performance evidence, September 2025.
  4. Micron – HBM4 product platform. HBM4 interface, bandwidth and product roadmap evidence.
Semiconductor Memory Market, Emerging Trends, Technological Advancements, and Business Strategies 2025-2032

Get Sample Report PDF for Exclusive Insights

Report Sample Includes

  • Table of Contents
  • List of Tables & Figures
  • Charts, Research Methodology, and more...

PDF Icon Download Sample Report PDF

Table of Content

1 Introduction to Research & Analysis Reports
1.1 Semiconductor Memory Market Definition
1.2 Market Segments
1.2.1 Segment by Type
1.2.2 Segment by Application
1.3 Global Semiconductor Memory Market Overview
1.4 Features & Benefits of This Report
1.5 Methodology & Sources of Information
1.5.1 Research Methodology
1.5.2 Research Process
1.5.3 Base Year
1.5.4 Report Assumptions & Caveats
2 Global Semiconductor Memory Overall Market Size
2.1 Global Semiconductor Memory Market Size: 2024 VS 2031
2.2 Global Semiconductor Memory Market Size, Prospects & Forecasts: 2026-2034
2.3 Global Semiconductor Memory Sales: 2026-2034
3 Company Landscape
3.1 Top Semiconductor Memory Players in Global Market
3.2 Top Global Semiconductor Memory Companies Ranked by Revenue
3.3 Global Semiconductor Memory Revenue by Companies
3.4 Global Semiconductor Memory Sales by Companies
3.5 Global Semiconductor Memory Price by Manufacturer (2020-2025)
3.6 Top 3 and Top 5 Semiconductor Memory Companies in Global Market, by Revenue in 2024
3.7 Global Manufacturers Semiconductor Memory Product Type
3.8 Tier 1, Tier 2, and Tier 3 Semiconductor Memory Players in Global Market
3.8.1 List of Global Tier 1 Semiconductor Memory Companies
3.8.2 List of Global Tier 2 and Tier 3 Semiconductor Memory Companies
4 Sights by Product
4.1 Overview
4.1.1 Segment by Type – Global Semiconductor Memory Market Size Markets, 2024 & 2031
4.1.2 DRAM
4.1.3 SRAM
4.1.4 NAND
4.1.5 NOR
4.1.6 Others
4.2 Segment by Type – Global Semiconductor Memory Revenue & Forecasts
4.2.1 Segment by Type – Global Semiconductor Memory Revenue, 2020-2025
4.2.2 Segment by Type – Global Semiconductor Memory Revenue, 2026-2031
4.2.3 Segment by Type – Global Semiconductor Memory Revenue Market Share, 2026-2034
4.3 Segment by Type – Global Semiconductor Memory Sales & Forecasts
4.3.1 Segment by Type – Global Semiconductor Memory Sales, 2020-2025
4.3.2 Segment by Type – Global Semiconductor Memory Sales, 2026-2031
4.3.3 Segment by Type – Global Semiconductor Memory Sales Market Share, 2026-2034
4.4 Segment by Type – Global Semiconductor Memory Price (Manufacturers Selling Prices), 2026-2034
5 Sights by Application
5.1 Overview
5.1.1 Segment by Application – Global Semiconductor Memory Market Size, 2024 & 2031
5.1.2 Mobile Device
5.1.3 Computers
5.1.4 Server
5.1.5 Automotive
5.1.6 Others
5.2 Segment by Application – Global Semiconductor Memory Revenue & Forecasts
5.2.1 Segment by Application – Global Semiconductor Memory Revenue, 2020-2025
5.2.2 Segment by Application – Global Semiconductor Memory Revenue, 2026-2031
5.2.3 Segment by Application – Global Semiconductor Memory Revenue Market Share, 2026-2034
5.3 Segment by Application – Global Semiconductor Memory Sales & Forecasts
5.3.1 Segment by Application – Global Semiconductor Memory Sales, 2020-2025
5.3.2 Segment by Application – Global Semiconductor Memory Sales, 2026-2031
5.3.3 Segment by Application – Global Semiconductor Memory Sales Market Share, 2026-2034
5.4 Segment by Application – Global Semiconductor Memory Price (Manufacturers Selling Prices), 2026-2034
6 Sights by Region
6.1 By Region – Global Semiconductor Memory Market Size, 2024 & 2031
6.2 By Region – Global Semiconductor Memory Revenue & Forecasts
6.2.1 By Region – Global Semiconductor Memory Revenue, 2020-2025
6.2.2 By Region – Global Semiconductor Memory Revenue, 2026-2031
6.2.3 By Region – Global Semiconductor Memory Revenue Market Share, 2026-2034
6.3 By Region – Global Semiconductor Memory Sales & Forecasts
6.3.1 By Region – Global Semiconductor Memory Sales, 2020-2025
6.3.2 By Region – Global Semiconductor Memory Sales, 2026-2031
6.3.3 By Region – Global Semiconductor Memory Sales Market Share, 2026-2034
6.4 North America
6.4.1 By Country – North America Semiconductor Memory Revenue, 2026-2034
6.4.2 By Country – North America Semiconductor Memory Sales, 2026-2034
6.4.3 United States Semiconductor Memory Market Size, 2026-2034
6.4.4 Canada Semiconductor Memory Market Size, 2026-2034
6.4.5 Mexico Semiconductor Memory Market Size, 2026-2034
6.5 Europe
6.5.1 By Country – Europe Semiconductor Memory Revenue, 2026-2034
6.5.2 By Country – Europe Semiconductor Memory Sales, 2026-2034
6.5.3 Germany Semiconductor Memory Market Size, 2026-2034
6.5.4 France Semiconductor Memory Market Size, 2026-2034
6.5.5 U.K. Semiconductor Memory Market Size, 2026-2034
6.5.6 Italy Semiconductor Memory Market Size, 2026-2034
6.5.7 Russia Semiconductor Memory Market Size, 2026-2034
6.5.8 Nordic Countries Semiconductor Memory Market Size, 2026-2034
6.5.9 Benelux Semiconductor Memory Market Size, 2026-2034
6.6 Asia
6.6.1 By Region – Asia Semiconductor Memory Revenue, 2026-2034
6.6.2 By Region – Asia Semiconductor Memory Sales, 2026-2034
6.6.3 China Semiconductor Memory Market Size, 2026-2034
6.6.4 Japan Semiconductor Memory Market Size, 2026-2034
6.6.5 South Korea Semiconductor Memory Market Size, 2026-2034
6.6.6 Southeast Asia Semiconductor Memory Market Size, 2026-2034
6.6.7 India Semiconductor Memory Market Size, 2026-2034
6.7 South America
6.7.1 By Country – South America Semiconductor Memory Revenue, 2026-2034
6.7.2 By Country – South America Semiconductor Memory Sales, 2026-2034
6.7.3 Brazil Semiconductor Memory Market Size, 2026-2034
6.7.4 Argentina Semiconductor Memory Market Size, 2026-2034
6.8 Middle East & Africa
6.8.1 By Country – Middle East & Africa Semiconductor Memory Revenue, 2026-2034
6.8.2 By Country – Middle East & Africa Semiconductor Memory Sales, 2026-2034
6.8.3 Turkey Semiconductor Memory Market Size, 2026-2034
6.8.4 Israel Semiconductor Memory Market Size, 2026-2034
6.8.5 Saudi Arabia Semiconductor Memory Market Size, 2026-2034
6.8.6 UAE Semiconductor Memory Market Size, 2026-2034
7 Manufacturers & Brands Profiles
7.1 Samsung
7.1.1 Samsung Company Summary
7.1.2 Samsung Business Overview
7.1.3 Samsung Semiconductor Memory Major Product Offerings
7.1.4 Samsung Semiconductor Memory Sales and Revenue in Global (2020-2025)
7.1.5 Samsung Key News & Latest Developments
7.2 SK Hynix
7.2.1 SK Hynix Company Summary
7.2.2 SK Hynix Business Overview
7.2.3 SK Hynix Semiconductor Memory Major Product Offerings
7.2.4 SK Hynix Semiconductor Memory Sales and Revenue in Global (2020-2025)
7.2.5 SK Hynix Key News & Latest Developments
7.3 Micron
7.3.1 Micron Company Summary
7.3.2 Micron Business Overview
7.3.3 Micron Semiconductor Memory Major Product Offerings
7.3.4 Micron Semiconductor Memory Sales and Revenue in Global (2020-2025)
7.3.5 Micron Key News & Latest Developments
7.4 Kioxia
7.4.1 Kioxia Company Summary
7.4.2 Kioxia Business Overview
7.4.3 Kioxia Semiconductor Memory Major Product Offerings
7.4.4 Kioxia Semiconductor Memory Sales and Revenue in Global (2020-2025)
7.4.5 Kioxia Key News & Latest Developments
7.5 Western Digital
7.5.1 Western Digital Company Summary
7.5.2 Western Digital Business Overview
7.5.3 Western Digital Semiconductor Memory Major Product Offerings
7.5.4 Western Digital Semiconductor Memory Sales and Revenue in Global (2020-2025)
7.5.5 Western Digital Key News & Latest Developments
7.6 Intel
7.6.1 Intel Company Summary
7.6.2 Intel Business Overview
7.6.3 Intel Semiconductor Memory Major Product Offerings
7.6.4 Intel Semiconductor Memory Sales and Revenue in Global (2020-2025)
7.6.5 Intel Key News & Latest Developments
7.7 Nanya
7.7.1 Nanya Company Summary
7.7.2 Nanya Business Overview
7.7.3 Nanya Semiconductor Memory Major Product Offerings
7.7.4 Nanya Semiconductor Memory Sales and Revenue in Global (2020-2025)
7.7.5 Nanya Key News & Latest Developments
7.8 Winbond
7.8.1 Winbond Company Summary
7.8.2 Winbond Business Overview
7.8.3 Winbond Semiconductor Memory Major Product Offerings
7.8.4 Winbond Semiconductor Memory Sales and Revenue in Global (2020-2025)
7.8.5 Winbond Key News & Latest Developments
7.9 YMTC
7.9.1 YMTC Company Summary
7.9.2 YMTC Business Overview
7.9.3 YMTC Semiconductor Memory Major Product Offerings
7.9.4 YMTC Semiconductor Memory Sales and Revenue in Global (2020-2025)
7.9.5 YMTC Key News & Latest Developments
8 Global Semiconductor Memory Production Capacity, Analysis
8.1 Global Semiconductor Memory Production Capacity, 2026-2034
8.2 Semiconductor Memory Production Capacity of Key Manufacturers in Global Market
8.3 Global Semiconductor Memory Production by Region
9 Key Market Trends, Opportunity, Drivers and Restraints
9.1 Market Opportunities & Trends
9.2 Market Drivers
9.3 Market Restraints
10 Semiconductor Memory Supply Chain Analysis
10.1 Semiconductor Memory Industry Value Chain
10.2 Semiconductor Memory Upstream Market
10.3 Semiconductor Memory Downstream and Clients
10.4 Marketing Channels Analysis
10.4.1 Marketing Channels
10.4.2 Semiconductor Memory Distributors and Sales Agents in Global
11 Conclusion
12 Appendix
12.1 Note
12.2 Examples of Clients
12.3 DisclaimerList of Tables
Table 1. Key Players of Semiconductor Memory in Global Market
Table 2. Top Semiconductor Memory Players in Global Market, Ranking by Revenue (2024)
Table 3. Global Semiconductor Memory Revenue by Companies, (US$, Mn), 2020-2025
Table 4. Global Semiconductor Memory Revenue Share by Companies, 2020-2025
Table 5. Global Semiconductor Memory Sales by Companies, (M Units), 2020-2025
Table 6. Global Semiconductor Memory Sales Share by Companies, 2020-2025
Table 7. Key Manufacturers Semiconductor Memory Price (2020-2025) & (US$/Unit)
Table 8. Global Manufacturers Semiconductor Memory Product Type
Table 9. List of Global Tier 1 Semiconductor Memory Companies, Revenue (US$, Mn) in 2024 and Market Share
Table 10. List of Global Tier 2 and Tier 3 Semiconductor Memory Companies, Revenue (US$, Mn) in 2024 and Market Share
Table 11. Segment by Type – Global Semiconductor Memory Revenue, (US$, Mn), 2024 & 2031
Table 12. Segment by Type – Global Semiconductor Memory Revenue (US$, Mn), 2020-2025
Table 13. Segment by Type – Global Semiconductor Memory Revenue (US$, Mn), 2026-2031
Table 14. Segment by Type – Global Semiconductor Memory Sales (M Units), 2020-2025
Table 15. Segment by Type – Global Semiconductor Memory Sales (M Units), 2026-2031
Table 16. Segment by Application – Global Semiconductor Memory Revenue, (US$, Mn), 2024 & 2031
Table 17. Segment by Application – Global Semiconductor Memory Revenue, (US$, Mn), 2020-2025
Table 18. Segment by Application – Global Semiconductor Memory Revenue, (US$, Mn), 2026-2031
Table 19. Segment by Application – Global Semiconductor Memory Sales, (M Units), 2020-2025
Table 20. Segment by Application – Global Semiconductor Memory Sales, (M Units), 2026-2031
Table 21. By Region – Global Semiconductor Memory Revenue, (US$, Mn), 2025-2031
Table 22. By Region – Global Semiconductor Memory Revenue, (US$, Mn), 2020-2025
Table 23. By Region – Global Semiconductor Memory Revenue, (US$, Mn), 2026-2031
Table 24. By Region – Global Semiconductor Memory Sales, (M Units), 2020-2025
Table 25. By Region – Global Semiconductor Memory Sales, (M Units), 2026-2031
Table 26. By Country – North America Semiconductor Memory Revenue, (US$, Mn), 2020-2025
Table 27. By Country – North America Semiconductor Memory Revenue, (US$, Mn), 2026-2031
Table 28. By Country – North America Semiconductor Memory Sales, (M Units), 2020-2025
Table 29. By Country – North America Semiconductor Memory Sales, (M Units), 2026-2031
Table 30. By Country – Europe Semiconductor Memory Revenue, (US$, Mn), 2020-2025
Table 31. By Country – Europe Semiconductor Memory Revenue, (US$, Mn), 2026-2031
Table 32. By Country – Europe Semiconductor Memory Sales, (M Units), 2020-2025
Table 33. By Country – Europe Semiconductor Memory Sales, (M Units), 2026-2031
Table 34. By Region – Asia Semiconductor Memory Revenue, (US$, Mn), 2020-2025
Table 35. By Region – Asia Semiconductor Memory Revenue, (US$, Mn), 2026-2031
Table 36. By Region – Asia Semiconductor Memory Sales, (M Units), 2020-2025
Table 37. By Region – Asia Semiconductor Memory Sales, (M Units), 2026-2031
Table 38. By Country – South America Semiconductor Memory Revenue, (US$, Mn), 2020-2025
Table 39. By Country – South America Semiconductor Memory Revenue, (US$, Mn), 2026-2031
Table 40. By Country – South America Semiconductor Memory Sales, (M Units), 2020-2025
Table 41. By Country – South America Semiconductor Memory Sales, (M Units), 2026-2031
Table 42. By Country – Middle East & Africa Semiconductor Memory Revenue, (US$, Mn), 2020-2025
Table 43. By Country – Middle East & Africa Semiconductor Memory Revenue, (US$, Mn), 2026-2031
Table 44. By Country – Middle East & Africa Semiconductor Memory Sales, (M Units), 2020-2025
Table 45. By Country – Middle East & Africa Semiconductor Memory Sales, (M Units), 2026-2031
Table 46. Samsung Company Summary
Table 47. Samsung Semiconductor Memory Product Offerings
Table 48. Samsung Semiconductor Memory Sales (M Units), Revenue (US$, Mn) and Average Price (US$/Unit) & (2020-2025)
Table 49. Samsung Key News & Latest Developments
Table 50. SK Hynix Company Summary
Table 51. SK Hynix Semiconductor Memory Product Offerings
Table 52. SK Hynix Semiconductor Memory Sales (M Units), Revenue (US$, Mn) and Average Price (US$/Unit) & (2020-2025)
Table 53. SK Hynix Key News & Latest Developments
Table 54. Micron Company Summary
Table 55. Micron Semiconductor Memory Product Offerings
Table 56. Micron Semiconductor Memory Sales (M Units), Revenue (US$, Mn) and Average Price (US$/Unit) & (2020-2025)
Table 57. Micron Key News & Latest Developments
Table 58. Kioxia Company Summary
Table 59. Kioxia Semiconductor Memory Product Offerings
Table 60. Kioxia Semiconductor Memory Sales (M Units), Revenue (US$, Mn) and Average Price (US$/Unit) & (2020-2025)
Table 61. Kioxia Key News & Latest Developments
Table 62. Western Digital Company Summary
Table 63. Western Digital Semiconductor Memory Product Offerings
Table 64. Western Digital Semiconductor Memory Sales (M Units), Revenue (US$, Mn) and Average Price (US$/Unit) & (2020-2025)
Table 65. Western Digital Key News & Latest Developments
Table 66. Intel Company Summary
Table 67. Intel Semiconductor Memory Product Offerings
Table 68. Intel Semiconductor Memory Sales (M Units), Revenue (US$, Mn) and Average Price (US$/Unit) & (2020-2025)
Table 69. Intel Key News & Latest Developments
Table 70. Nanya Company Summary
Table 71. Nanya Semiconductor Memory Product Offerings
Table 72. Nanya Semiconductor Memory Sales (M Units), Revenue (US$, Mn) and Average Price (US$/Unit) & (2020-2025)
Table 73. Nanya Key News & Latest Developments
Table 74. Winbond Company Summary
Table 75. Winbond Semiconductor Memory Product Offerings
Table 76. Winbond Semiconductor Memory Sales (M Units), Revenue (US$, Mn) and Average Price (US$/Unit) & (2020-2025)
Table 77. Winbond Key News & Latest Developments
Table 78. YMTC Company Summary
Table 79. YMTC Semiconductor Memory Product Offerings
Table 80. YMTC Semiconductor Memory Sales (M Units), Revenue (US$, Mn) and Average Price (US$/Unit) & (2020-2025)
Table 81. YMTC Key News & Latest Developments
Table 82. Semiconductor Memory Capacity of Key Manufacturers in Global Market, 2023-2025 (M Units)
Table 83. Global Semiconductor Memory Capacity Market Share of Key Manufacturers, 2023-2025
Table 84. Global Semiconductor Memory Production by Region, 2020-2025 (M Units)
Table 85. Global Semiconductor Memory Production by Region, 2026-2031 (M Units)
Table 86. Semiconductor Memory Market Opportunities & Trends in Global Market
Table 87. Semiconductor Memory Market Drivers in Global Market
Table 88. Semiconductor Memory Market Restraints in Global Market
Table 89. Semiconductor Memory Raw Materials
Table 90. Semiconductor Memory Raw Materials Suppliers in Global Market
Table 91. Typical Semiconductor Memory Downstream
Table 92. Semiconductor Memory Downstream Clients in Global Market
Table 93. Semiconductor Memory Distributors and Sales Agents in Global Market

List of Figures
Figure 1. Semiconductor Memory Product Picture
Figure 2. Semiconductor Memory Segment by Type in 2024
Figure 3. Semiconductor Memory Segment by Application in 2024
Figure 4. Global Semiconductor Memory Market Overview: 2024
Figure 5. Key Caveats
Figure 6. Global Semiconductor Memory Market Size: 2024 VS 2031 (US$, Mn)
Figure 7. Global Semiconductor Memory Revenue: 2026-2034 (US$, Mn)
Figure 8. Semiconductor Memory Sales in Global Market: 2026-2034 (M Units)
Figure 9. The Top 3 and 5 Players Market Share by Semiconductor Memory Revenue in 2024
Figure 10. Segment by Type – Global Semiconductor Memory Revenue, (US$, Mn), 2024 & 2031
Figure 11. Segment by Type – Global Semiconductor Memory Revenue Market Share, 2026-2034
Figure 12. Segment by Type – Global Semiconductor Memory Sales Market Share, 2026-2034
Figure 13. Segment by Type – Global Semiconductor Memory Price (US$/Unit), 2026-2034
Figure 14. Segment by Application – Global Semiconductor Memory Revenue, (US$, Mn), 2024 & 2031
Figure 15. Segment by Application – Global Semiconductor Memory Revenue Market Share, 2026-2034
Figure 16. Segment by Application – Global Semiconductor Memory Sales Market Share, 2026-2034
Figure 17. Segment by Application -Global Semiconductor Memory Price (US$/Unit), 2026-2034
Figure 18. By Region – Global Semiconductor Memory Revenue, (US$, Mn), 2025 & 2031
Figure 19. By Region – Global Semiconductor Memory Revenue Market Share, 2020 VS 2024 VS 2031
Figure 20. By Region – Global Semiconductor Memory Revenue Market Share, 2026-2034
Figure 21. By Region – Global Semiconductor Memory Sales Market Share, 2026-2034
Figure 22. By Country – North America Semiconductor Memory Revenue Market Share, 2026-2034
Figure 23. By Country – North America Semiconductor Memory Sales Market Share, 2026-2034
Figure 24. United States Semiconductor Memory Revenue, (US$, Mn), 2026-2034
Figure 25. Canada Semiconductor Memory Revenue, (US$, Mn), 2026-2034
Figure 26. Mexico Semiconductor Memory Revenue, (US$, Mn), 2026-2034
Figure 27. By Country – Europe Semiconductor Memory Revenue Market Share, 2026-2034
Figure 28. By Country – Europe Semiconductor Memory Sales Market Share, 2026-2034
Figure 29. Germany Semiconductor Memory Revenue, (US$, Mn), 2026-2034
Figure 30. France Semiconductor Memory Revenue, (US$, Mn), 2026-2034
Figure 31. U.K. Semiconductor Memory Revenue, (US$, Mn), 2026-2034
Figure 32. Italy Semiconductor Memory Revenue, (US$, Mn), 2026-2034
Figure 33. Russia Semiconductor Memory Revenue, (US$, Mn), 2026-2034
Figure 34. Nordic Countries Semiconductor Memory Revenue, (US$, Mn), 2026-2034
Figure 35. Benelux Semiconductor Memory Revenue, (US$, Mn), 2026-2034
Figure 36. By Region – Asia Semiconductor Memory Revenue Market Share, 2026-2034
Figure 37. By Region – Asia Semiconductor Memory Sales Market Share, 2026-2034
Figure 38. China Semiconductor Memory Revenue, (US$, Mn), 2026-2034
Figure 39. Japan Semiconductor Memory Revenue, (US$, Mn), 2026-2034
Figure 40. South Korea Semiconductor Memory Revenue, (US$, Mn), 2026-2034
Figure 41. Southeast Asia Semiconductor Memory Revenue, (US$, Mn), 2026-2034
Figure 42. India Semiconductor Memory Revenue, (US$, Mn), 2026-2034
Figure 43. By Country – South America Semiconductor Memory Revenue Market Share, 2026-2034
Figure 44. By Country – South America Semiconductor Memory Sales, Market Share, 2026-2034
Figure 45. Brazil Semiconductor Memory Revenue, (US$, Mn), 2026-2034
Figure 46. Argentina Semiconductor Memory Revenue, (US$, Mn), 2026-2034
Figure 47. By Country – Middle East & Africa Semiconductor Memory Revenue, Market Share, 2026-2034
Figure 48. By Country – Middle East & Africa Semiconductor Memory Sales, Market Share, 2026-2034
Figure 49. Turkey Semiconductor Memory Revenue, (US$, Mn), 2026-2034
Figure 50. Israel Semiconductor Memory Revenue, (US$, Mn), 2026-2034
Figure 51. Saudi Arabia Semiconductor Memory Revenue, (US$, Mn), 2026-2034
Figure 52. UAE Semiconductor Memory Revenue, (US$, Mn), 2026-2034
Figure 53. Global Semiconductor Memory Production Capacity (M Units), 2026-2034
Figure 54. The Percentage of Production Semiconductor Memory by Region, 2024 VS 2031
Figure 55. Semiconductor Memory Industry Value Chain
Figure 56. Marketing Channels