Semiconductor Gas Abatement Systems Market, Size, Trends, Business Strategies 2025-2032

Global Semiconductor Gas Abatement Systems market size was estimated at USD 1379 million in 2023 and is projected to reach USD 2704.43 million by 2030, exhibiting a CAGR of 10.10% during the forecast period.

PDF Icon Download Sample Report PDF
  • Quick Dispatch

    All Orders

  • Secure Payment

    100% Secure Payment

Compare

$1,500.00$4,250.00

Clear

Semiconductor Gas Abatement Systems Market Overview

The semiconductor industry uses gases that are toxic, flammable and even harmful for the environment, but also for humans. For example, in the production of microchips. According to national legislation, these gases have to be abated. This means that they are reduced below the respective threshold limit value (TLV). Different gases require different treatment technologies, such as thermal, wet or even a combination of both technologies. The process exhaust gases can then be released into the atmosphere, without harming nature, for a greener world.

This report provides a deep insight into the global Semiconductor Gas Abatement Systems market covering all its essential aspects. This ranges from a macro overview of the market to micro details of the market size, competitive landscape, development trend, niche market, key market drivers and challenges, SWOT analysis, value chain analysis, etc.

The analysis helps the reader to shape the competition within the industries and strategies for the competitive environment to enhance the potential profit. Furthermore, it provides a simple framework for evaluating and accessing the position of the business organization. The report structure also focuses on the competitive landscape of the Global Semiconductor Gas Abatement Systems Market, this report introduces in detail the market share, market performance, product situation, operation situation, etc. of the main players, which helps the readers in the industry to identify the main competitors and deeply understand the competition pattern of the market.
In a word, this report is a must-read for industry players, investors, researchers, consultants, business strategists, and all those who have any kind of stake or are planning to foray into the Semiconductor Gas Abatement Systems market in any manner.

Semiconductor Gas Abatement Systems Market Analysis:

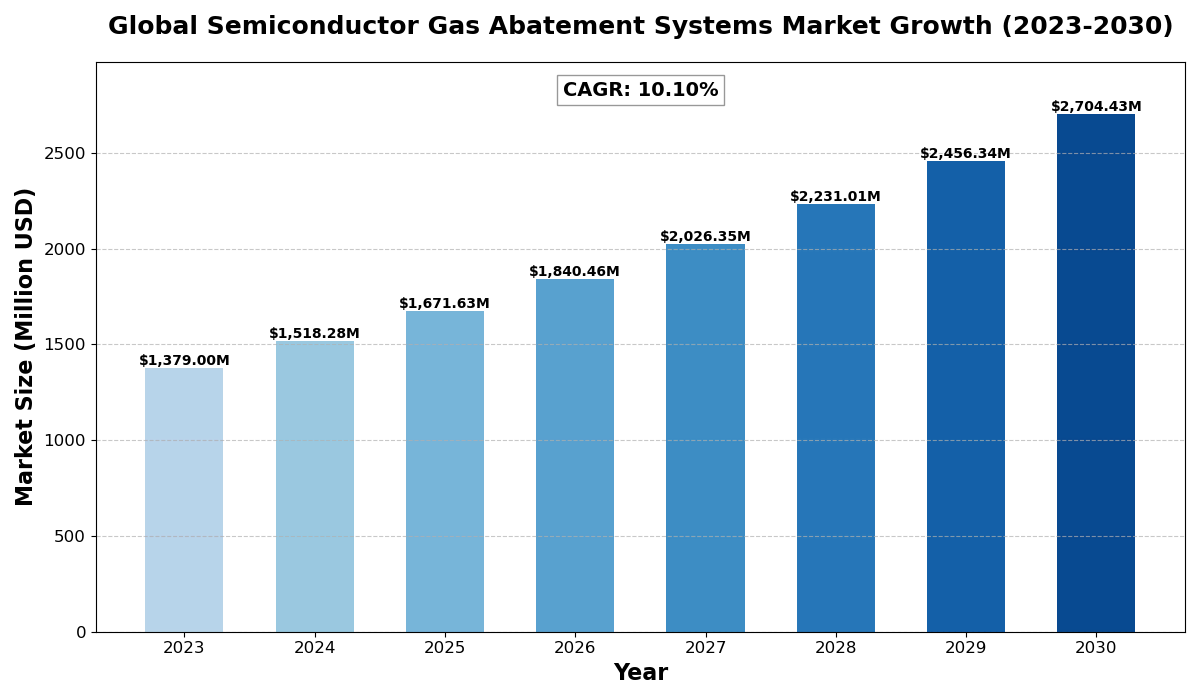
The global Semiconductor Gas Abatement Systems market size was estimated at USD 1379 million in 2023 and is projected to reach USD 2704.43 million by 2030, exhibiting a CAGR of 10.10% during the forecast period.

North America Semiconductor Gas Abatement Systems market size was USD 359.33 million in 2023, at a CAGR of 8.66% during the forecast period of 2025 through 2030.

Semiconductor Gas Abatement Systems Key Market Trends  

  1. Stricter Environmental Regulations
    Governments worldwide are enforcing stricter emission control regulations, compelling semiconductor manufacturers to adopt advanced gas abatement solutions.

  2. Growing Semiconductor Manufacturing Expansion
    The rising demand for semiconductor chips in AI, 5G, and automotive applications is driving the expansion of fabrication plants, boosting the need for gas abatement systems.

  3. Integration of Smart Monitoring Systems
    Advanced semiconductor gas abatement systems are increasingly incorporating IoT-based monitoring and automation to enhance efficiency and compliance.

  4. Shift Toward Sustainable Manufacturing
    The industry is focusing on eco-friendly gas treatment technologies, such as plasma wet abatement, to reduce greenhouse gas emissions.

  5. Increasing Adoption of Dry and Plasma-Based Systems
    Compared to traditional wet-based systems, dry and plasma-based abatement technologies are gaining popularity due to their higher efficiency in handling toxic gases.

Semiconductor Gas Abatement Systems Market Regional Analysis :

semi insight

  • North America:Strong demand driven by EVs, 5G infrastructure, and renewable energy, with the U.S. leading the market.
  • Europe:Growth fueled by automotive electrification, renewable energy, and strong regulatory support, with Germany as a key player.
  • Asia-Pacific:Dominates the market due to large-scale manufacturing in China and Japan, with growing demand from EVs, 5G, and semiconductors.
  • South America:Emerging market, driven by renewable energy and EV adoption, with Brazil leading growth.
  • Middle East & Africa:Gradual growth, mainly due to investments in renewable energy and EV infrastructure, with Saudi Arabia and UAE as key contributors.

Semiconductor Gas Abatement Systems Market Segmentation

The research report includes specific segments by region (country), manufacturers, Type, and Application. Market segmentation creates subsets of a market based on product type, end-user or application, Geographic, and other factors. By understanding the market segments, the decision-maker can leverage this targeting in the product, sales, and marketing strategies. Market segments can power your product development cycles by informing how you create product offerings for different segments.

Key Company

  • Ebara
  • Busch Vacuum Solutions
  • GST (Global Standard Technology)
  • Edwards Vacuum
  • CS Clean Solutions
  • DAS Environmental Expert
  • CSK (Atlas Copco)
  • Ecosys Abatement
  • Highvac
  • Nippon Sanso
  • Showa Denko
  • Beijing Jingyi Automation Equipment

Market Segmentation (by Type)

  • Combustion-wash Type
  • Dry Type
  • Catalytic Type
  • Wet Type
  • Plasma Wet Type
  • Others

Market Segmentation (by Application)

  • Plasma Etching
  • CVD
  • ALD
  • EPI
  • Ion Implantation
  • Others

Drivers

  • Rising Semiconductor Production
    The growing demand for consumer electronics, automotive chips, and AI processors is increasing the need for gas abatement solutions in chip manufacturing.

  • Stringent Emission Regulations
    Governments worldwide are enforcing tighter environmental laws to reduce hazardous gas emissions, accelerating the adoption of advanced abatement technologies.

  • Advancements in Abatement Technologies
    Innovations in dry, plasma, and catalytic abatement systems are improving efficiency and reducing operational costs for semiconductor manufacturers.

Restraints

  • High Initial Investment Costs
    Advanced gas abatement systems require substantial capital expenditure, which may limit adoption by small and mid-sized semiconductor manufacturers.

  • Complex Maintenance Requirements
    Regular maintenance and monitoring of gas abatement systems are essential, adding to operational costs and complexity.

  • Limited Standardization Across Regions
    Variability in environmental regulations across different countries poses challenges for uniform adoption of gas abatement solutions.

Opportunities

  • Expansion of Semiconductor Foundries
    Increased investments in semiconductor manufacturing, particularly in Asia-Pacific and North America, create a growing market for gas abatement systems.

  • Development of Cost-Effective Solutions
    Research into more affordable and efficient abatement technologies can help reduce barriers to adoption, especially for emerging semiconductor markets.

  • Government Incentives for Green Manufacturing
    Financial support and incentives for sustainable semiconductor production encourage investment in advanced gas abatement systems.

Challenges

  • Evolving Semiconductor Manufacturing Processes
    Rapid technological changes in semiconductor fabrication require continuous updates and adaptation of gas abatement technologies.

  • Supply Chain Constraints
    Disruptions in the supply of essential components for abatement systems can impact production and installation timelines.

  • Balancing Efficiency and Sustainability
    Developing high-performance gas abatement systems while maintaining sustainability and cost-effectiveness remains a key challenge for manufacturers.


Key Benefits of This Market Research:

  • Industry drivers, restraints, and opportunities covered in the study
  • Neutral perspective on the market performance
  • Recent industry trends and developments
  • Competitive landscape & strategies of key players
  • Potential & niche segments and regions exhibiting promising growth covered
  • Historical, current, and projected market size, in terms of value
  • In-depth analysis of the Semiconductor Gas Abatement Systems Market
  • Overview of the regional outlook of the Semiconductor Gas Abatement Systems Market:

Key Reasons to Buy this Report:

  • Access to date statistics compiled by our researchers. These provide you with historical and forecast data, which is analyzed to tell you why your market is set to change
  • This enables you to anticipate market changes to remain ahead of your competitors
  • You will be able to copy data from the Excel spreadsheet straight into your marketing plans, business presentations, or other strategic documents
  • The concise analysis, clear graph, and table format will enable you to pinpoint the information you require quickly
  • Provision of market value data for each segment and sub-segment
  • Indicates the region and segment that is expected to witness the fastest growth as well as to dominate the market
  • Provides insight into the market through Value Chain
  • Market dynamics scenario, along with growth opportunities of the market in the years to come
  • 6-month post-sales analyst support

Customization of the Report
In case of any queries or customization requirements, please connect with our sales team, who will ensure that your requirements are met.

FAQs

What is driving the growth of the semiconductor gas abatement systems market?
The increasing demand for semiconductors, strict environmental regulations, and advancements in gas treatment technologies are key growth drivers.


Which industries primarily use semiconductor gas abatement systems?
These systems are mainly used in semiconductor fabrication processes, including plasma etching, chemical vapor deposition (CVD), and ion implantation.


Who are the leading players in the semiconductor gas abatement systems market?
Key companies include Ebara, Busch Vacuum Solutions, Edwards Vacuum, CS Clean Solutions, DAS Environmental Expert, and Atlas Copco (CSK).


What challenges do semiconductor manufacturers face in adopting gas abatement systems?
High costs, complex maintenance, and regional variations in environmental regulations are major challenges.


What is the market outlook for semiconductor gas abatement systems?
The global market was valued at USD 1,379 million in 2023 and is projected to reach USD 2,704.43 million by 2030, growing at a CAGR of 10.10

Semiconductor Gas Abatement Systems Market, Size, Trends, Business Strategies 2025-2032

Get Sample Report PDF for Exclusive Insights

Report Sample Includes

  • Table of Contents
  • List of Tables & Figures
  • Charts, Research Methodology, and more...
PDF Icon Download Sample Report PDF

Download Sample Report

Table of Content

Table of Contents
1 Research Methodology and Statistical Scope
1.1 Market Definition and Statistical Scope of Semiconductor Gas Abatement Systems
1.2 Key Market Segments
1.2.1 Semiconductor Gas Abatement Systems Segment by Type
1.2.2 Semiconductor Gas Abatement Systems Segment by Application
1.3 Methodology & Sources of Information
1.3.1 Research Methodology
1.3.2 Research Process
1.3.3 Market Breakdown and Data Triangulation
1.3.4 Base Year
1.3.5 Report Assumptions & Caveats
2 Semiconductor Gas Abatement Systems Market Overview
2.1 Global Market Overview
2.1.1 Global Semiconductor Gas Abatement Systems Market Size (M USD) Estimates and Forecasts (2019-2030)
2.1.2 Global Semiconductor Gas Abatement Systems Sales Estimates and Forecasts (2019-2030)
2.2 Market Segment Executive Summary
2.3 Global Market Size by Region
3 Semiconductor Gas Abatement Systems Market Competitive Landscape
3.1 Global Semiconductor Gas Abatement Systems Sales by Manufacturers (2019-2025)
3.2 Global Semiconductor Gas Abatement Systems Revenue Market Share by Manufacturers (2019-2025)
3.3 Semiconductor Gas Abatement Systems Market Share by Company Type (Tier 1, Tier 2, and Tier 3)
3.4 Global Semiconductor Gas Abatement Systems Average Price by Manufacturers (2019-2025)
3.5 Manufacturers Semiconductor Gas Abatement Systems Sales Sites, Area Served, Product Type
3.6 Semiconductor Gas Abatement Systems Market Competitive Situation and Trends
3.6.1 Semiconductor Gas Abatement Systems Market Concentration Rate
3.6.2 Global 5 and 10 Largest Semiconductor Gas Abatement Systems Players Market Share by Revenue
3.6.3 Mergers & Acquisitions, Expansion
4 Semiconductor Gas Abatement Systems Industry Chain Analysis
4.1 Semiconductor Gas Abatement Systems Industry Chain Analysis
4.2 Market Overview of Key Raw Materials
4.3 Midstream Market Analysis
4.4 Downstream Customer Analysis
5 The Development and Dynamics of Semiconductor Gas Abatement Systems Market
5.1 Key Development Trends
5.2 Driving Factors
5.3 Market Challenges
5.4 Market Restraints
5.5 Industry News
5.5.1 New Product Developments
5.5.2 Mergers & Acquisitions
5.5.3 Expansions
5.5.4 Collaboration/Supply Contracts
5.6 Industry Policies
6 Semiconductor Gas Abatement Systems Market Segmentation by Type
6.1 Evaluation Matrix of Segment Market Development Potential (Type)
6.2 Global Semiconductor Gas Abatement Systems Sales Market Share by Type (2019-2025)
6.3 Global Semiconductor Gas Abatement Systems Market Size Market Share by Type (2019-2025)
6.4 Global Semiconductor Gas Abatement Systems Price by Type (2019-2025)
7 Semiconductor Gas Abatement Systems Market Segmentation by Application
7.1 Evaluation Matrix of Segment Market Development Potential (Application)
7.2 Global Semiconductor Gas Abatement Systems Market Sales by Application (2019-2025)
7.3 Global Semiconductor Gas Abatement Systems Market Size (M USD) by Application (2019-2025)
7.4 Global Semiconductor Gas Abatement Systems Sales Growth Rate by Application (2019-2025)
8 Semiconductor Gas Abatement Systems Market Segmentation by Region
8.1 Global Semiconductor Gas Abatement Systems Sales by Region
8.1.1 Global Semiconductor Gas Abatement Systems Sales by Region
8.1.2 Global Semiconductor Gas Abatement Systems Sales Market Share by Region
8.2 North America
8.2.1 North America Semiconductor Gas Abatement Systems Sales by Country
8.2.2 U.S.
8.2.3 Canada
8.2.4 Mexico
8.3 Europe
8.3.1 Europe Semiconductor Gas Abatement Systems Sales by Country
8.3.2 Germany
8.3.3 France
8.3.4 U.K.
8.3.5 Italy
8.3.6 Russia
8.4 Asia Pacific
8.4.1 Asia Pacific Semiconductor Gas Abatement Systems Sales by Region
8.4.2 China
8.4.3 Japan
8.4.4 South Korea
8.4.5 India
8.4.6 Southeast Asia
8.5 South America
8.5.1 South America Semiconductor Gas Abatement Systems Sales by Country
8.5.2 Brazil
8.5.3 Argentina
8.5.4 Columbia
8.6 Middle East and Africa
8.6.1 Middle East and Africa Semiconductor Gas Abatement Systems Sales by Region
8.6.2 Saudi Arabia
8.6.3 UAE
8.6.4 Egypt
8.6.5 Nigeria
8.6.6 South Africa
9 Key Companies Profile
9.1 Ebara
9.1.1 Ebara Semiconductor Gas Abatement Systems Basic Information
9.1.2 Ebara Semiconductor Gas Abatement Systems Product Overview
9.1.3 Ebara Semiconductor Gas Abatement Systems Product Market Performance
9.1.4 Ebara Business Overview
9.1.5 Ebara Semiconductor Gas Abatement Systems SWOT Analysis
9.1.6 Ebara Recent Developments
9.2 Busch Vacuum Solutions
9.2.1 Busch Vacuum Solutions Semiconductor Gas Abatement Systems Basic Information
9.2.2 Busch Vacuum Solutions Semiconductor Gas Abatement Systems Product Overview
9.2.3 Busch Vacuum Solutions Semiconductor Gas Abatement Systems Product Market Performance
9.2.4 Busch Vacuum Solutions Business Overview
9.2.5 Busch Vacuum Solutions Semiconductor Gas Abatement Systems SWOT Analysis
9.2.6 Busch Vacuum Solutions Recent Developments
9.3 GST (Global Standard Technology)
9.3.1 GST (Global Standard Technology) Semiconductor Gas Abatement Systems Basic Information
9.3.2 GST (Global Standard Technology) Semiconductor Gas Abatement Systems Product Overview
9.3.3 GST (Global Standard Technology) Semiconductor Gas Abatement Systems Product Market Performance
9.3.4 GST (Global Standard Technology) Semiconductor Gas Abatement Systems SWOT Analysis
9.3.5 GST (Global Standard Technology) Business Overview
9.3.6 GST (Global Standard Technology) Recent Developments
9.4 Edwards Vacuum
9.4.1 Edwards Vacuum Semiconductor Gas Abatement Systems Basic Information
9.4.2 Edwards Vacuum Semiconductor Gas Abatement Systems Product Overview
9.4.3 Edwards Vacuum Semiconductor Gas Abatement Systems Product Market Performance
9.4.4 Edwards Vacuum Business Overview
9.4.5 Edwards Vacuum Recent Developments
9.5 CS Clean Solutions
9.5.1 CS Clean Solutions Semiconductor Gas Abatement Systems Basic Information
9.5.2 CS Clean Solutions Semiconductor Gas Abatement Systems Product Overview
9.5.3 CS Clean Solutions Semiconductor Gas Abatement Systems Product Market Performance
9.5.4 CS Clean Solutions Business Overview
9.5.5 CS Clean Solutions Recent Developments
9.6 DAS Environmental Expert
9.6.1 DAS Environmental Expert Semiconductor Gas Abatement Systems Basic Information
9.6.2 DAS Environmental Expert Semiconductor Gas Abatement Systems Product Overview
9.6.3 DAS Environmental Expert Semiconductor Gas Abatement Systems Product Market Performance
9.6.4 DAS Environmental Expert Business Overview
9.6.5 DAS Environmental Expert Recent Developments
9.7 CSK (Atlas Copco)
9.7.1 CSK (Atlas Copco) Semiconductor Gas Abatement Systems Basic Information
9.7.2 CSK (Atlas Copco) Semiconductor Gas Abatement Systems Product Overview
9.7.3 CSK (Atlas Copco) Semiconductor Gas Abatement Systems Product Market Performance
9.7.4 CSK (Atlas Copco) Business Overview
9.7.5 CSK (Atlas Copco) Recent Developments
9.8 Ecosys Abatement
9.8.1 Ecosys Abatement Semiconductor Gas Abatement Systems Basic Information
9.8.2 Ecosys Abatement Semiconductor Gas Abatement Systems Product Overview
9.8.3 Ecosys Abatement Semiconductor Gas Abatement Systems Product Market Performance
9.8.4 Ecosys Abatement Business Overview
9.8.5 Ecosys Abatement Recent Developments
9.9 Highvac
9.9.1 Highvac Semiconductor Gas Abatement Systems Basic Information
9.9.2 Highvac Semiconductor Gas Abatement Systems Product Overview
9.9.3 Highvac Semiconductor Gas Abatement Systems Product Market Performance
9.9.4 Highvac Business Overview
9.9.5 Highvac Recent Developments
9.10 Nippon Sanso
9.10.1 Nippon Sanso Semiconductor Gas Abatement Systems Basic Information
9.10.2 Nippon Sanso Semiconductor Gas Abatement Systems Product Overview
9.10.3 Nippon Sanso Semiconductor Gas Abatement Systems Product Market Performance
9.10.4 Nippon Sanso Business Overview
9.10.5 Nippon Sanso Recent Developments
9.11 Showa Denko
9.11.1 Showa Denko Semiconductor Gas Abatement Systems Basic Information
9.11.2 Showa Denko Semiconductor Gas Abatement Systems Product Overview
9.11.3 Showa Denko Semiconductor Gas Abatement Systems Product Market Performance
9.11.4 Showa Denko Business Overview
9.11.5 Showa Denko Recent Developments
9.12 Beijing Jingyi Automation Equipment
9.12.1 Beijing Jingyi Automation Equipment Semiconductor Gas Abatement Systems Basic Information
9.12.2 Beijing Jingyi Automation Equipment Semiconductor Gas Abatement Systems Product Overview
9.12.3 Beijing Jingyi Automation Equipment Semiconductor Gas Abatement Systems Product Market Performance
9.12.4 Beijing Jingyi Automation Equipment Business Overview
9.12.5 Beijing Jingyi Automation Equipment Recent Developments
10 Semiconductor Gas Abatement Systems Market Forecast by Region
10.1 Global Semiconductor Gas Abatement Systems Market Size Forecast
10.2 Global Semiconductor Gas Abatement Systems Market Forecast by Region
10.2.1 North America Market Size Forecast by Country
10.2.2 Europe Semiconductor Gas Abatement Systems Market Size Forecast by Country
10.2.3 Asia Pacific Semiconductor Gas Abatement Systems Market Size Forecast by Region
10.2.4 South America Semiconductor Gas Abatement Systems Market Size Forecast by Country
10.2.5 Middle East and Africa Forecasted Consumption of Semiconductor Gas Abatement Systems by Country
11 Forecast Market by Type and by Application (2025-2030)
11.1 Global Semiconductor Gas Abatement Systems Market Forecast by Type (2025-2030)
11.1.1 Global Forecasted Sales of Semiconductor Gas Abatement Systems by Type (2025-2030)
11.1.2 Global Semiconductor Gas Abatement Systems Market Size Forecast by Type (2025-2030)
11.1.3 Global Forecasted Price of Semiconductor Gas Abatement Systems by Type (2025-2030)
11.2 Global Semiconductor Gas Abatement Systems Market Forecast by Application (2025-2030)
11.2.1 Global Semiconductor Gas Abatement Systems Sales (K Units) Forecast by Application
11.2.2 Global Semiconductor Gas Abatement Systems Market Size (M USD) Forecast by Application (2025-2030)
12 Conclusion and Key FindingsList of Tables
Table 1. Introduction of the Type
Table 2. Introduction of the Application
Table 3. Market Size (M USD) Segment Executive Summary
Table 4. Semiconductor Gas Abatement Systems Market Size Comparison by Region (M USD)
Table 5. Global Semiconductor Gas Abatement Systems Sales (K Units) by Manufacturers (2019-2025)
Table 6. Global Semiconductor Gas Abatement Systems Sales Market Share by Manufacturers (2019-2025)
Table 7. Global Semiconductor Gas Abatement Systems Revenue (M USD) by Manufacturers (2019-2025)
Table 8. Global Semiconductor Gas Abatement Systems Revenue Share by Manufacturers (2019-2025)
Table 9. Company Type (Tier 1, Tier 2, and Tier 3) & (based on the Revenue in Semiconductor Gas Abatement Systems as of 2022)
Table 10. Global Market Semiconductor Gas Abatement Systems Average Price (USD/Unit) of Key Manufacturers (2019-2025)
Table 11. Manufacturers Semiconductor Gas Abatement Systems Sales Sites and Area Served
Table 12. Manufacturers Semiconductor Gas Abatement Systems Product Type
Table 13. Global Semiconductor Gas Abatement Systems Manufacturers Market Concentration Ratio (CR5 and HHI)
Table 14. Mergers & Acquisitions, Expansion Plans
Table 15. Industry Chain Map of Semiconductor Gas Abatement Systems
Table 16. Market Overview of Key Raw Materials
Table 17. Midstream Market Analysis
Table 18. Downstream Customer Analysis
Table 19. Key Development Trends
Table 20. Driving Factors
Table 21. Semiconductor Gas Abatement Systems Market Challenges
Table 22. Global Semiconductor Gas Abatement Systems Sales by Type (K Units)
Table 23. Global Semiconductor Gas Abatement Systems Market Size by Type (M USD)
Table 24. Global Semiconductor Gas Abatement Systems Sales (K Units) by Type (2019-2025)
Table 25. Global Semiconductor Gas Abatement Systems Sales Market Share by Type (2019-2025)
Table 26. Global Semiconductor Gas Abatement Systems Market Size (M USD) by Type (2019-2025)
Table 27. Global Semiconductor Gas Abatement Systems Market Size Share by Type (2019-2025)
Table 28. Global Semiconductor Gas Abatement Systems Price (USD/Unit) by Type (2019-2025)
Table 29. Global Semiconductor Gas Abatement Systems Sales (K Units) by Application
Table 30. Global Semiconductor Gas Abatement Systems Market Size by Application
Table 31. Global Semiconductor Gas Abatement Systems Sales by Application (2019-2025) & (K Units)
Table 32. Global Semiconductor Gas Abatement Systems Sales Market Share by Application (2019-2025)
Table 33. Global Semiconductor Gas Abatement Systems Sales by Application (2019-2025) & (M USD)
Table 34. Global Semiconductor Gas Abatement Systems Market Share by Application (2019-2025)
Table 35. Global Semiconductor Gas Abatement Systems Sales Growth Rate by Application (2019-2025)
Table 36. Global Semiconductor Gas Abatement Systems Sales by Region (2019-2025) & (K Units)
Table 37. Global Semiconductor Gas Abatement Systems Sales Market Share by Region (2019-2025)
Table 38. North America Semiconductor Gas Abatement Systems Sales by Country (2019-2025) & (K Units)
Table 39. Europe Semiconductor Gas Abatement Systems Sales by Country (2019-2025) & (K Units)
Table 40. Asia Pacific Semiconductor Gas Abatement Systems Sales by Region (2019-2025) & (K Units)
Table 41. South America Semiconductor Gas Abatement Systems Sales by Country (2019-2025) & (K Units)
Table 42. Middle East and Africa Semiconductor Gas Abatement Systems Sales by Region (2019-2025) & (K Units)
Table 43. Ebara Semiconductor Gas Abatement Systems Basic Information
Table 44. Ebara Semiconductor Gas Abatement Systems Product Overview
Table 45. Ebara Semiconductor Gas Abatement Systems Sales (K Units), Revenue (M USD), Price (USD/Unit) and Gross Margin (2019-2025)
Table 46. Ebara Business Overview
Table 47. Ebara Semiconductor Gas Abatement Systems SWOT Analysis
Table 48. Ebara Recent Developments
Table 49. Busch Vacuum Solutions Semiconductor Gas Abatement Systems Basic Information
Table 50. Busch Vacuum Solutions Semiconductor Gas Abatement Systems Product Overview
Table 51. Busch Vacuum Solutions Semiconductor Gas Abatement Systems Sales (K Units), Revenue (M USD), Price (USD/Unit) and Gross Margin (2019-2025)
Table 52. Busch Vacuum Solutions Business Overview
Table 53. Busch Vacuum Solutions Semiconductor Gas Abatement Systems SWOT Analysis
Table 54. Busch Vacuum Solutions Recent Developments
Table 55. GST (Global Standard Technology) Semiconductor Gas Abatement Systems Basic Information
Table 56. GST (Global Standard Technology) Semiconductor Gas Abatement Systems Product Overview
Table 57. GST (Global Standard Technology) Semiconductor Gas Abatement Systems Sales (K Units), Revenue (M USD), Price (USD/Unit) and Gross Margin (2019-2025)
Table 58. GST (Global Standard Technology) Semiconductor Gas Abatement Systems SWOT Analysis
Table 59. GST (Global Standard Technology) Business Overview
Table 60. GST (Global Standard Technology) Recent Developments
Table 61. Edwards Vacuum Semiconductor Gas Abatement Systems Basic Information
Table 62. Edwards Vacuum Semiconductor Gas Abatement Systems Product Overview
Table 63. Edwards Vacuum Semiconductor Gas Abatement Systems Sales (K Units), Revenue (M USD), Price (USD/Unit) and Gross Margin (2019-2025)
Table 64. Edwards Vacuum Business Overview
Table 65. Edwards Vacuum Recent Developments
Table 66. CS Clean Solutions Semiconductor Gas Abatement Systems Basic Information
Table 67. CS Clean Solutions Semiconductor Gas Abatement Systems Product Overview
Table 68. CS Clean Solutions Semiconductor Gas Abatement Systems Sales (K Units), Revenue (M USD), Price (USD/Unit) and Gross Margin (2019-2025)
Table 69. CS Clean Solutions Business Overview
Table 70. CS Clean Solutions Recent Developments
Table 71. DAS Environmental Expert Semiconductor Gas Abatement Systems Basic Information
Table 72. DAS Environmental Expert Semiconductor Gas Abatement Systems Product Overview
Table 73. DAS Environmental Expert Semiconductor Gas Abatement Systems Sales (K Units), Revenue (M USD), Price (USD/Unit) and Gross Margin (2019-2025)
Table 74. DAS Environmental Expert Business Overview
Table 75. DAS Environmental Expert Recent Developments
Table 76. CSK (Atlas Copco) Semiconductor Gas Abatement Systems Basic Information
Table 77. CSK (Atlas Copco) Semiconductor Gas Abatement Systems Product Overview
Table 78. CSK (Atlas Copco) Semiconductor Gas Abatement Systems Sales (K Units), Revenue (M USD), Price (USD/Unit) and Gross Margin (2019-2025)
Table 79. CSK (Atlas Copco) Business Overview
Table 80. CSK (Atlas Copco) Recent Developments
Table 81. Ecosys Abatement Semiconductor Gas Abatement Systems Basic Information
Table 82. Ecosys Abatement Semiconductor Gas Abatement Systems Product Overview
Table 83. Ecosys Abatement Semiconductor Gas Abatement Systems Sales (K Units), Revenue (M USD), Price (USD/Unit) and Gross Margin (2019-2025)
Table 84. Ecosys Abatement Business Overview
Table 85. Ecosys Abatement Recent Developments
Table 86. Highvac Semiconductor Gas Abatement Systems Basic Information
Table 87. Highvac Semiconductor Gas Abatement Systems Product Overview
Table 88. Highvac Semiconductor Gas Abatement Systems Sales (K Units), Revenue (M USD), Price (USD/Unit) and Gross Margin (2019-2025)
Table 89. Highvac Business Overview
Table 90. Highvac Recent Developments
Table 91. Nippon Sanso Semiconductor Gas Abatement Systems Basic Information
Table 92. Nippon Sanso Semiconductor Gas Abatement Systems Product Overview
Table 93. Nippon Sanso Semiconductor Gas Abatement Systems Sales (K Units), Revenue (M USD), Price (USD/Unit) and Gross Margin (2019-2025)
Table 94. Nippon Sanso Business Overview
Table 95. Nippon Sanso Recent Developments
Table 96. Showa Denko Semiconductor Gas Abatement Systems Basic Information
Table 97. Showa Denko Semiconductor Gas Abatement Systems Product Overview
Table 98. Showa Denko Semiconductor Gas Abatement Systems Sales (K Units), Revenue (M USD), Price (USD/Unit) and Gross Margin (2019-2025)
Table 99. Showa Denko Business Overview
Table 100. Showa Denko Recent Developments
Table 101. Beijing Jingyi Automation Equipment Semiconductor Gas Abatement Systems Basic Information
Table 102. Beijing Jingyi Automation Equipment Semiconductor Gas Abatement Systems Product Overview
Table 103. Beijing Jingyi Automation Equipment Semiconductor Gas Abatement Systems Sales (K Units), Revenue (M USD), Price (USD/Unit) and Gross Margin (2019-2025)
Table 104. Beijing Jingyi Automation Equipment Business Overview
Table 105. Beijing Jingyi Automation Equipment Recent Developments
Table 106. Global Semiconductor Gas Abatement Systems Sales Forecast by Region (2025-2030) & (K Units)
Table 107. Global Semiconductor Gas Abatement Systems Market Size Forecast by Region (2025-2030) & (M USD)
Table 108. North America Semiconductor Gas Abatement Systems Sales Forecast by Country (2025-2030) & (K Units)
Table 109. North America Semiconductor Gas Abatement Systems Market Size Forecast by Country (2025-2030) & (M USD)
Table 110. Europe Semiconductor Gas Abatement Systems Sales Forecast by Country (2025-2030) & (K Units)
Table 111. Europe Semiconductor Gas Abatement Systems Market Size Forecast by Country (2025-2030) & (M USD)
Table 112. Asia Pacific Semiconductor Gas Abatement Systems Sales Forecast by Region (2025-2030) & (K Units)
Table 113. Asia Pacific Semiconductor Gas Abatement Systems Market Size Forecast by Region (2025-2030) & (M USD)
Table 114. South America Semiconductor Gas Abatement Systems Sales Forecast by Country (2025-2030) & (K Units)
Table 115. South America Semiconductor Gas Abatement Systems Market Size Forecast by Country (2025-2030) & (M USD)
Table 116. Middle East and Africa Semiconductor Gas Abatement Systems Consumption Forecast by Country (2025-2030) & (Units)
Table 117. Middle East and Africa Semiconductor Gas Abatement Systems Market Size Forecast by Country (2025-2030) & (M USD)
Table 118. Global Semiconductor Gas Abatement Systems Sales Forecast by Type (2025-2030) & (K Units)
Table 119. Global Semiconductor Gas Abatement Systems Market Size Forecast by Type (2025-2030) & (M USD)
Table 120. Global Semiconductor Gas Abatement Systems Price Forecast by Type (2025-2030) & (USD/Unit)
Table 121. Global Semiconductor Gas Abatement Systems Sales (K Units) Forecast by Application (2025-2030)
Table 122. Global Semiconductor Gas Abatement Systems Market Size Forecast by Application (2025-2030) & (M USD)
List of Figures
Figure 1. Product Picture of Semiconductor Gas Abatement Systems
Figure 2. Data Triangulation
Figure 3. Key Caveats
Figure 4. Global Semiconductor Gas Abatement Systems Market Size (M USD), 2019-2030
Figure 5. Global Semiconductor Gas Abatement Systems Market Size (M USD) (2019-2030)
Figure 6. Global Semiconductor Gas Abatement Systems Sales (K Units) & (2019-2030)
Figure 7. Evaluation Matrix of Segment Market Development Potential (Type)
Figure 8. Evaluation Matrix of Segment Market Development Potential (Application)
Figure 9. Evaluation Matrix of Regional Market Development Potential
Figure 10. Semiconductor Gas Abatement Systems Market Size by Country (M USD)
Figure 11. Semiconductor Gas Abatement Systems Sales Share by Manufacturers in 2023
Figure 12. Global Semiconductor Gas Abatement Systems Revenue Share by Manufacturers in 2023
Figure 13. Semiconductor Gas Abatement Systems Market Share by Company Type (Tier 1, Tier 2 and Tier 3): 2023
Figure 14. Global Market Semiconductor Gas Abatement Systems Average Price (USD/Unit) of Key Manufacturers in 2023
Figure 15. The Global 5 and 10 Largest Players: Market Share by Semiconductor Gas Abatement Systems Revenue in 2023
Figure 16. Evaluation Matrix of Segment Market Development Potential (Type)
Figure 17. Global Semiconductor Gas Abatement Systems Market Share by Type
Figure 18. Sales Market Share of Semiconductor Gas Abatement Systems by Type (2019-2025)
Figure 19. Sales Market Share of Semiconductor Gas Abatement Systems by Type in 2023
Figure 20. Market Size Share of Semiconductor Gas Abatement Systems by Type (2019-2025)
Figure 21. Market Size Market Share of Semiconductor Gas Abatement Systems by Type in 2023
Figure 22. Evaluation Matrix of Segment Market Development Potential (Application)
Figure 23. Global Semiconductor Gas Abatement Systems Market Share by Application
Figure 24. Global Semiconductor Gas Abatement Systems Sales Market Share by Application (2019-2025)
Figure 25. Global Semiconductor Gas Abatement Systems Sales Market Share by Application in 2023
Figure 26. Global Semiconductor Gas Abatement Systems Market Share by Application (2019-2025)
Figure 27. Global Semiconductor Gas Abatement Systems Market Share by Application in 2023
Figure 28. Global Semiconductor Gas Abatement Systems Sales Growth Rate by Application (2019-2025)
Figure 29. Global Semiconductor Gas Abatement Systems Sales Market Share by Region (2019-2025)
Figure 30. North America Semiconductor Gas Abatement Systems Sales and Growth Rate (2019-2025) & (K Units)
Figure 31. North America Semiconductor Gas Abatement Systems Sales Market Share by Country in 2023
Figure 32. U.S. Semiconductor Gas Abatement Systems Sales and Growth Rate (2019-2025) & (K Units)
Figure 33. Canada Semiconductor Gas Abatement Systems Sales (K Units) and Growth Rate (2019-2025)
Figure 34. Mexico Semiconductor Gas Abatement Systems Sales (Units) and Growth Rate (2019-2025)
Figure 35. Europe Semiconductor Gas Abatement Systems Sales and Growth Rate (2019-2025) & (K Units)
Figure 36. Europe Semiconductor Gas Abatement Systems Sales Market Share by Country in 2023
Figure 37. Germany Semiconductor Gas Abatement Systems Sales and Growth Rate (2019-2025) & (K Units)
Figure 38. France Semiconductor Gas Abatement Systems Sales and Growth Rate (2019-2025) & (K Units)
Figure 39. U.K. Semiconductor Gas Abatement Systems Sales and Growth Rate (2019-2025) & (K Units)
Figure 40. Italy Semiconductor Gas Abatement Systems Sales and Growth Rate (2019-2025) & (K Units)
Figure 41. Russia Semiconductor Gas Abatement Systems Sales and Growth Rate (2019-2025) & (K Units)
Figure 42. Asia Pacific Semiconductor Gas Abatement Systems Sales and Growth Rate (K Units)
Figure 43. Asia Pacific Semiconductor Gas Abatement Systems Sales Market Share by Region in 2023
Figure 44. China Semiconductor Gas Abatement Systems Sales and Growth Rate (2019-2025) & (K Units)
Figure 45. Japan Semiconductor Gas Abatement Systems Sales and Growth Rate (2019-2025) & (K Units)
Figure 46. South Korea Semiconductor Gas Abatement Systems Sales and Growth Rate (2019-2025) & (K Units)
Figure 47. India Semiconductor Gas Abatement Systems Sales and Growth Rate (2019-2025) & (K Units)
Figure 48. Southeast Asia Semiconductor Gas Abatement Systems Sales and Growth Rate (2019-2025) & (K Units)
Figure 49. South America Semiconductor Gas Abatement Systems Sales and Growth Rate (K Units)
Figure 50. South America Semiconductor Gas Abatement Systems Sales Market Share by Country in 2023
Figure 51. Brazil Semiconductor Gas Abatement Systems Sales and Growth Rate (2019-2025) & (K Units)
Figure 52. Argentina Semiconductor Gas Abatement Systems Sales and Growth Rate (2019-2025) & (K Units)
Figure 53. Columbia Semiconductor Gas Abatement Systems Sales and Growth Rate (2019-2025) & (K Units)
Figure 54. Middle East and Africa Semiconductor Gas Abatement Systems Sales and Growth Rate (K Units)
Figure 55. Middle East and Africa Semiconductor Gas Abatement Systems Sales Market Share by Region in 2023
Figure 56. Saudi Arabia Semiconductor Gas Abatement Systems Sales and Growth Rate (2019-2025) & (K Units)
Figure 57. UAE Semiconductor Gas Abatement Systems Sales and Growth Rate (2019-2025) & (K Units)
Figure 58. Egypt Semiconductor Gas Abatement Systems Sales and Growth Rate (2019-2025) & (K Units)
Figure 59. Nigeria Semiconductor Gas Abatement Systems Sales and Growth Rate (2019-2025) & (K Units)
Figure 60. South Africa Semiconductor Gas Abatement Systems Sales and Growth Rate (2019-2025) & (K Units)
Figure 61. Global Semiconductor Gas Abatement Systems Sales Forecast by Volume (2019-2030) & (K Units)
Figure 62. Global Semiconductor Gas Abatement Systems Market Size Forecast by Value (2019-2030) & (M USD)
Figure 63. Global Semiconductor Gas Abatement Systems Sales Market Share Forecast by Type (2025-2030)
Figure 64. Global Semiconductor Gas Abatement Systems Market Share Forecast by Type (2025-2030)
Figure 65. Global Semiconductor Gas Abatement Systems Sales Forecast by Application (2025-2030)
Figure 66. Global Semiconductor Gas Abatement Systems Market Share Forecast by Application (2025-2030)