SAN Switches Market, Global Business Strategies 2025-2032

SAN Switches Market size was valued at USD 1,558 million in 2024 and is projected to reach USD 1,342 million by 2032, exhibiting a negative CAGR of 2.2% during the forecast period

PDF Icon Download Sample Report PDF
  • Quick Dispatch

    All Orders

  • Secure Payment

    100% Secure Payment

Price range: $1,500.00 through $4,250.00

Clear

MARKET INSIGHTS

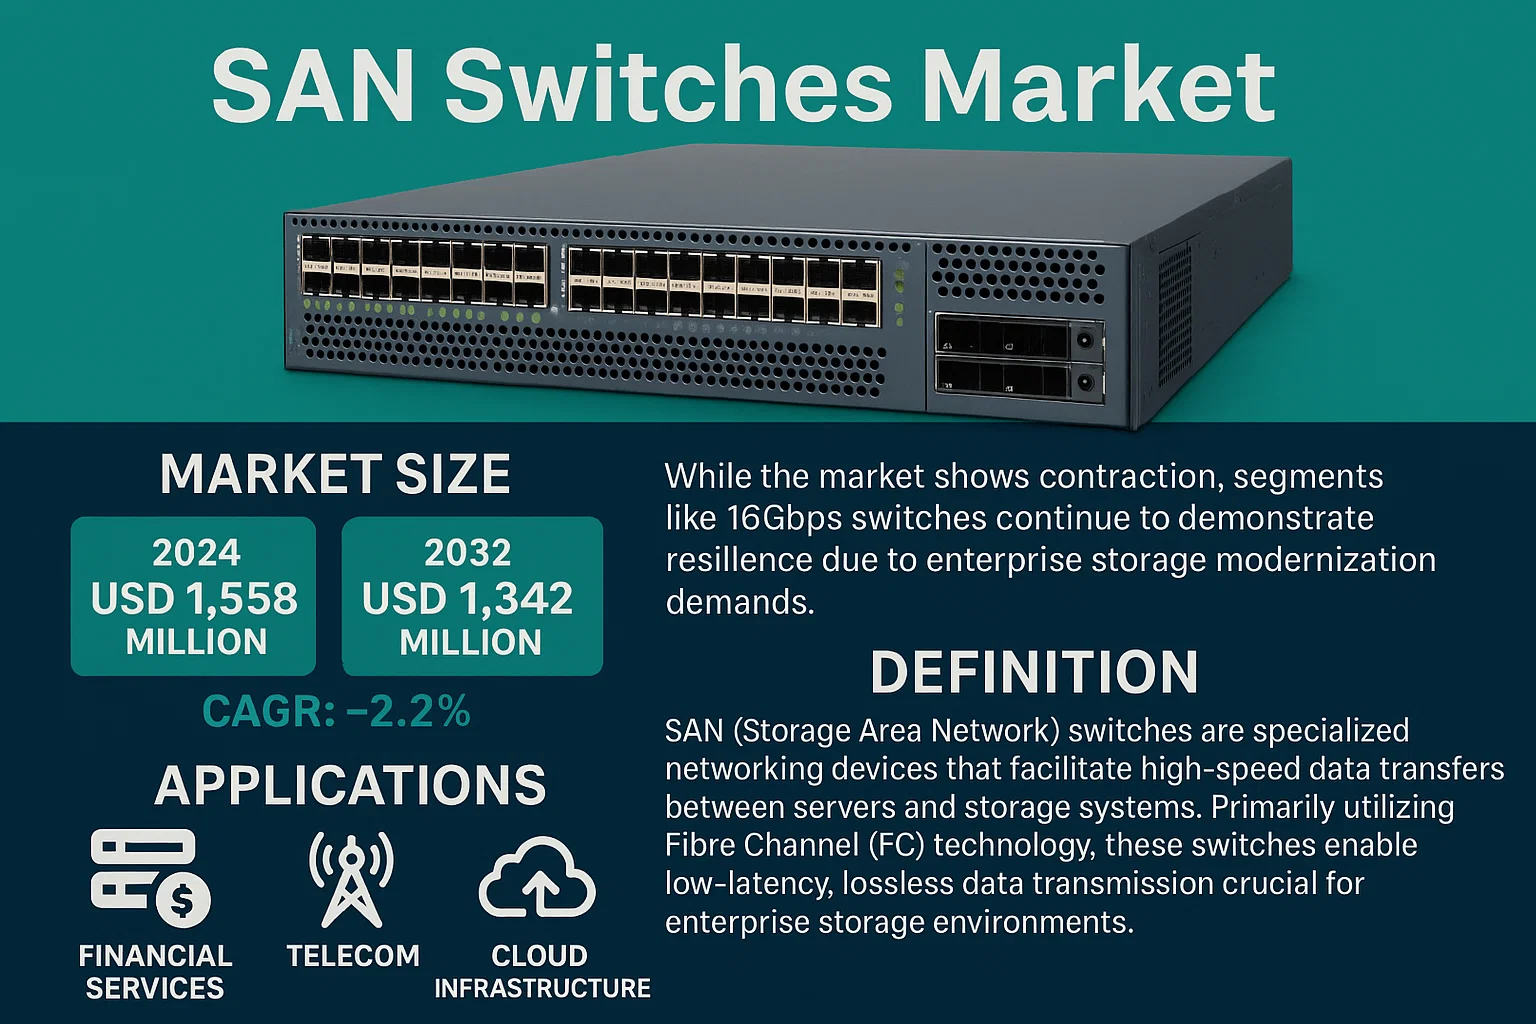
Global SAN Switches Market size was valued at USD 1,558 million in 2024 and is projected to reach USD 1,342 million by 2032, exhibiting a negative CAGR of 2.2% during the forecast period. While the market shows contraction, segments like 16Gbps switches continue to demonstrate resilience due to enterprise storage modernization demands.

SAN (Storage Area Network) switches are specialized networking devices that facilitate high-speed data transfers between servers and storage systems. Primarily utilizing Fibre Channel (FC) technology, these switches enable low-latency, lossless data transmission crucial for enterprise storage environments. The market consists of director-class switches (64+ ports) and fabric switches, with major applications in financial services, telecom, and cloud infrastructure.

The market contraction reflects enterprise migration towards software-defined storage and hyperconverged infrastructure. However, legacy FC-based SANs maintain stronghold in mission-critical applications requiring deterministic performance. In February 2024, Broadcom’s acquisition of VMware has accelerated integration of SAN technologies with cloud architectures, potentially creating new hybrid deployment models. Market leaders Brocade, Cisco, and QLogic collectively control 93% of the global SAN switch market, with China representing 87% of global manufacturing capacity due to concentrated OEM production facilities.

SAN Switches Market

MARKET DRIVERS


Increasing Data Center Demand and Data Growth

The global surge in data generation, particularly from IoT devices, AI workloads, and real-time analytics, is driving unprecedented demand for high-performance SAN switches. Data centers are expanding rapidly to handle the 25% year-over-year increase in storage traffic, requiring more sophisticated switching solutions.

Adoption of NVMe over Fabrics (NVMe-oF)

NVMe-oF technology is becoming the standard for high-performance storage, with SAN switches evolving to support NVMe/TCP and NVMe/RoCE implementations. This shift enables 3x lower latency and 4x higher IOPS compared to traditional SCSI-based systems, making it essential for modern data centers.

Market analysts project that NVMe-oF adoption will grow at 35% CAGR through 2028, directly fueling demand for advanced SAN switches.

Furthermore, the push toward hyperconverged infrastructure (HCI) and software-defined storage (SDS) is creating new requirements for intelligent SAN switches that can dynamically allocate resources.

MARKET CHALLENGES


High Initial Investment and Total Cost of Ownership

Enterprises face significant upfront costs when deploying SAN switches, with high-performance models ranging from $10,000 to $50,000 per unit. Additionally, the specialized skill set required to configure and maintain these systems adds to operational expenses, with certified engineers commanding salaries 25-40% above standard network administrators.

Other Challenges

Complexity in Multi-Vendor Environments
Organizations using storage from multiple vendors (e.g., Dell EMC, NetApp, HPE) often struggle with interoperability issues. A recent survey showed 43% of enterprises experience performance degradation when integrating new SAN switches into existing multi-vendor storage environments, requiring costly troubleshooting.

MARKET RESTRAINTS


Economic Uncertainty and Budget Constraints

The post-pandemic economic recovery has been uneven across regions, with many enterprises still operating under reduced IT budgets. SAN switch refresh cycles have extended from 3-4 years to 5-6 years in some sectors, particularly in industries hit hardest by recent economic challenges.

MARKET OPPORTUNITIES


Cloud Integration and Hybrid Cloud Expansion

As enterprises continue migrating workloads to cloud platforms, they require high-performance connections between cloud and on-premises SAN environments. This creates demand for SAN switches that can seamlessly integrate with cloud storage while maintaining performance. The market for hybrid cloud storage solutions is expected to reach $128 billion by 2026, creating substantial opportunities for SAN switch manufacturers.

Edge Computing and 5G Network Deployments

The rollout of 5G networks and edge computing initiatives are creating new demand for distributed SAN architectures. Edge data centers require compact, high-performance SAN switches that can operate in limited space with minimal power consumption. This segment is growing at 28% annually and represents a largely untapped market for SAN switch manufacturers.

SAN Switches Market Trends
Rising Demand for High-Performance Data Centers

The global SAN Switches market, valued at $1558 million in 2024, is projected to reach $1342 million by 2032, registering a CAGR of -2.2% during the forecast period. This decline is primarily attributed to the rapid adoption of alternative technologies like NVMe-over-Fabrics (NVMe-oF) and software-defined storage solutions that reduce reliance on traditional Fibre Channel infrastructures. However, the market continues to see robust demand in sectors requiring ultra-low latency and high reliability, particularly in financial services, telecommunications, and cloud service providers.

Other Trends

Increasing Adoption of All-Flash Arrays

The widespread adoption of all-flash arrays (AFA) in enterprise data centers has driven demand for higher-speed SAN switches. With storage systems now capable of exceeding 2 million IOPS, storage area networks require switches that can handle 32Gbps and 64Gbps Fibre Channel speeds. Major manufacturers like Brocade and Cisco have responded with switches supporting 32GFC and 64GFC, enabling efficient data movement between all-flash arrays and application servers. This trend is particularly strong in North America and Europe, where financial and technology sectors lead in early adoption.

Market Consolidation and Vendor Specialization

With only four major players controlling over 93% of the global SAN Switch market, competition has driven innovation in several key areas. Cisco Systems has focused on integrating SAN switching with their unified computing system (UCS) platform, while Brocade (now part of Broadcom) continues to lead in pure-play Fibre Channel switching. QLogic and Emulex (also now part of Broadcom) have shifted focus toward converged network adapters that support both Fibre Channel and Ethernet. This consolidation has resulted in more integrated solutions but reduced overall market volume as converged infrastructures gain traction.

China’s Dominance in Manufacturing

China continues to dominate SAN Switch production with 87% market share, owing to its extensive electronics manufacturing infrastructure and proximity to component suppliers. Most major manufacturers maintain manufacturing facilities in China while conducting R&D and high-end manufacturing in other regions. This concentration has created both cost efficiencies and supply chain vulnerabilities, as evidenced during recent global supply chain disruptions.

Regional Market Dynamics

North America remains the second-largest market with 7% market share, characterized by early adoption of new technologies and higher spending per enterprise. Europe follows with a mature market focused on refresh cycles and sustainability initiatives. The Asia-Pacific region (excluding China) shows the fastest growth, particularly in India and Southeast Asia, where data center expansion continues at double-digit rates. These regional differences reflect varying stages of digital transformation and data center modernization across global markets.

COMPETITIVE LANDSCAPE

Key Industry Players

Leading Players in SAN Switch Technology

The SAN switches market is dominated by a few key players who have established strong technological expertise and market presence. Brocade (now part of Broadcom) leads the market with its comprehensive portfolio of Fibre Channel switches and directors, followed closely by Cisco Systems with its MDS series offering advanced fabric switching capabilities. These companies control the majority of the market share due to their extensive product portfolios, strong R&D capabilities, and established customer bases across multiple industries.

Other significant players include QLogic (now part of Marvell Technology Group), which specializes in high-performance networking solutions, and Emulex (also now part of Broadcom), focusing on connectivity and storage solutions. IBM, Dell Technologies, and Hewlett Packard Enterprise (HPE) offer integrated SAN solutions alongside their broader infrastructure offerings. Fujitsu and NEC Corporation bring strong regional presence in Asian markets, while Arista Networks and Mellanox Technologies (now part of NVIDIA) offer high-performance alternatives with software-defined networking approaches. Smaller players like Super Micro Computer, Microchip Technology, and Intel Corporation focus on niche segments with specialized solutions.

List of Key SAN Switch Companies

  • Brocade (Broadcom Inc.)
  • Cisco Systems Inc.
  • QLogic Corporation (Marvell Technology Group Ltd.)
  • Emulex (Broadcom Inc.)
  • IBM Corporation
  • Dell Technologies Inc.
  • Hewlett Packard Enterprise (HPE)
  • Fujitsu Limited
  • NEC Corporation
  • Arista Networks Inc.
  • Mellanox Technologies (NVIDIA Corporation)
  • Super Micro Computer Inc.
  • Microchip Technology Inc.
  • Intel Corporation

Segment Analysis:

Segment Category Sub-Segments Key Insights
By Type
  • FC (Fibre Channel)
  • iSCSI
  • FCoE (Fibre Channel over Ethernet)
FC (Fibre Channel) remains the dominant technology for high-performance storage networks due to its reliability and low latency characteristics, particularly in mission-critical enterprise environments where performance predictability is paramount.
By Application
  • Enterprise Data Centers
  • Cloud Service Providers
  • Telecommunications
  • Healthcare Data Centers
Enterprise Data Centers represent the largest segment, driven by the need for high-performance, reliable storage networking in mission-critical business applications and data-intensive workloads that require deterministic performance and minimal latency.
By End User
  • Large Enterprises
  • Small & Medium Enterprises
  • Cloud Service Providers
Large Enterprises dominate adoption due to their complex IT infrastructure requirements, extensive data storage needs, and larger IT budgets that can accommodate the significant investment in high-performance networking infrastructure.
By Port Speed
  • 16Gbps/32Gbps
  • 64Gbps/128Gbps
  • 200Gbps/400Gbps
Higher speed ports (64Gbps and above) are gaining traction as data-intensive applications and storage demands grow, though adoption remains concentrated in large enterprises and cloud providers who require maximum throughput for their most demanding workloads.
By Functionality
  • Core Switching
  • Edge Switching
  • Director-level
Director-level switches continue to be the foundation of large-scale SAN deployments, offering the highest port density, advanced features, and reliability required for the most demanding data center environments where downtime is not an option.

Regional Analysis: SAN Switches Market

North America

North America dominates the SAN switches market with the highest market share, driven by massive data center investments from hyperscalers and enterprises undergoing digital transformation. The region benefits from extensive cloud adoption, AI infrastructure deployment, and strong presence of major storage vendors offering advanced Fabric technologies. Financial services, healthcare, and technology sectors drive demand for high-performance, low-latency storage networks with multi-petabyte scale becoming standard in new deployments.

Technology Innovation Hub
North America’s leadership stems from its role as the primary R&D center for storage networking technologies. Silicon Valley and other tech hubs produce continuous innovations in NVMe-oF, Fibre Channel, and Ethernet SAN technologies that are adopted globally.
Enterprise Adoption Patterns
Enterprises in North America lead in adopting software-defined storage and hyperconverged infrastructure, driving demand for high-performance SAN switches. Financial services firms run some of the world’s most demanding low-latency trading platforms.
Hyperscale Influence
North American hyperscalers operate the world’s largest data centers and have driven demand for high-port-density switches capable of petabyte-scale traffic. Their requirements shape global product development.
Sustainability Initiatives
North American data centers lead in energy efficiency improvements, with SAN switch manufacturers focusing on power-per-port metrics. This influences global product designs as energy costs become crucial.

Europe
Europe represents the second largest SAN switches market, characterized by strong data protection regulations driving investment in on-premises storage infrastructure. The region shows particular strength in financial services, healthcare, and government sectors where data sovereignty requirements maintain strong demand for enterprise-grade SAN switches. European organizations prioritize vendor neutrality and open standards, influencing global product development. The market shows balanced growth across Western and Eastern Europe with Germany, UK, and France as key markets.

Asia-Pacific
Asia-Pacific demonstrates the fastest growth rate for SAN switches, driven by digital transformation initiatives across developing economies. China, India, Japan, and Australia represent key markets with Japan and Australia showing particularly high spending per enterprise. The region benefits from massive data center construction projects, government digitalization initiatives, and growing adoption of flash storage. Supply chain advantages provide cost-effective manufacturing while increasing cloud adoption creates hybrid infrastructure requirements.

Latin America
Latin America shows steady growth in SAN switch adoption, particularly in Brazil, Mexico, and Chile where financial services and natural resource industries drive demand. The market remains price-sensitive with strong preference for integrated solutions rather than best-of-breed approaches. Cloud migration progresses slightly slower than other regions, maintaining stronger on-premises requirements.

Middle East & Africa
Middle East & Africa shows the smallest but fastest-growing SAN switches market, driven primarily by oil-rich Gulf states and South Africa’s financial sector. The region shows extreme heterogeneity with some organizations running world-class infrastructure alongside limited adoption in developing areas. Investment in smart city initiatives and digital government services drives gradual market expansion with particular strength in UAE, Saudi Arabia, and South Africa.

Report Scope

This market research report provides a comprehensive analysis of the SAN Switches Market , covering the forecast period 2025-2032. It offers detailed insights into market dynamics, technological advancements, competitive landscape, and key trends shaping the industry.

Key focus areas of the report include:

  • Market Overview: The report begins with an overview outlining its current market scenario, key growth indicators, and industry transformation drivers. It discusses macroeconomic factors, demand-supply balance, regulatory landscape, and the strategic role of semiconductors in powering advancements across industries such as automotive, telecommunications, consumer electronics, and industrial automation.
  • Market Size & Forecast: Historical data and future projections for revenue, unit shipments, and market value across major regions and segments.
  • Segmentation Analysis: Detailed breakdown by product type, technology, application, and end-user industry to identify high-growth segments and investment opportunities.
  • Regional Insights: Insights into market performance across North America, Europe, Asia-Pacific, Latin America, and the Middle East & Africa, including country-level analysis where relevant.
  • Competitive Landscape: Profiles of leading market participants, including their product offerings, R&D focus, manufacturing capacity, pricing strategies, and recent developments such as mergers, acquisitions, and partnerships.
  • Technology Trends & Innovation: Assessment of emerging technologies, integration of AI/IoT, semiconductor design trends, fabrication techniques, and evolving industry standards.
  • Market Drivers & Restraints: Evaluation of factors driving market growth along with challenges, supply chain constraints, regulatory issues, and market-entry barriers.
  • Stakeholder Insights: Insights for component suppliers, OEMs, system integrators, investors, and policymakers regarding the evolving ecosystem and strategic opportunities.

Primary and secondary research methods are employed, including interviews with industry experts, data from verified sources, and real-time market intelligence to ensure the accuracy and reliability of the insights presented.

FREQUENTLY ASKED QUESTIONS:

What is the current market size of SAN Switches Market?

-> The SAN Switches Market was valued at US$ 1558 million in 2024 and is expected to reach US$ 1342 million by 2032.

What is the growth rate of SAN Switches Market?

-> The market is expected to decline at a CAGR of -2.2% from 2025 to 2032.

Which key companies operate in SAN Switches Market?

-> Key players include Brocade, Cisco, QLogic, and Emulex, among others.

What are the key growth drivers?

-> Key growth drivers include data center expansion, increasing data storage needs, and adoption of high-speed networking technologies.

Which region dominates the market?

-> Asia-Pacific is the largest market, with China accounting for the majority share, while North America and Europe also hold significant shares.

SAN Switches Market, Global Business Strategies 2025-2032

Get Sample Report PDF for Exclusive Insights

Report Sample Includes

  • Table of Contents
  • List of Tables & Figures
  • Charts, Research Methodology, and more...
PDF Icon Download Sample Report PDF

Download Sample Report

Table of Content

1 Introduction to Research & Analysis Reports
1.1 SAN Switches Market Definition
1.2 Market Segments
1.2.1 Segment by Type
1.2.2 Segment by Application
1.3 Global SAN Switches Market Overview
1.4 Features & Benefits of This Report
1.5 Methodology & Sources of Information
1.5.1 Research Methodology
1.5.2 Research Process
1.5.3 Base Year
1.5.4 Report Assumptions & Caveats
2 Global SAN Switches Overall Market Size
2.1 Global SAN Switches Market Size: 2024 VS 2032
2.2 Global SAN Switches Market Size, Prospects & Forecasts: 2020-2032
2.3 Global SAN Switches Sales: 2020-2032
3 Company Landscape
3.1 Top SAN Switches Players in Global Market
3.2 Top Global SAN Switches Companies Ranked by Revenue
3.3 Global SAN Switches Revenue by Companies
3.4 Global SAN Switches Sales by Companies
3.5 Global SAN Switches Price by Manufacturer (2020-2025)
3.6 Top 3 and Top 5 SAN Switches Companies in Global Market, by Revenue in 2024
3.7 Global Manufacturers SAN Switches Product Type
3.8 Tier 1, Tier 2, and Tier 3 SAN Switches Players in Global Market
3.8.1 List of Global Tier 1 SAN Switches Companies
3.8.2 List of Global Tier 2 and Tier 3 SAN Switches Companies
4 Sights by Product
4.1 Overview
4.1.1 Segment by Type – Global SAN Switches Market Size Markets, 2024 & 2032
4.1.2 4Gbps
4.1.3 8Gbps
4.1.4 16Gbps
4.1.5 Others
4.2 Segment by Type – Global SAN Switches Revenue & Forecasts
4.2.1 Segment by Type – Global SAN Switches Revenue, 2020-2025
4.2.2 Segment by Type – Global SAN Switches Revenue, 2026-2032
4.2.3 Segment by Type – Global SAN Switches Revenue Market Share, 2020-2032
4.3 Segment by Type – Global SAN Switches Sales & Forecasts
4.3.1 Segment by Type – Global SAN Switches Sales, 2020-2025
4.3.2 Segment by Type – Global SAN Switches Sales, 2026-2032
4.3.3 Segment by Type – Global SAN Switches Sales Market Share, 2020-2032
4.4 Segment by Type – Global SAN Switches Price (Manufacturers Selling Prices), 2020-2032
5 Sights by Application
5.1 Overview
5.1.1 Segment by Application – Global SAN Switches Market Size, 2024 & 2032
5.1.2 Financial
5.1.3 Telecommunications
5.1.4 Media
5.1.5 Government
5.1.6 Aviation
5.1.7 Education
5.2 Segment by Application – Global SAN Switches Revenue & Forecasts
5.2.1 Segment by Application – Global SAN Switches Revenue, 2020-2025
5.2.2 Segment by Application – Global SAN Switches Revenue, 2026-2032
5.2.3 Segment by Application – Global SAN Switches Revenue Market Share, 2020-2032
5.3 Segment by Application – Global SAN Switches Sales & Forecasts
5.3.1 Segment by Application – Global SAN Switches Sales, 2020-2025
5.3.2 Segment by Application – Global SAN Switches Sales, 2026-2032
5.3.3 Segment by Application – Global SAN Switches Sales Market Share, 2020-2032
5.4 Segment by Application – Global SAN Switches Price (Manufacturers Selling Prices), 2020-2032
6 Sights by Region
6.1 By Region – Global SAN Switches Market Size, 2024 & 2032
6.2 By Region – Global SAN Switches Revenue & Forecasts
6.2.1 By Region – Global SAN Switches Revenue, 2020-2025
6.2.2 By Region – Global SAN Switches Revenue, 2026-2032
6.2.3 By Region – Global SAN Switches Revenue Market Share, 2020-2032
6.3 By Region – Global SAN Switches Sales & Forecasts
6.3.1 By Region – Global SAN Switches Sales, 2020-2025
6.3.2 By Region – Global SAN Switches Sales, 2026-2032
6.3.3 By Region – Global SAN Switches Sales Market Share, 2020-2032
6.4 North America
6.4.1 By Country – North America SAN Switches Revenue, 2020-2032
6.4.2 By Country – North America SAN Switches Sales, 2020-2032
6.4.3 United States SAN Switches Market Size, 2020-2032
6.4.4 Canada SAN Switches Market Size, 2020-2032
6.4.5 Mexico SAN Switches Market Size, 2020-2032
6.5 Europe
6.5.1 By Country – Europe SAN Switches Revenue, 2020-2032
6.5.2 By Country – Europe SAN Switches Sales, 2020-2032
6.5.3 Germany SAN Switches Market Size, 2020-2032
6.5.4 France SAN Switches Market Size, 2020-2032
6.5.5 U.K. SAN Switches Market Size, 2020-2032
6.5.6 Italy SAN Switches Market Size, 2020-2032
6.5.7 Russia SAN Switches Market Size, 2020-2032
6.5.8 Nordic Countries SAN Switches Market Size, 2020-2032
6.5.9 Benelux SAN Switches Market Size, 2020-2032
6.6 Asia
6.6.1 By Region – Asia SAN Switches Revenue, 2020-2032
6.6.2 By Region – Asia SAN Switches Sales, 2020-2032
6.6.3 China SAN Switches Market Size, 2020-2032
6.6.4 Japan SAN Switches Market Size, 2020-2032
6.6.5 South Korea SAN Switches Market Size, 2020-2032
6.6.6 Southeast Asia SAN Switches Market Size, 2020-2032
6.6.7 India SAN Switches Market Size, 2020-2032
6.7 South America
6.7.1 By Country – South America SAN Switches Revenue, 2020-2032
6.7.2 By Country – South America SAN Switches Sales, 2020-2032
6.7.3 Brazil SAN Switches Market Size, 2020-2032
6.7.4 Argentina SAN Switches Market Size, 2020-2032
6.8 Middle East & Africa
6.8.1 By Country – Middle East & Africa SAN Switches Revenue, 2020-2032
6.8.2 By Country – Middle East & Africa SAN Switches Sales, 2020-2032
6.8.3 Turkey SAN Switches Market Size, 2020-2032
6.8.4 Israel SAN Switches Market Size, 2020-2032
6.8.5 Saudi Arabia SAN Switches Market Size, 2020-2032
6.8.6 UAE SAN Switches Market Size, 2020-2032
7 Manufacturers & Brands Profiles
7.1 Brocade
7.1.1 Brocade Company Summary
7.1.2 Brocade Business Overview
7.1.3 Brocade SAN Switches Major Product Offerings
7.1.4 Brocade SAN Switches Sales and Revenue in Global (2020-2025)
7.1.5 Brocade Key News & Latest Developments
7.2 Cisco
7.2.1 Cisco Company Summary
7.2.2 Cisco Business Overview
7.2.3 Cisco SAN Switches Major Product Offerings
7.2.4 Cisco SAN Switches Sales and Revenue in Global (2020-2025)
7.2.5 Cisco Key News & Latest Developments
7.3 Qlogic
7.3.1 Qlogic Company Summary
7.3.2 Qlogic Business Overview
7.3.3 Qlogic SAN Switches Major Product Offerings
7.3.4 Qlogic SAN Switches Sales and Revenue in Global (2020-2025)
7.3.5 Qlogic Key News & Latest Developments
7.4 Emulex
7.4.1 Emulex Company Summary
7.4.2 Emulex Business Overview
7.4.3 Emulex SAN Switches Major Product Offerings
7.4.4 Emulex SAN Switches Sales and Revenue in Global (2020-2025)
7.4.5 Emulex Key News & Latest Developments
8 Global SAN Switches Production Capacity, Analysis
8.1 Global SAN Switches Production Capacity, 2020-2032
8.2 SAN Switches Production Capacity of Key Manufacturers in Global Market
8.3 Global SAN Switches Production by Region
9 Key Market Trends, Opportunity, Drivers and Restraints
9.1 Market Opportunities & Trends
9.2 Market Drivers
9.3 Market Restraints
10 SAN Switches Supply Chain Analysis
10.1 SAN Switches Industry Value Chain
10.2 SAN Switches Upstream Market
10.3 SAN Switches Downstream and Clients
10.4 Marketing Channels Analysis
10.4.1 Marketing Channels
10.4.2 SAN Switches Distributors and Sales Agents in Global
11 Conclusion
12 Appendix
12.1 Note
12.2 Examples of Clients
12.3 DisclaimerList of Tables
Table 1. Key Players of SAN Switches in Global Market
Table 2. Top SAN Switches Players in Global Market, Ranking by Revenue (2024)
Table 3. Global SAN Switches Revenue by Companies, (US$, Mn), 2020-2025
Table 4. Global SAN Switches Revenue Share by Companies, 2020-2025
Table 5. Global SAN Switches Sales by Companies, (K Units), 2020-2025
Table 6. Global SAN Switches Sales Share by Companies, 2020-2025
Table 7. Key Manufacturers SAN Switches Price (2020-2025) & (USD/Unit)
Table 8. Global Manufacturers SAN Switches Product Type
Table 9. List of Global Tier 1 SAN Switches Companies, Revenue (US$, Mn) in 2024 and Market Share
Table 10. List of Global Tier 2 and Tier 3 SAN Switches Companies, Revenue (US$, Mn) in 2024 and Market Share
Table 11. Segment by Type – Global SAN Switches Revenue, (US$, Mn), 2024 & 2032
Table 12. Segment by Type – Global SAN Switches Revenue (US$, Mn), 2020-2025
Table 13. Segment by Type – Global SAN Switches Revenue (US$, Mn), 2026-2032
Table 14. Segment by Type – Global SAN Switches Sales (K Units), 2020-2025
Table 15. Segment by Type – Global SAN Switches Sales (K Units), 2026-2032
Table 16. Segment by Application – Global SAN Switches Revenue, (US$, Mn), 2024 & 2032
Table 17. Segment by Application – Global SAN Switches Revenue, (US$, Mn), 2020-2025
Table 18. Segment by Application – Global SAN Switches Revenue, (US$, Mn), 2026-2032
Table 19. Segment by Application – Global SAN Switches Sales, (K Units), 2020-2025
Table 20. Segment by Application – Global SAN Switches Sales, (K Units), 2026-2032
Table 21. By Region – Global SAN Switches Revenue, (US$, Mn), 2025-2032
Table 22. By Region – Global SAN Switches Revenue, (US$, Mn), 2020-2025
Table 23. By Region – Global SAN Switches Revenue, (US$, Mn), 2026-2032
Table 24. By Region – Global SAN Switches Sales, (K Units), 2020-2025
Table 25. By Region – Global SAN Switches Sales, (K Units), 2026-2032
Table 26. By Country – North America SAN Switches Revenue, (US$, Mn), 2020-2025
Table 27. By Country – North America SAN Switches Revenue, (US$, Mn), 2026-2032
Table 28. By Country – North America SAN Switches Sales, (K Units), 2020-2025
Table 29. By Country – North America SAN Switches Sales, (K Units), 2026-2032
Table 30. By Country – Europe SAN Switches Revenue, (US$, Mn), 2020-2025
Table 31. By Country – Europe SAN Switches Revenue, (US$, Mn), 2026-2032
Table 32. By Country – Europe SAN Switches Sales, (K Units), 2020-2025
Table 33. By Country – Europe SAN Switches Sales, (K Units), 2026-2032
Table 34. By Region – Asia SAN Switches Revenue, (US$, Mn), 2020-2025
Table 35. By Region – Asia SAN Switches Revenue, (US$, Mn), 2026-2032
Table 36. By Region – Asia SAN Switches Sales, (K Units), 2020-2025
Table 37. By Region – Asia SAN Switches Sales, (K Units), 2026-2032
Table 38. By Country – South America SAN Switches Revenue, (US$, Mn), 2020-2025
Table 39. By Country – South America SAN Switches Revenue, (US$, Mn), 2026-2032
Table 40. By Country – South America SAN Switches Sales, (K Units), 2020-2025
Table 41. By Country – South America SAN Switches Sales, (K Units), 2026-2032
Table 42. By Country – Middle East & Africa SAN Switches Revenue, (US$, Mn), 2020-2025
Table 43. By Country – Middle East & Africa SAN Switches Revenue, (US$, Mn), 2026-2032
Table 44. By Country – Middle East & Africa SAN Switches Sales, (K Units), 2020-2025
Table 45. By Country – Middle East & Africa SAN Switches Sales, (K Units), 2026-2032
Table 46. Brocade Company Summary
Table 47. Brocade SAN Switches Product Offerings
Table 48. Brocade SAN Switches Sales (K Units), Revenue (US$, Mn) and Average Price (USD/Unit) & (2020-2025)
Table 49. Brocade Key News & Latest Developments
Table 50. Cisco Company Summary
Table 51. Cisco SAN Switches Product Offerings
Table 52. Cisco SAN Switches Sales (K Units), Revenue (US$, Mn) and Average Price (USD/Unit) & (2020-2025)
Table 53. Cisco Key News & Latest Developments
Table 54. Qlogic Company Summary
Table 55. Qlogic SAN Switches Product Offerings
Table 56. Qlogic SAN Switches Sales (K Units), Revenue (US$, Mn) and Average Price (USD/Unit) & (2020-2025)
Table 57. Qlogic Key News & Latest Developments
Table 58. Emulex Company Summary
Table 59. Emulex SAN Switches Product Offerings
Table 60. Emulex SAN Switches Sales (K Units), Revenue (US$, Mn) and Average Price (USD/Unit) & (2020-2025)
Table 61. Emulex Key News & Latest Developments
Table 62. SAN Switches Capacity of Key Manufacturers in Global Market, 2023-2025 (K Units)
Table 63. Global SAN Switches Capacity Market Share of Key Manufacturers, 2023-2025
Table 64. Global SAN Switches Production by Region, 2020-2025 (K Units)
Table 65. Global SAN Switches Production by Region, 2026-2032 (K Units)
Table 66. SAN Switches Market Opportunities & Trends in Global Market
Table 67. SAN Switches Market Drivers in Global Market
Table 68. SAN Switches Market Restraints in Global Market
Table 69. SAN Switches Raw Materials
Table 70. SAN Switches Raw Materials Suppliers in Global Market
Table 71. Typical SAN Switches Downstream
Table 72. SAN Switches Downstream Clients in Global Market
Table 73. SAN Switches Distributors and Sales Agents in Global Market

List of Figures
Figure 1. SAN Switches Product Picture
Figure 2. SAN Switches Segment by Type in 2024
Figure 3. SAN Switches Segment by Application in 2024
Figure 4. Global SAN Switches Market Overview: 2024
Figure 5. Key Caveats
Figure 6. Global SAN Switches Market Size: 2024 VS 2032 (US$, Mn)
Figure 7. Global SAN Switches Revenue: 2020-2032 (US$, Mn)
Figure 8. SAN Switches Sales in Global Market: 2020-2032 (K Units)
Figure 9. The Top 3 and 5 Players Market Share by SAN Switches Revenue in 2024
Figure 10. Segment by Type – Global SAN Switches Revenue, (US$, Mn), 2024 & 2032
Figure 11. Segment by Type – Global SAN Switches Revenue Market Share, 2020-2032
Figure 12. Segment by Type – Global SAN Switches Sales Market Share, 2020-2032
Figure 13. Segment by Type – Global SAN Switches Price (USD/Unit), 2020-2032
Figure 14. Segment by Application – Global SAN Switches Revenue, (US$, Mn), 2024 & 2032
Figure 15. Segment by Application – Global SAN Switches Revenue Market Share, 2020-2032
Figure 16. Segment by Application – Global SAN Switches Sales Market Share, 2020-2032
Figure 17. Segment by Application -Global SAN Switches Price (USD/Unit), 2020-2032
Figure 18. By Region – Global SAN Switches Revenue, (US$, Mn), 2025 & 2032
Figure 19. By Region – Global SAN Switches Revenue Market Share, 2020 VS 2024 VS 2032
Figure 20. By Region – Global SAN Switches Revenue Market Share, 2020-2032
Figure 21. By Region – Global SAN Switches Sales Market Share, 2020-2032
Figure 22. By Country – North America SAN Switches Revenue Market Share, 2020-2032
Figure 23. By Country – North America SAN Switches Sales Market Share, 2020-2032
Figure 24. United States SAN Switches Revenue, (US$, Mn), 2020-2032
Figure 25. Canada SAN Switches Revenue, (US$, Mn), 2020-2032
Figure 26. Mexico SAN Switches Revenue, (US$, Mn), 2020-2032
Figure 27. By Country – Europe SAN Switches Revenue Market Share, 2020-2032
Figure 28. By Country – Europe SAN Switches Sales Market Share, 2020-2032
Figure 29. Germany SAN Switches Revenue, (US$, Mn), 2020-2032
Figure 30. France SAN Switches Revenue, (US$, Mn), 2020-2032
Figure 31. U.K. SAN Switches Revenue, (US$, Mn), 2020-2032
Figure 32. Italy SAN Switches Revenue, (US$, Mn), 2020-2032
Figure 33. Russia SAN Switches Revenue, (US$, Mn), 2020-2032
Figure 34. Nordic Countries SAN Switches Revenue, (US$, Mn), 2020-2032
Figure 35. Benelux SAN Switches Revenue, (US$, Mn), 2020-2032
Figure 36. By Region – Asia SAN Switches Revenue Market Share, 2020-2032
Figure 37. By Region – Asia SAN Switches Sales Market Share, 2020-2032
Figure 38. China SAN Switches Revenue, (US$, Mn), 2020-2032
Figure 39. Japan SAN Switches Revenue, (US$, Mn), 2020-2032
Figure 40. South Korea SAN Switches Revenue, (US$, Mn), 2020-2032
Figure 41. Southeast Asia SAN Switches Revenue, (US$, Mn), 2020-2032
Figure 42. India SAN Switches Revenue, (US$, Mn), 2020-2032
Figure 43. By Country – South America SAN Switches Revenue Market Share, 2020-2032
Figure 44. By Country – South America SAN Switches Sales, Market Share, 2020-2032
Figure 45. Brazil SAN Switches Revenue, (US$, Mn), 2020-2032
Figure 46. Argentina SAN Switches Revenue, (US$, Mn), 2020-2032
Figure 47. By Country – Middle East & Africa SAN Switches Revenue, Market Share, 2020-2032
Figure 48. By Country – Middle East & Africa SAN Switches Sales, Market Share, 2020-2032
Figure 49. Turkey SAN Switches Revenue, (US$, Mn), 2020-2032
Figure 50. Israel SAN Switches Revenue, (US$, Mn), 2020-2032
Figure 51. Saudi Arabia SAN Switches Revenue, (US$, Mn), 2020-2032
Figure 52. UAE SAN Switches Revenue, (US$, Mn), 2020-2032
Figure 53. Global SAN Switches Production Capacity (K Units), 2020-2032
Figure 54. The Percentage of Production SAN Switches by Region, 2024 VS 2032
Figure 55. SAN Switches Industry Value Chain
Figure 56. Marketing Channels