Safety Sensors and Switches Market, Global Business Strategies 2026-2033

Safety Sensors and Switches Market size was valued at USD 2.77 billion in 2025 and is projected to reach USD 3.35 billion by 2033, exhibiting a CAGR of 2.8% during the forecast period.

PDF Icon Download Sample Report PDF
  • Quick Dispatch

    All Orders

  • Secure Payment

    100% Secure Payment

Price range: $1,500.00 through $4,250.00

Clear

Market Insights

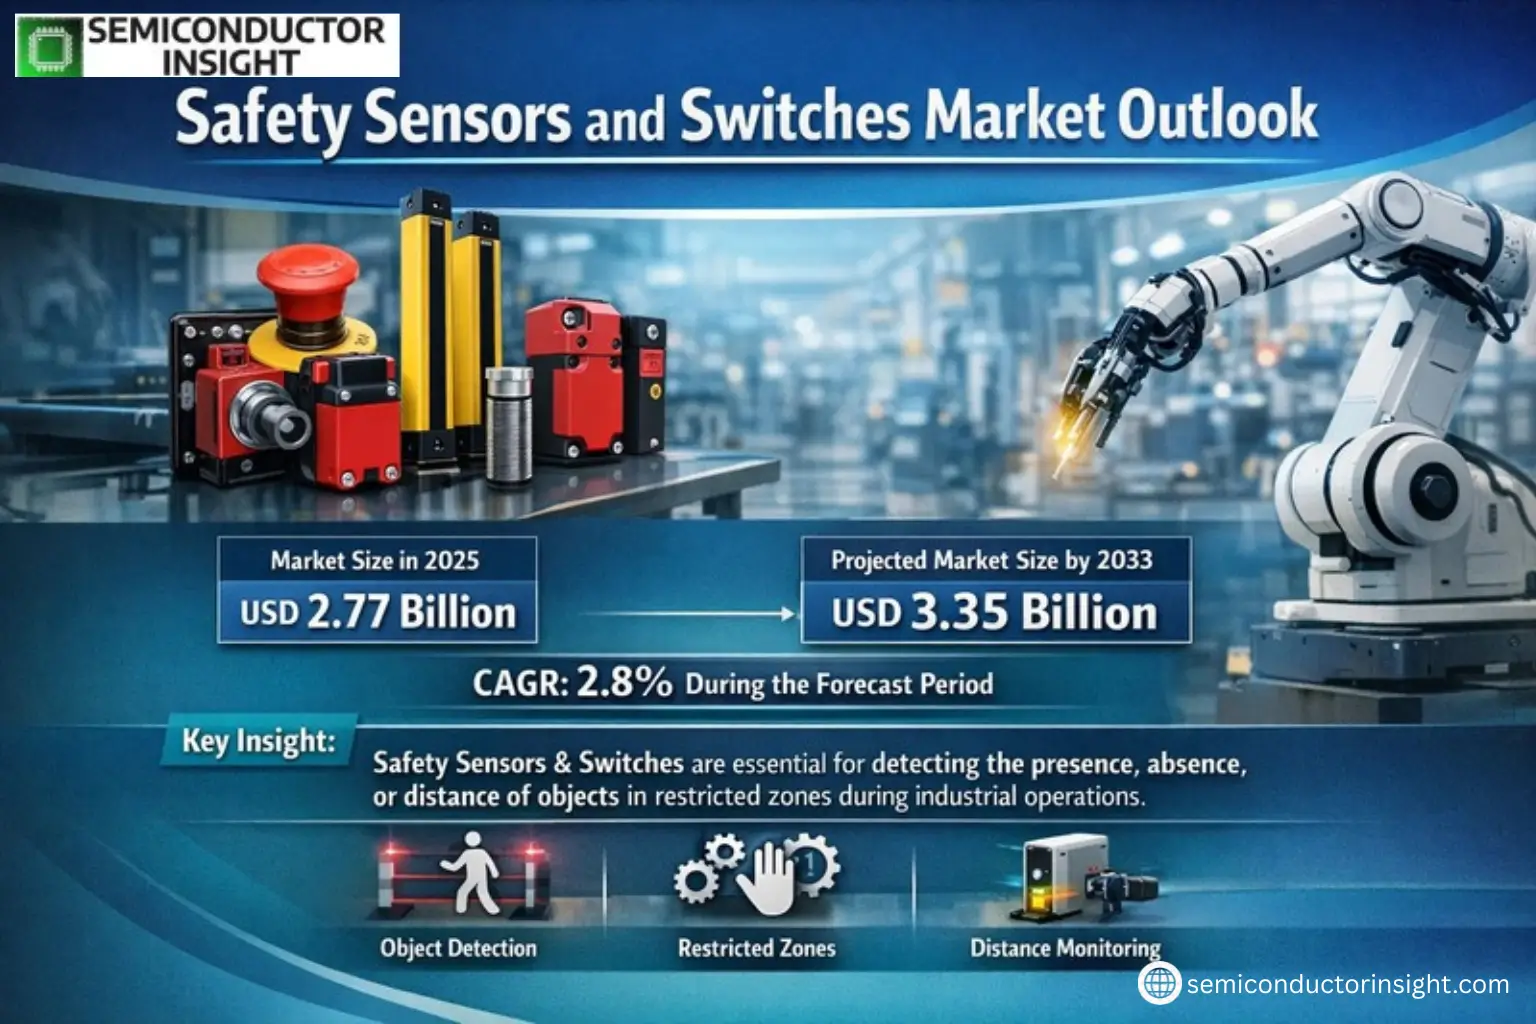
Global Safety Sensors and Switches Market size was valued at USD 2.77 billion in 2025 and is projected to reach USD 3.35 billion by 2033, exhibiting a CAGR of 2.8% during the forecast period.

Safety Sensors and Switches are critical components used for detecting the presence, absence, or distance of objects within restricted zones during industrial operations. These devices operate on photoelectric principles, utilizing electromagnetic waves such as light, electric, or magnetic signals to ensure operational safety. They are categorized into various types including opto-electronic devices, presence detection sensors, safety switches, and command devices for manufacturing industries, while automotive applications include collision avoidance, obstacle detection, and lighting control systems.

The market growth is driven by increasing industrial automation demand and stringent workplace safety regulations across sectors such as automotive, food & beverage, electronics, and oil & gas. Key players like SICK AG, Pepperl+Fuchs, Rockwell Automation, and Omron dominate the market with a combined share of approximately 50%. Geographically, North America leads with over 20% market share due to advanced manufacturing infrastructure while Europe and Japan collectively account for more than 40%.

Xyz market size & forecast

MARKET DRIVERS

Rising Industrial Automation Adoption

Global Safety Sensors and Switches Market is experiencing growth due to increasing automation across manufacturing, oil & gas, and automotive industries. Strict workplace safety regulations and the need to prevent accidents are compelling organizations to integrate advanced safety solutions. The demand for machine guarding and emergency stop systems has grown by over 12% annually in recent years.

Technological Advancements in Sensor Technologies

Innovations in non-contact safety sensors, such as laser-based and RFID-enabled switches, are driving market expansion. These solutions offer higher reliability and reduce maintenance costs compared to traditional mechanical switches. The adoption of IoT-enabled safety devices for predictive maintenance is creating new growth avenues.

Growing awareness about personnel protection in hazardous environments and the increasing focus on Industry 4.0 standards continue to propel market demand.

MARKET CHALLENGES

High Implementation Costs

The initial investment required for advanced Safety Sensors and Switches systems remains a significant barrier, particularly for small and medium enterprises. Retrofitting existing machinery with modern safety components can increase project costs by 25-30%, slowing adoption rates in cost-sensitive markets.

Other Challenges

Integration with Legacy Systems
Many industrial facilities face difficulties when integrating new safety technologies with older control systems, requiring additional interface modules and specialized programming expertise.

MARKET RESTRAINTS

Lack of Standardization Across Regions

Divergent safety regulations across global markets create complexity for Safety Sensors and Switches manufacturers. Different compliance requirements in North America, Europe, and Asia-Pacific regions increase product development costs and limit economies of scale.

MARKET OPPORTUNITIES

Expansion in Emerging Economies

Rapid industrialization in developing nations presents significant growth potential for the Safety Sensors and Switches Market. Countries like India, Brazil, and Southeast Asian nations are witnessing increased investments in industrial safety infrastructure, with the sector projected to grow at 9.5% annually.

Smart Safety Solutions Demand

The convergence of safety systems with AI and machine learning technologies is creating new opportunities. Predictive safety monitoring and self-diagnosing switches are expected to capture 35% of the market share by 2027, particularly in high-risk industries.

Safety Sensors and Switches Market Trends

Steady Market Growth Projected Through 2033

Global Safety Sensors and Switches market was valued at USD 2.77 billion in 2025 and is projected to reach USD 3.35 billion by 2033, growing at a CAGR of 2.8%. This growth is driven by increasing safety regulations across manufacturing sectors and rising automation in industrial processes. Safety light curtains currently dominate product segments with over 55% market share due to their widespread use in machinery protection.

Other Trends

Regional Market Concentration

The United States leads with over 20% market share, followed by Europe and Japan which collectively account for more than 40% of global demand. Emerging markets in Asia are showing accelerated adoption as manufacturers upgrade facilities to comply with international safety standards.

Technology Advancements in Safety Detection

Recent innovations include enhanced laser scanners with improved obstacle detection ranges up to 40 meters and smart sensors with integrated IoT connectivity for real-time monitoring. Five major manufacturers (SICK, Pepperl+Fuchs, Rockwell, Ifm, and Datalogic) control approximately 50% of the global market, driving competitive technology development.

Application-Specific Growth

Automotive applications remain the largest end-use segment, followed by food & beverage processing. The electronics sector is projected for above-average growth as semiconductor and component manufacturers increase automation while maintaining strict workplace safety protocols.

Regulatory Impact on Market Evolution

Strengthened industrial safety regulations worldwide, particularly in North America and Europe, continue to mandate higher safety system investments. Manufacturers are responding with products meeting SIL 3/PLe safety integrity levels while reducing false triggers through advanced signal processing algorithms.

COMPETITIVE LANDSCAPE

Key Industry Players

Global Market Dominated by Top 5 Players Holding 50% Share

Safety Sensors and Switches Market is consolidated with top manufacturers like SICK, Pepperl+Fuchs, and Rockwell Automation leading through technological innovation and extensive product portfolios. SICK AG maintains market leadership with its comprehensive range of safety light curtains and laser scanners, while Pepperl+Fuchs strengthens its position through industrial safety solutions for harsh environments. Rockwell Automation dominates in North America through integrated safety system offerings.

Niche players like Baumer, IDEC, and Bernstein compete through specialized solutions for automotive and packaging applications. Emerging Asian manufacturers are gaining traction with cost-competitive offerings, though quality and certification remain barriers to premium market segments. The industry exhibits moderate competition with pricing pressures balanced by demand for advanced safety features in Industry 4.0 implementations.

List of Key Safety Sensors and Switches Companies Profiled

  • SICK AG
  • Pepperl+Fuchs
  • Rockwell Automation
  • ifm electronic
  • Omron Corporation
  • Datalogic S.p.A.
  • K.A. Schmersal GmbH
  • IDEC Corporation
  • Panasonic Corporation
  • Banner Engineering
  • ABB Ltd.
  • Baumer Group
  • Delphi Technologies
  • Eaton Corporation
  • Bernstein AG

Segment Analysis:

Segment Category Sub-Segments Key Insights
By Type
  • Safety Light Curtains
  • Safety Mats
  • Safety Laser Scanners
  • Other
Safety Light Curtains dominate the type segment due to:

  • High precision in object detection across manufacturing lines
  • Versatile applications in machine guarding and automated systems
  • Increasing regulatory requirements for worker safety in industrial environments
By Application
  • Automotive
  • Food and Beverage
  • Electronics
  • Packages
  • Other
Automotive leads application demand because:

  • Critical need for collision avoidance systems in automated production lines
  • Stringent safety regulations in vehicle manufacturing facilities
  • Growing adoption of robotic systems requiring safety sensor integration
  • Expansion of electric vehicle production driving new safety requirements
By End User
  • Manufacturing
  • Industrial Processing
  • Transportation
  • Oil & Gas
Manufacturing Sector shows strongest adoption trends:

  • Increased automation driving demand for worker safety solutions
  • Growing implementation of Industry 4.0 standards requiring safety integrations
  • Expansion of smart factory concepts incorporating sensor technologies
  • Need for retrofitting older facilities with modern safety equipment
By Technology
  • Photoelectric
  • Capacitive
  • Magnetic
  • Ultrasonic
Photoelectric Technology maintains dominance due to:

  • Higher reliability in various environmental conditions
  • Longer operational range compared to alternative technologies
  • Better performance in dust-heavy industrial environments
  • Lower maintenance requirements than mechanical alternatives
By Functionality
  • Presence Detection
  • Access Control
  • Position Sensing
  • Emergency Stop
Presence Detection shows strongest growth potential because:

  • Critical for automated production line safety protocols
  • Increased need for human-robot collaboration in smart factories
  • Regulatory mandates for machine guarding applications
  • Growing adoption in material handling and packaging automation

Regional Analysis: Global Safety Sensors and Switches Market

Asia-Pacific

The Asia-Pacific region dominates the Safety Sensors and Switches Market, driven by rapid industrialization and stringent workplace safety regulations. China’s manufacturing expansion and Japan’s advanced automation sector create strong demand for safety components. Southeast Asian nations are witnessing accelerated adoption as they upgrade industrial infrastructure. Key growth comes from automotive and electronics manufacturing hubs that prioritize worker protection systems. Government initiatives promoting industrial safety standards across India and South Korea further bolster market prospects. The region benefits from concentrated production facilities integrating safety solutions directly into production lines. Local manufacturers increasingly compete with global players by offering cost-effective safety sensor alternatives.

Manufacturing Growth
Automotive and electronics sectors drive unprecedented demand for safety sensors across Asian production facilities. Industrial automation investments create new opportunities for advanced switch solutions.
Regulatory Environment
Governments implement strict workplace safety mandates, compelling manufacturers to install certified safety switches. International standards adoption accelerates across developing economies in the region.
Technology Integration
Smart factories incorporate IoT-enabled safety sensors with predictive maintenance capabilities. Japanese and South Korean firms lead in developing compact, high-performance safety switch solutions.
Supply Chain Advantages
Local component availability and established electronics manufacturing ecosystems enable competitive pricing for safety sensors. Taiwan and China emerge as major production hubs.

North America
The mature North American safety sensors market thrives on technological innovation and replacement demand. U.S. and Canadian manufacturers prioritize upgrading legacy systems with smart safety switches. Strong occupational safety regulations and high labor costs incentivize preventative safety investments. The region sees growing adoption of wireless safety sensor networks in hazardous environments. Automotive and oil & gas sectors remain key consumers, while food processing plants increasingly implement advanced safety solutions.

Europe
European markets emphasize premium safety solutions with stringent ATEX and IEC certification requirements. Germany’s Industrie 4.0 initiative drives smart sensor integration in manufacturing. Northern European nations lead in workplace safety standards adoption, creating steady demand. The region focuses on energy-efficient and sustainable safety switch designs. Eastern European growth emerges as manufacturing bases expand with mandatory safety system implementations.

South America
Brazil and Argentina show growing safety sensors adoption amid industrial sector development. Mining and agricultural equipment manufacturers drive demand for rugged safety switches. Market growth faces challenges from economic volatility, though safety regulation improvements create opportunities. Local assembly of safety components increases to serve regional manufacturing needs.

Middle East & Africa
Gulf nations invest heavily in industrial safety for oil & gas facilities and construction projects. South Africa leads African demand with mining sector requirements. The region shows preference for durable safety switches capable of withstanding extreme environments. Market education initiatives aim to increase awareness of advanced sensor technologies beyond basic safety compliance.

Report Scope

This market research report provides a comprehensive analysis of the Safety Sensors and Switches Market , covering the forecast period 2025–2033. It offers detailed insights into market dynamics, technological advancements, competitive landscape, and key trends shaping the industry.

Key focus areas of the report include:

  • Market Overview: The report begins with an overview outlining its current market scenario, key growth indicators, and industry transformation drivers. It discusses macroeconomic factors, demand–supply balance, regulatory landscape, and the strategic role of semiconductors in powering advancements across industries such as automotive, telecommunications, consumer electronics, and industrial automation.
  • Market Size & Forecast: Historical data and future projections for revenue, unit shipments, and market value across major regions and segments.
  • Segmentation Analysis: Detailed breakdown by product type, technology, application, and end-user industry to identify high-growth segments and investment opportunities.
  • Regional Insights: Insights into market performance across North America, Europe, Asia-Pacific, Latin America, and the Middle East & Africa, including country-level analysis where relevant.
  • Competitive Landscape: Profiles of leading market participants, including their product offerings, R&D focus, manufacturing capacity, pricing strategies, and recent developments such as mergers, acquisitions, and partnerships.
  • Technology Trends & Innovation: Assessment of emerging technologies, integration of AI/IoT, semiconductor design trends, fabrication techniques, and evolving industry standards.
  • Market Drivers & Restraints: Evaluation of factors driving market growth along with challenges, supply chain constraints, regulatory issues, and market-entry barriers.
  • Stakeholder Insights: Insights for component suppliers, OEMs, system integrators, investors, and policymakers regarding the evolving ecosystem and strategic opportunities.

Primary and secondary research methods are employed, including interviews with industry experts, data from verified sources, and real-time market intelligence to ensure the accuracy and reliability of the insights presented.

FREQUENTLY ASKED QUESTIONS:

What is the current market size of Safety Sensors and Switches Market?

-> Safety Sensors and Switches Market size was valued at USD 2.77 billion in 2025 and is projected to reach USD 3.35 billion by 2033, exhibiting a CAGR of 2.8% during the forecast period.

Which key companies operate in Safety Sensors and Switches Market?

-> Key players include SICK, Pepperl+Fuchs, Rockwell, Ifm, Omron, Datalogic, K. A. Schmersal, IDEC, Panasonic, and Banner Engineering, among others. Global top five manufacturers hold a 50% market share.

What are the key growth drivers?

-> Key growth drivers include increasing demand in automotive and industrial applications, technological advancements in opto-electronic sensors, and stringent safety regulations across manufacturing and processing industries.

Which region dominates the market?

-> United States is the largest market with over 20% share, followed by Europe and Japan which collectively account for over 40% of the market.

What are the emerging trends?

-> Emerging trends include integration of AI/IoT in safety systems, development of compact and high-performance safety sensors, and expansion of applications in emerging industries such as renewable energy and smart infrastructure.

Which product segment leads the market?

-> Safety Light Curtains dominate the market with over 55% share, followed by Safety Mats and Safety Laser Scanners.

Which application segment leads the market?

-> Automotive is the largest application segment, followed by Food and Beverage, Electronics, and Packaging industries.

Safety Sensors and Switches Market, Global Business Strategies 2026-2033

Get Sample Report PDF for Exclusive Insights

Report Sample Includes

  • Table of Contents
  • List of Tables & Figures
  • Charts, Research Methodology, and more...
PDF Icon Download Sample Report PDF

Download Sample Report

Table of Content

1 Introduction to Research & Analysis Reports
1.1 Safety Sensors and Switches Market Definition
1.2 Market Segments
1.2.1 Segment by Type
1.2.2 Segment by Application
1.3 Global Safety Sensors and Switches Market Overview
1.4 Features & Benefits of This Report
1.5 Methodology & Sources of Information
1.5.1 Research Methodology
1.5.2 Research Process
1.5.3 Base Year
1.5.4 Report Assumptions & Caveats
2 Global Safety Sensors and Switches Overall Market Size
2.1 Global Safety Sensors and Switches Market Size: 2024 VS 2032
2.2 Global Safety Sensors and Switches Market Size, Prospects & Forecasts: 2020-2032
2.3 Global Safety Sensors and Switches Sales: 2020-2032
3 Company Landscape
3.1 Top Safety Sensors and Switches Players in Global Market
3.2 Top Global Safety Sensors and Switches Companies Ranked by Revenue
3.3 Global Safety Sensors and Switches Revenue by Companies
3.4 Global Safety Sensors and Switches Sales by Companies
3.5 Global Safety Sensors and Switches Price by Manufacturer (2020-2025)
3.6 Top 3 and Top 5 Safety Sensors and Switches Companies in Global Market, by Revenue in 2024
3.7 Global Manufacturers Safety Sensors and Switches Product Type
3.8 Tier 1, Tier 2, and Tier 3 Safety Sensors and Switches Players in Global Market
3.8.1 List of Global Tier 1 Safety Sensors and Switches Companies
3.8.2 List of Global Tier 2 and Tier 3 Safety Sensors and Switches Companies
4 Sights by Product
4.1 Overview
4.1.1 Segment by Type – Global Safety Sensors and Switches Market Size Markets, 2024 & 2032
4.1.2 Safety Light Curtains
4.1.3 Safety Mats
4.1.4 Safety Laser Scanners
4.1.5 Other
4.2 Segment by Type – Global Safety Sensors and Switches Revenue & Forecasts
4.2.1 Segment by Type – Global Safety Sensors and Switches Revenue, 2020-2025
4.2.2 Segment by Type – Global Safety Sensors and Switches Revenue, 2026-2032
4.2.3 Segment by Type – Global Safety Sensors and Switches Revenue Market Share, 2020-2032
4.3 Segment by Type – Global Safety Sensors and Switches Sales & Forecasts
4.3.1 Segment by Type – Global Safety Sensors and Switches Sales, 2020-2025
4.3.2 Segment by Type – Global Safety Sensors and Switches Sales, 2026-2032
4.3.3 Segment by Type – Global Safety Sensors and Switches Sales Market Share, 2020-2032
4.4 Segment by Type – Global Safety Sensors and Switches Price (Manufacturers Selling Prices), 2020-2032
5 Sights by Application
5.1 Overview
5.1.1 Segment by Application – Global Safety Sensors and Switches Market Size, 2024 & 2032
5.1.2 Automotive
5.1.3 Food and Beverage
5.1.4 Electronics
5.1.5 Packages
5.1.6 Other
5.2 Segment by Application – Global Safety Sensors and Switches Revenue & Forecasts
5.2.1 Segment by Application – Global Safety Sensors and Switches Revenue, 2020-2025
5.2.2 Segment by Application – Global Safety Sensors and Switches Revenue, 2026-2032
5.2.3 Segment by Application – Global Safety Sensors and Switches Revenue Market Share, 2020-2032
5.3 Segment by Application – Global Safety Sensors and Switches Sales & Forecasts
5.3.1 Segment by Application – Global Safety Sensors and Switches Sales, 2020-2025
5.3.2 Segment by Application – Global Safety Sensors and Switches Sales, 2026-2032
5.3.3 Segment by Application – Global Safety Sensors and Switches Sales Market Share, 2020-2032
5.4 Segment by Application – Global Safety Sensors and Switches Price (Manufacturers Selling Prices), 2020-2032
6 Sights by Region
6.1 By Region – Global Safety Sensors and Switches Market Size, 2024 & 2032
6.2 By Region – Global Safety Sensors and Switches Revenue & Forecasts
6.2.1 By Region – Global Safety Sensors and Switches Revenue, 2020-2025
6.2.2 By Region – Global Safety Sensors and Switches Revenue, 2026-2032
6.2.3 By Region – Global Safety Sensors and Switches Revenue Market Share, 2020-2032
6.3 By Region – Global Safety Sensors and Switches Sales & Forecasts
6.3.1 By Region – Global Safety Sensors and Switches Sales, 2020-2025
6.3.2 By Region – Global Safety Sensors and Switches Sales, 2026-2032
6.3.3 By Region – Global Safety Sensors and Switches Sales Market Share, 2020-2032
6.4 North America
6.4.1 By Country – North America Safety Sensors and Switches Revenue, 2020-2032
6.4.2 By Country – North America Safety Sensors and Switches Sales, 2020-2032
6.4.3 United States Safety Sensors and Switches Market Size, 2020-2032
6.4.4 Canada Safety Sensors and Switches Market Size, 2020-2032
6.4.5 Mexico Safety Sensors and Switches Market Size, 2020-2032
6.5 Europe
6.5.1 By Country – Europe Safety Sensors and Switches Revenue, 2020-2032
6.5.2 By Country – Europe Safety Sensors and Switches Sales, 2020-2032
6.5.3 Germany Safety Sensors and Switches Market Size, 2020-2032
6.5.4 France Safety Sensors and Switches Market Size, 2020-2032
6.5.5 U.K. Safety Sensors and Switches Market Size, 2020-2032
6.5.6 Italy Safety Sensors and Switches Market Size, 2020-2032
6.5.7 Russia Safety Sensors and Switches Market Size, 2020-2032
6.5.8 Nordic Countries Safety Sensors and Switches Market Size, 2020-2032
6.5.9 Benelux Safety Sensors and Switches Market Size, 2020-2032
6.6 Asia
6.6.1 By Region – Asia Safety Sensors and Switches Revenue, 2020-2032
6.6.2 By Region – Asia Safety Sensors and Switches Sales, 2020-2032
6.6.3 China Safety Sensors and Switches Market Size, 2020-2032
6.6.4 Japan Safety Sensors and Switches Market Size, 2020-2032
6.6.5 South Korea Safety Sensors and Switches Market Size, 2020-2032
6.6.6 Southeast Asia Safety Sensors and Switches Market Size, 2020-2032
6.6.7 India Safety Sensors and Switches Market Size, 2020-2032
6.7 South America
6.7.1 By Country – South America Safety Sensors and Switches Revenue, 2020-2032
6.7.2 By Country – South America Safety Sensors and Switches Sales, 2020-2032
6.7.3 Brazil Safety Sensors and Switches Market Size, 2020-2032
6.7.4 Argentina Safety Sensors and Switches Market Size, 2020-2032
6.8 Middle East & Africa
6.8.1 By Country – Middle East & Africa Safety Sensors and Switches Revenue, 2020-2032
6.8.2 By Country – Middle East & Africa Safety Sensors and Switches Sales, 2020-2032
6.8.3 Turkey Safety Sensors and Switches Market Size, 2020-2032
6.8.4 Israel Safety Sensors and Switches Market Size, 2020-2032
6.8.5 Saudi Arabia Safety Sensors and Switches Market Size, 2020-2032
6.8.6 UAE Safety Sensors and Switches Market Size, 2020-2032
7 Manufacturers & Brands Profiles
7.1 SICK
7.1.1 SICK Company Summary
7.1.2 SICK Business Overview
7.1.3 SICK Safety Sensors and Switches Major Product Offerings
7.1.4 SICK Safety Sensors and Switches Sales and Revenue in Global (2020-2025)
7.1.5 SICK Key News & Latest Developments
7.2 Pepperl+Fuchs
7.2.1 Pepperl+Fuchs Company Summary
7.2.2 Pepperl+Fuchs Business Overview
7.2.3 Pepperl+Fuchs Safety Sensors and Switches Major Product Offerings
7.2.4 Pepperl+Fuchs Safety Sensors and Switches Sales and Revenue in Global (2020-2025)
7.2.5 Pepperl+Fuchs Key News & Latest Developments
7.3 Rockwell
7.3.1 Rockwell Company Summary
7.3.2 Rockwell Business Overview
7.3.3 Rockwell Safety Sensors and Switches Major Product Offerings
7.3.4 Rockwell Safety Sensors and Switches Sales and Revenue in Global (2020-2025)
7.3.5 Rockwell Key News & Latest Developments
7.4 Ifm
7.4.1 Ifm Company Summary
7.4.2 Ifm Business Overview
7.4.3 Ifm Safety Sensors and Switches Major Product Offerings
7.4.4 Ifm Safety Sensors and Switches Sales and Revenue in Global (2020-2025)
7.4.5 Ifm Key News & Latest Developments
7.5 Omron
7.5.1 Omron Company Summary
7.5.2 Omron Business Overview
7.5.3 Omron Safety Sensors and Switches Major Product Offerings
7.5.4 Omron Safety Sensors and Switches Sales and Revenue in Global (2020-2025)
7.5.5 Omron Key News & Latest Developments
7.6 Datalogic
7.6.1 Datalogic Company Summary
7.6.2 Datalogic Business Overview
7.6.3 Datalogic Safety Sensors and Switches Major Product Offerings
7.6.4 Datalogic Safety Sensors and Switches Sales and Revenue in Global (2020-2025)
7.6.5 Datalogic Key News & Latest Developments
7.7 K. A. Schmersal
7.7.1 K. A. Schmersal Company Summary
7.7.2 K. A. Schmersal Business Overview
7.7.3 K. A. Schmersal Safety Sensors and Switches Major Product Offerings
7.7.4 K. A. Schmersal Safety Sensors and Switches Sales and Revenue in Global (2020-2025)
7.7.5 K. A. Schmersal Key News & Latest Developments
7.8 IDEC
7.8.1 IDEC Company Summary
7.8.2 IDEC Business Overview
7.8.3 IDEC Safety Sensors and Switches Major Product Offerings
7.8.4 IDEC Safety Sensors and Switches Sales and Revenue in Global (2020-2025)
7.8.5 IDEC Key News & Latest Developments
7.9 Panasonic
7.9.1 Panasonic Company Summary
7.9.2 Panasonic Business Overview
7.9.3 Panasonic Safety Sensors and Switches Major Product Offerings
7.9.4 Panasonic Safety Sensors and Switches Sales and Revenue in Global (2020-2025)
7.9.5 Panasonic Key News & Latest Developments
7.10 Banner Engineering
7.10.1 Banner Engineering Company Summary
7.10.2 Banner Engineering Business Overview
7.10.3 Banner Engineering Safety Sensors and Switches Major Product Offerings
7.10.4 Banner Engineering Safety Sensors and Switches Sales and Revenue in Global (2020-2025)
7.10.5 Banner Engineering Key News & Latest Developments
7.11 ABB
7.11.1 ABB Company Summary
7.11.2 ABB Business Overview
7.11.3 ABB Safety Sensors and Switches Major Product Offerings
7.11.4 ABB Safety Sensors and Switches Sales and Revenue in Global (2020-2025)
7.11.5 ABB Key News & Latest Developments
7.12 Baumer
7.12.1 Baumer Company Summary
7.12.2 Baumer Business Overview
7.12.3 Baumer Safety Sensors and Switches Major Product Offerings
7.12.4 Baumer Safety Sensors and Switches Sales and Revenue in Global (2020-2025)
7.12.5 Baumer Key News & Latest Developments
7.13 Delphi
7.13.1 Delphi Company Summary
7.13.2 Delphi Business Overview
7.13.3 Delphi Safety Sensors and Switches Major Product Offerings
7.13.4 Delphi Safety Sensors and Switches Sales and Revenue in Global (2020-2025)
7.13.5 Delphi Key News & Latest Developments
7.14 Eaton
7.14.1 Eaton Company Summary
7.14.2 Eaton Business Overview
7.14.3 Eaton Safety Sensors and Switches Major Product Offerings
7.14.4 Eaton Safety Sensors and Switches Sales and Revenue in Global (2020-2025)
7.14.5 Eaton Key News & Latest Developments
7.15 Bernstein
7.15.1 Bernstein Company Summary
7.15.2 Bernstein Business Overview
7.15.3 Bernstein Safety Sensors and Switches Major Product Offerings
7.15.4 Bernstein Safety Sensors and Switches Sales and Revenue in Global (2020-2025)
7.15.5 Bernstein Key News & Latest Developments
7.16 Weidmüller
7.16.1 Weidmüller Company Summary
7.16.2 Weidmüller Business Overview
7.16.3 Weidmüller Safety Sensors and Switches Major Product Offerings
7.16.4 Weidmüller Safety Sensors and Switches Sales and Revenue in Global (2020-2025)
7.16.5 Weidmüller Key News & Latest Developments
8 Global Safety Sensors and Switches Production Capacity, Analysis
8.1 Global Safety Sensors and Switches Production Capacity, 2020-2032
8.2 Safety Sensors and Switches Production Capacity of Key Manufacturers in Global Market
8.3 Global Safety Sensors and Switches Production by Region
9 Key Market Trends, Opportunity, Drivers and Restraints
9.1 Market Opportunities & Trends
9.2 Market Drivers
9.3 Market Restraints
10 Safety Sensors and Switches Supply Chain Analysis
10.1 Safety Sensors and Switches Industry Value Chain
10.2 Safety Sensors and Switches Upstream Market
10.3 Safety Sensors and Switches Downstream and Clients
10.4 Marketing Channels Analysis
10.4.1 Marketing Channels
10.4.2 Safety Sensors and Switches Distributors and Sales Agents in Global
11 Conclusion
12 Appendix
12.1 Note
12.2 Examples of Clients
12.3 DisclaimerList of Tables
Table 1. Key Players of Safety Sensors and Switches in Global Market
Table 2. Top Safety Sensors and Switches Players in Global Market, Ranking by Revenue (2024)
Table 3. Global Safety Sensors and Switches Revenue by Companies, (US$, Mn), 2020-2025
Table 4. Global Safety Sensors and Switches Revenue Share by Companies, 2020-2025
Table 5. Global Safety Sensors and Switches Sales by Companies, (K Units), 2020-2025
Table 6. Global Safety Sensors and Switches Sales Share by Companies, 2020-2025
Table 7. Key Manufacturers Safety Sensors and Switches Price (2020-2025) & (USD/Unit)
Table 8. Global Manufacturers Safety Sensors and Switches Product Type
Table 9. List of Global Tier 1 Safety Sensors and Switches Companies, Revenue (US$, Mn) in 2024 and Market Share
Table 10. List of Global Tier 2 and Tier 3 Safety Sensors and Switches Companies, Revenue (US$, Mn) in 2024 and Market Share
Table 11. Segment by Type – Global Safety Sensors and Switches Revenue, (US$, Mn), 2024 & 2032
Table 12. Segment by Type – Global Safety Sensors and Switches Revenue (US$, Mn), 2020-2025
Table 13. Segment by Type – Global Safety Sensors and Switches Revenue (US$, Mn), 2026-2032
Table 14. Segment by Type – Global Safety Sensors and Switches Sales (K Units), 2020-2025
Table 15. Segment by Type – Global Safety Sensors and Switches Sales (K Units), 2026-2032
Table 16. Segment by Application – Global Safety Sensors and Switches Revenue, (US$, Mn), 2024 & 2032
Table 17. Segment by Application – Global Safety Sensors and Switches Revenue, (US$, Mn), 2020-2025
Table 18. Segment by Application – Global Safety Sensors and Switches Revenue, (US$, Mn), 2026-2032
Table 19. Segment by Application – Global Safety Sensors and Switches Sales, (K Units), 2020-2025
Table 20. Segment by Application – Global Safety Sensors and Switches Sales, (K Units), 2026-2032
Table 21. By Region – Global Safety Sensors and Switches Revenue, (US$, Mn), 2025-2032
Table 22. By Region – Global Safety Sensors and Switches Revenue, (US$, Mn), 2020-2025
Table 23. By Region – Global Safety Sensors and Switches Revenue, (US$, Mn), 2026-2032
Table 24. By Region – Global Safety Sensors and Switches Sales, (K Units), 2020-2025
Table 25. By Region – Global Safety Sensors and Switches Sales, (K Units), 2026-2032
Table 26. By Country – North America Safety Sensors and Switches Revenue, (US$, Mn), 2020-2025
Table 27. By Country – North America Safety Sensors and Switches Revenue, (US$, Mn), 2026-2032
Table 28. By Country – North America Safety Sensors and Switches Sales, (K Units), 2020-2025
Table 29. By Country – North America Safety Sensors and Switches Sales, (K Units), 2026-2032
Table 30. By Country – Europe Safety Sensors and Switches Revenue, (US$, Mn), 2020-2025
Table 31. By Country – Europe Safety Sensors and Switches Revenue, (US$, Mn), 2026-2032
Table 32. By Country – Europe Safety Sensors and Switches Sales, (K Units), 2020-2025
Table 33. By Country – Europe Safety Sensors and Switches Sales, (K Units), 2026-2032
Table 34. By Region – Asia Safety Sensors and Switches Revenue, (US$, Mn), 2020-2025
Table 35. By Region – Asia Safety Sensors and Switches Revenue, (US$, Mn), 2026-2032
Table 36. By Region – Asia Safety Sensors and Switches Sales, (K Units), 2020-2025
Table 37. By Region – Asia Safety Sensors and Switches Sales, (K Units), 2026-2032
Table 38. By Country – South America Safety Sensors and Switches Revenue, (US$, Mn), 2020-2025
Table 39. By Country – South America Safety Sensors and Switches Revenue, (US$, Mn), 2026-2032
Table 40. By Country – South America Safety Sensors and Switches Sales, (K Units), 2020-2025
Table 41. By Country – South America Safety Sensors and Switches Sales, (K Units), 2026-2032
Table 42. By Country – Middle East & Africa Safety Sensors and Switches Revenue, (US$, Mn), 2020-2025
Table 43. By Country – Middle East & Africa Safety Sensors and Switches Revenue, (US$, Mn), 2026-2032
Table 44. By Country – Middle East & Africa Safety Sensors and Switches Sales, (K Units), 2020-2025
Table 45. By Country – Middle East & Africa Safety Sensors and Switches Sales, (K Units), 2026-2032
Table 46. SICK Company Summary
Table 47. SICK Safety Sensors and Switches Product Offerings
Table 48. SICK Safety Sensors and Switches Sales (K Units), Revenue (US$, Mn) and Average Price (USD/Unit) & (2020-2025)
Table 49. SICK Key News & Latest Developments
Table 50. Pepperl+Fuchs Company Summary
Table 51. Pepperl+Fuchs Safety Sensors and Switches Product Offerings
Table 52. Pepperl+Fuchs Safety Sensors and Switches Sales (K Units), Revenue (US$, Mn) and Average Price (USD/Unit) & (2020-2025)
Table 53. Pepperl+Fuchs Key News & Latest Developments
Table 54. Rockwell Company Summary
Table 55. Rockwell Safety Sensors and Switches Product Offerings
Table 56. Rockwell Safety Sensors and Switches Sales (K Units), Revenue (US$, Mn) and Average Price (USD/Unit) & (2020-2025)
Table 57. Rockwell Key News & Latest Developments
Table 58. Ifm Company Summary
Table 59. Ifm Safety Sensors and Switches Product Offerings
Table 60. Ifm Safety Sensors and Switches Sales (K Units), Revenue (US$, Mn) and Average Price (USD/Unit) & (2020-2025)
Table 61. Ifm Key News & Latest Developments
Table 62. Omron Company Summary
Table 63. Omron Safety Sensors and Switches Product Offerings
Table 64. Omron Safety Sensors and Switches Sales (K Units), Revenue (US$, Mn) and Average Price (USD/Unit) & (2020-2025)
Table 65. Omron Key News & Latest Developments
Table 66. Datalogic Company Summary
Table 67. Datalogic Safety Sensors and Switches Product Offerings
Table 68. Datalogic Safety Sensors and Switches Sales (K Units), Revenue (US$, Mn) and Average Price (USD/Unit) & (2020-2025)
Table 69. Datalogic Key News & Latest Developments
Table 70. K. A. Schmersal Company Summary
Table 71. K. A. Schmersal Safety Sensors and Switches Product Offerings
Table 72. K. A. Schmersal Safety Sensors and Switches Sales (K Units), Revenue (US$, Mn) and Average Price (USD/Unit) & (2020-2025)
Table 73. K. A. Schmersal Key News & Latest Developments
Table 74. IDEC Company Summary
Table 75. IDEC Safety Sensors and Switches Product Offerings
Table 76. IDEC Safety Sensors and Switches Sales (K Units), Revenue (US$, Mn) and Average Price (USD/Unit) & (2020-2025)
Table 77. IDEC Key News & Latest Developments
Table 78. Panasonic Company Summary
Table 79. Panasonic Safety Sensors and Switches Product Offerings
Table 80. Panasonic Safety Sensors and Switches Sales (K Units), Revenue (US$, Mn) and Average Price (USD/Unit) & (2020-2025)
Table 81. Panasonic Key News & Latest Developments
Table 82. Banner Engineering Company Summary
Table 83. Banner Engineering Safety Sensors and Switches Product Offerings
Table 84. Banner Engineering Safety Sensors and Switches Sales (K Units), Revenue (US$, Mn) and Average Price (USD/Unit) & (2020-2025)
Table 85. Banner Engineering Key News & Latest Developments
Table 86. ABB Company Summary
Table 87. ABB Safety Sensors and Switches Product Offerings
Table 88. ABB Safety Sensors and Switches Sales (K Units), Revenue (US$, Mn) and Average Price (USD/Unit) & (2020-2025)
Table 89. ABB Key News & Latest Developments
Table 90. Baumer Company Summary
Table 91. Baumer Safety Sensors and Switches Product Offerings
Table 92. Baumer Safety Sensors and Switches Sales (K Units), Revenue (US$, Mn) and Average Price (USD/Unit) & (2020-2025)
Table 93. Baumer Key News & Latest Developments
Table 94. Delphi Company Summary
Table 95. Delphi Safety Sensors and Switches Product Offerings
Table 96. Delphi Safety Sensors and Switches Sales (K Units), Revenue (US$, Mn) and Average Price (USD/Unit) & (2020-2025)
Table 97. Delphi Key News & Latest Developments
Table 98. Eaton Company Summary
Table 99. Eaton Safety Sensors and Switches Product Offerings
Table 100. Eaton Safety Sensors and Switches Sales (K Units), Revenue (US$, Mn) and Average Price (USD/Unit) & (2020-2025)
Table 101. Eaton Key News & Latest Developments
Table 102. Bernstein Company Summary
Table 103. Bernstein Safety Sensors and Switches Product Offerings
Table 104. Bernstein Safety Sensors and Switches Sales (K Units), Revenue (US$, Mn) and Average Price (USD/Unit) & (2020-2025)
Table 105. Bernstein Key News & Latest Developments
Table 106. Weidmüller Company Summary
Table 107. Weidmüller Safety Sensors and Switches Product Offerings
Table 108. Weidmüller Safety Sensors and Switches Sales (K Units), Revenue (US$, Mn) and Average Price (USD/Unit) & (2020-2025)
Table 109. Weidmüller Key News & Latest Developments
Table 110. Safety Sensors and Switches Capacity of Key Manufacturers in Global Market, 2023-2025 (K Units)
Table 111. Global Safety Sensors and Switches Capacity Market Share of Key Manufacturers, 2023-2025
Table 112. Global Safety Sensors and Switches Production by Region, 2020-2025 (K Units)
Table 113. Global Safety Sensors and Switches Production by Region, 2026-2032 (K Units)
Table 114. Safety Sensors and Switches Market Opportunities & Trends in Global Market
Table 115. Safety Sensors and Switches Market Drivers in Global Market
Table 116. Safety Sensors and Switches Market Restraints in Global Market
Table 117. Safety Sensors and Switches Raw Materials
Table 118. Safety Sensors and Switches Raw Materials Suppliers in Global Market
Table 119. Typical Safety Sensors and Switches Downstream
Table 120. Safety Sensors and Switches Downstream Clients in Global Market
Table 121. Safety Sensors and Switches Distributors and Sales Agents in Global Market

List of Figures
Figure 1. Safety Sensors and Switches Product Picture
Figure 2. Safety Sensors and Switches Segment by Type in 2024
Figure 3. Safety Sensors and Switches Segment by Application in 2024
Figure 4. Global Safety Sensors and Switches Market Overview: 2024
Figure 5. Key Caveats
Figure 6. Global Safety Sensors and Switches Market Size: 2024 VS 2032 (US$, Mn)
Figure 7. Global Safety Sensors and Switches Revenue: 2020-2032 (US$, Mn)
Figure 8. Safety Sensors and Switches Sales in Global Market: 2020-2032 (K Units)
Figure 9. The Top 3 and 5 Players Market Share by Safety Sensors and Switches Revenue in 2024
Figure 10. Segment by Type – Global Safety Sensors and Switches Revenue, (US$, Mn), 2024 & 2032
Figure 11. Segment by Type – Global Safety Sensors and Switches Revenue Market Share, 2020-2032
Figure 12. Segment by Type – Global Safety Sensors and Switches Sales Market Share, 2020-2032
Figure 13. Segment by Type – Global Safety Sensors and Switches Price (USD/Unit), 2020-2032
Figure 14. Segment by Application – Global Safety Sensors and Switches Revenue, (US$, Mn), 2024 & 2032
Figure 15. Segment by Application – Global Safety Sensors and Switches Revenue Market Share, 2020-2032
Figure 16. Segment by Application – Global Safety Sensors and Switches Sales Market Share, 2020-2032
Figure 17. Segment by Application -Global Safety Sensors and Switches Price (USD/Unit), 2020-2032
Figure 18. By Region – Global Safety Sensors and Switches Revenue, (US$, Mn), 2025 & 2032
Figure 19. By Region – Global Safety Sensors and Switches Revenue Market Share, 2020 VS 2024 VS 2032
Figure 20. By Region – Global Safety Sensors and Switches Revenue Market Share, 2020-2032
Figure 21. By Region – Global Safety Sensors and Switches Sales Market Share, 2020-2032
Figure 22. By Country – North America Safety Sensors and Switches Revenue Market Share, 2020-2032
Figure 23. By Country – North America Safety Sensors and Switches Sales Market Share, 2020-2032
Figure 24. United States Safety Sensors and Switches Revenue, (US$, Mn), 2020-2032
Figure 25. Canada Safety Sensors and Switches Revenue, (US$, Mn), 2020-2032
Figure 26. Mexico Safety Sensors and Switches Revenue, (US$, Mn), 2020-2032
Figure 27. By Country – Europe Safety Sensors and Switches Revenue Market Share, 2020-2032
Figure 28. By Country – Europe Safety Sensors and Switches Sales Market Share, 2020-2032
Figure 29. Germany Safety Sensors and Switches Revenue, (US$, Mn), 2020-2032
Figure 30. France Safety Sensors and Switches Revenue, (US$, Mn), 2020-2032
Figure 31. U.K. Safety Sensors and Switches Revenue, (US$, Mn), 2020-2032
Figure 32. Italy Safety Sensors and Switches Revenue, (US$, Mn), 2020-2032
Figure 33. Russia Safety Sensors and Switches Revenue, (US$, Mn), 2020-2032
Figure 34. Nordic Countries Safety Sensors and Switches Revenue, (US$, Mn), 2020-2032
Figure 35. Benelux Safety Sensors and Switches Revenue, (US$, Mn), 2020-2032
Figure 36. By Region – Asia Safety Sensors and Switches Revenue Market Share, 2020-2032
Figure 37. By Region – Asia Safety Sensors and Switches Sales Market Share, 2020-2032
Figure 38. China Safety Sensors and Switches Revenue, (US$, Mn), 2020-2032
Figure 39. Japan Safety Sensors and Switches Revenue, (US$, Mn), 2020-2032
Figure 40. South Korea Safety Sensors and Switches Revenue, (US$, Mn), 2020-2032
Figure 41. Southeast Asia Safety Sensors and Switches Revenue, (US$, Mn), 2020-2032
Figure 42. India Safety Sensors and Switches Revenue, (US$, Mn), 2020-2032
Figure 43. By Country – South America Safety Sensors and Switches Revenue Market Share, 2020-2032
Figure 44. By Country – South America Safety Sensors and Switches Sales, Market Share, 2020-2032
Figure 45. Brazil Safety Sensors and Switches Revenue, (US$, Mn), 2020-2032
Figure 46. Argentina Safety Sensors and Switches Revenue, (US$, Mn), 2020-2032
Figure 47. By Country – Middle East & Africa Safety Sensors and Switches Revenue, Market Share, 2020-2032
Figure 48. By Country – Middle East & Africa Safety Sensors and Switches Sales, Market Share, 2020-2032
Figure 49. Turkey Safety Sensors and Switches Revenue, (US$, Mn), 2020-2032
Figure 50. Israel Safety Sensors and Switches Revenue, (US$, Mn), 2020-2032
Figure 51. Saudi Arabia Safety Sensors and Switches Revenue, (US$, Mn), 2020-2032
Figure 52. UAE Safety Sensors and Switches Revenue, (US$, Mn), 2020-2032
Figure 53. Global Safety Sensors and Switches Production Capacity (K Units), 2020-2032
Figure 54. The Percentage of Production Safety Sensors and Switches by Region, 2024 VS 2032
Figure 55. Safety Sensors and Switches Industry Value Chain
Figure 56. Marketing Channels