Ready-To-Use Temperature Indicators Market, Trends, Business Strategies 2025-2032

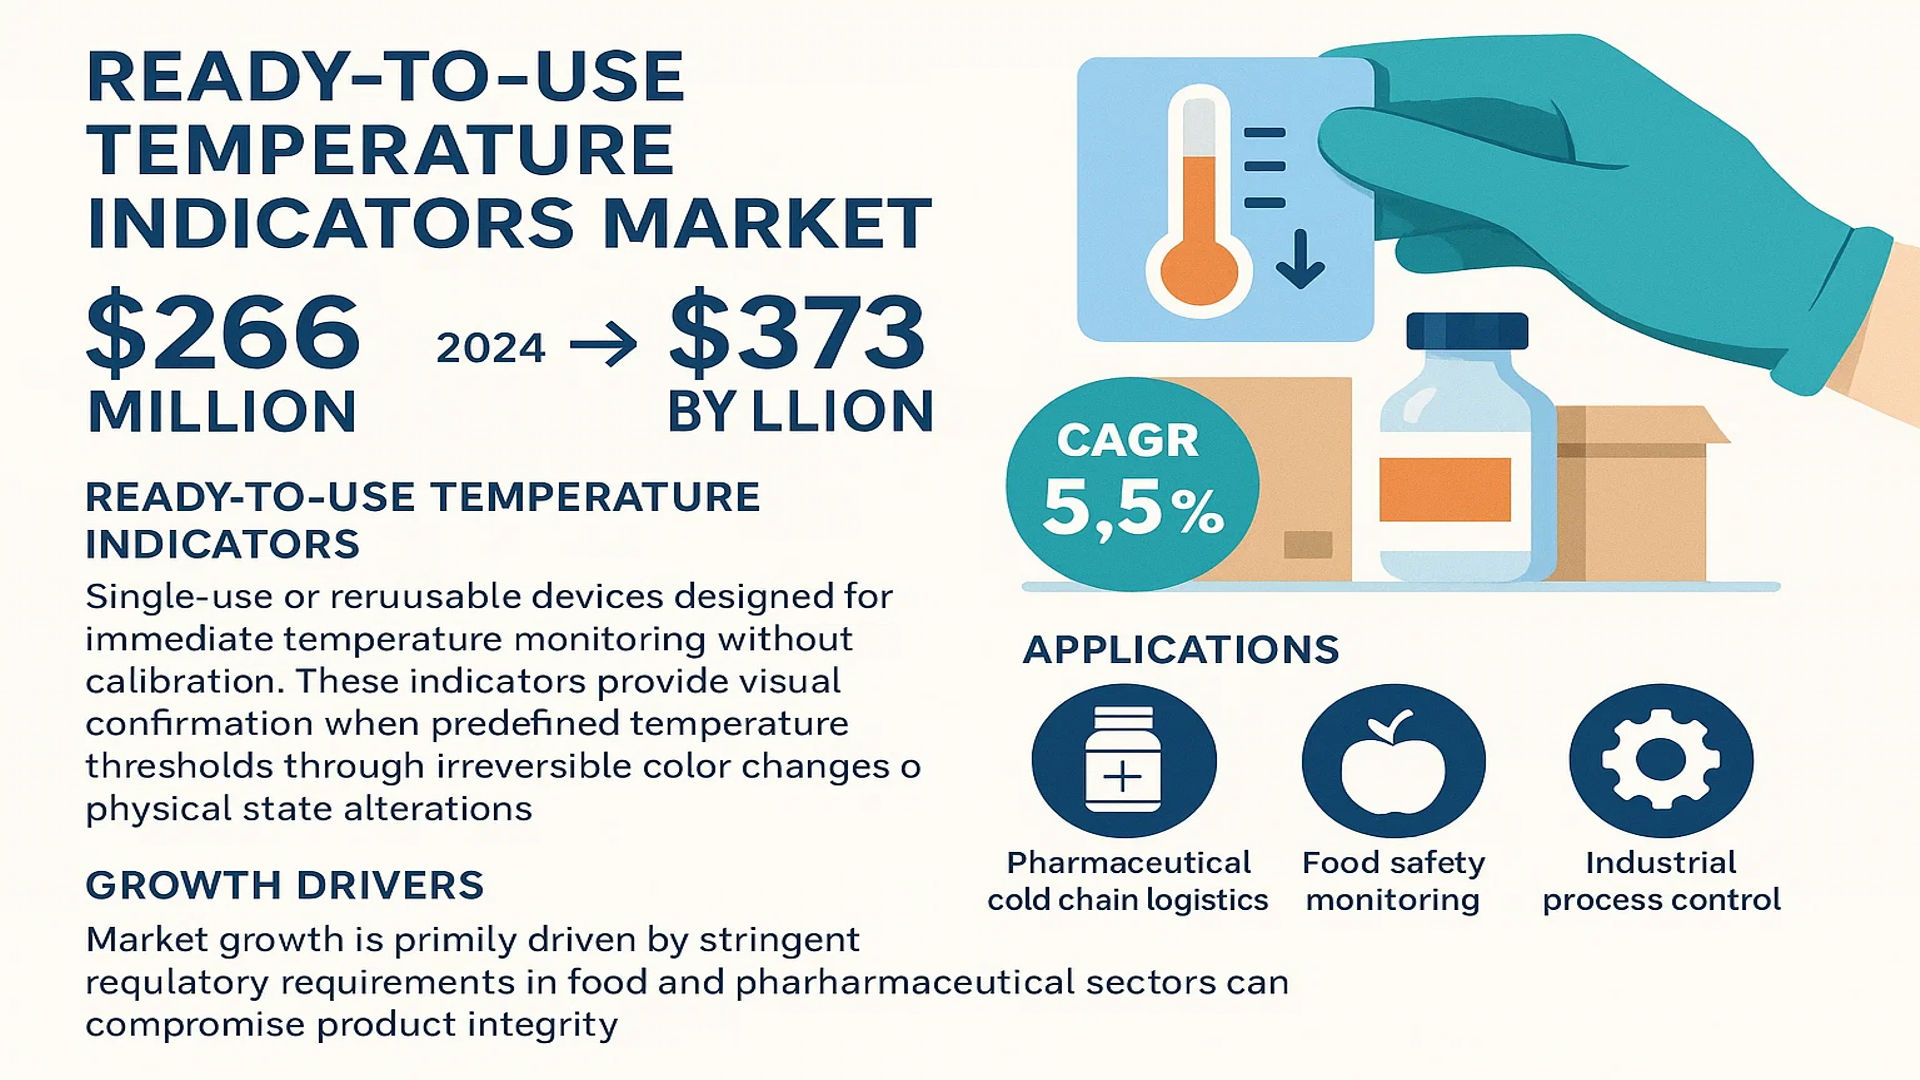
Ready-To-Use Temperature Indicators Market was valued at 266 million in 2024 and is projected to reach US$ 373 million by 2032, at a CAGR of 5.5% during the forecast period

PDF Icon Download Sample Report PDF
  • Quick Dispatch

    All Orders

  • Secure Payment

    100% Secure Payment

Price range: $1,500.00 through $4,250.00

Clear

MARKET INSIGHTS

The global Ready-To-Use Temperature Indicators Market was valued at 266 million in 2024 and is projected to reach US$ 373 million by 2032, at a CAGR of 5.5% during the forecast period.

Ready-to-use temperature indicators are single-use or reusable devices designed for immediate temperature monitoring without requiring calibration. These indicators provide visual confirmation when predefined temperature thresholds are breached, typically through irreversible color changes or physical state alterations. The technology finds widespread application in pharmaceutical cold chain logistics, food safety monitoring, and industrial process control.

Market growth is primarily driven by stringent regulatory requirements in food and pharmaceutical sectors, where temperature excursions can compromise product integrity. The disposable segment currently dominates with over 60% market share, particularly for vaccine transportation applications. Key players like Zebra Technologies and Sensitech are expanding their portfolios with smart indicators featuring NFC connectivity, though traditional chemical-based indicators still account for 75% of unit sales. The U.S. holds the largest regional market share at 32%, followed by Europe at 28%, with Asia-Pacific showing the fastest growth at 7.1% CAGR due to expanding cold chain infrastructure.
Ready-To-Use Temperature Indicators Market

MARKET DYNAMICS

MARKET DRIVERS

Stringent Regulatory Requirements in Food & Pharmaceutical Sectors to Fuel Adoption

The global ready-to-use temperature indicators market is experiencing significant growth driven by increasingly stringent regulations in food safety and pharmaceutical storage. Regulatory bodies worldwide have mandated strict temperature monitoring for perishable goods and sensitive medical supplies. Temperature excursions during logistics can compromise product integrity, leading to waste and regulatory violations. Ready-to-use indicators provide real-time visual alerts without complex setups, making them indispensable for compliance.

In pharmaceutical cold chains where biologics and vaccines demand precise temperature control, these indicators help maintain product efficacy. Recent industry analysis shows that nearly 25% of pharmaceutical product recalls stem from temperature violations during transit. This drives demand for simple monitoring solutions that can be deployed at scale across distribution networks.

Growth in Cold Chain Logistics to Accelerate Market Expansion

The expanding cold chain logistics sector, particularly for food and healthcare products, presents a major growth opportunity. With global cold chain market projected to exceed $600 billion by 2030, temperature monitoring solutions are becoming essential components of supply chain infrastructure.

E-commerce expansion for perishables and increasing international trade of temperature-sensitive goods further drives demand. Ready-to-use indicators provide cost-effective solutions for last-mile delivery validation, where traditional monitoring systems prove impractical.

Urbanization and rising disposable incomes in developing economies are creating new demand for processed foods and pharmaceuticals, indirectly supporting temperature indicator adoption.

The medical industry represents another high-growth sector, particularly for blood banks and vaccine distribution networks where temperature deviations can have life-threatening consequences.

MARKET RESTRAINTS

Limitations in Accuracy and Precision to Constrain Adoption

While ready-to-use temperature indicators offer convenience, their technical limitations present significant market challenges. Most indicators provide binary (pass/fail) alerts rather than continuous monitoring, making them unsuitable for applications requiring precise temperature history.

The irreversible nature of many indicators also limits their use in quality control processes where documentation of temperature fluctuations is required. This becomes problematic in pharmaceutical applications where complete temperature profiles are mandated by regulatory requirements.

Price Competition from Alternative Monitoring Solutions

The market faces growing competition from digital monitoring solutions that offer real-time tracking and data logging capabilities. While more expensive initially, these systems provide comprehensive data that can integrate with IoT platforms and supply chain management software.

Additionally, the emergence of reusable indicators with digital interfaces presents cost-effective alternatives for high-frequency applications. These technological alternatives may limit the price premium that disposable indicators can command in the market.

MARKET CHALLENGES

Standardization and Compliance Variations Across Regions

The ready-to-use temperature indicator market faces significant challenges from inconsistent regulatory standards across different markets. While some regions have well-defined validation requirements, others lack clear guidelines for acceptance criteria and performance benchmarks.

This regulatory fragmentation forces manufacturers to develop region-specific products, increasing R&D costs and complicating global distribution strategies. The absence of universal standards also creates uncertainty for end-users when selecting appropriate indicators for international shipments.

Other Challenges

Environmental Concerns
The disposable nature of most ready-to-use indicators raises sustainability concerns, particularly in markets with strict waste regulations. Single-use plastics and chemical components in indicators face increasing scrutiny from environmental groups and regulators.

Counterfeit Products
The relative simplicity of some indicator technologies has led to counterfeit products entering the market. These unreliable solutions undermine confidence in the technology and could lead to stricter certification requirements that increase industry costs.

MARKET OPPORTUNITIES

Smart Indicator Integration with Digital Platforms to Create New Revenue Streams

The convergence of traditional indicator technologies with digital solutions presents significant growth opportunities. Hybrid indicators that combine visual alerts with digital data capture capabilities can command premium pricing while meeting regulatory documentation requirements.

Integration with blockchain for tamper-proof temperature certification represents another emerging opportunity, particularly for high-value pharmaceuticals and specialty foods. These advanced solutions can create new service-based revenue models beyond simple product sales.

Emerging Market Expansion Potential

Developing economies with growing healthcare infrastructure and modernizing food distribution networks offer substantial untapped potential. As these regions implement stricter safety regulations, demand for cost-effective monitoring solutions is expected to rise significantly.

Localized product development addressing specific climate challenges and supply chain realities in these markets could drive the next wave of industry growth. Strategic partnerships with regional distributors and logistics providers will be key to capturing this opportunity.

READY-TO-USE TEMPERATURE INDICATORS MARKET TRENDS

Rising Demand in Cold Chain Logistics Driving Market Growth

The ready-to-use temperature indicators market is experiencing substantial growth, primarily fueled by stringent regulatory requirements in cold chain logistics, particularly in pharmaceuticals and perishable food transportation. Recent data indicates that nearly 70% of temperature-sensitive pharmaceutical products, including vaccines and biologics, require continuous monitoring during transit to maintain efficacy. The global market for these indicators has expanded alongside the broader $17.2 billion cold chain logistics industry, which is growing at a 7-9% annual rate. Disposable temperature indicators, which dominate over 60% of market share, are widely adopted for their cost-efficiency and compliance with single-use protocols in healthcare.

Other Trends

Technological Advancements in Smart Indicators

Innovations such as time-temperature integrators (TTIs) with extended sensitivity ranges and NFC-enabled indicators are reshaping the landscape. These solutions offer real-time data logging capabilities, which align with Industry 4.0 adoption in supply chains. For instance, the integration of IoT-enabled sensors with disposable indicators has improved end-to-end visibility, reducing temperature excursion risks by 35-40% in pharmaceutical logistics. Manufacturers are increasingly focusing on biodegradable materials to address sustainability concerns, particularly in Europe and North America where environmental regulations are stringent.

Food Safety Regulations Accelerating Adoption

Heightened food safety standards, such as the FDA’s Food Safety Modernization Act (FSMA), are compelling food manufacturers and retailers to adopt ready-to-use indicators for temperature-sensitive products. The global food & beverage segment, accounting for approximately 28% of market revenue, relies on these indicators to prevent spoilage and comply with HACCP guidelines. Emerging economies in Asia-Pacific, where cold chain infrastructure is rapidly developing, are witnessing double-digit growth in demand, with China projected to contribute 25% of total sales by 2032. The rise of e-commerce grocery platforms further amplifies this trend, as temperature-controlled last-mile delivery becomes critical.

COMPETITIVE LANDSCAPE

Key Industry Players

Market Leaders Invest in Innovation to Address Temperature Monitoring Demands Across Industries

The global ready-to-use temperature indicators market features a moderately competitive landscape with established players and emerging specialists competing across key regions. Zebra Technologies has secured a leading position, leveraging its expertise in tracking solutions and industrial automation to deliver high-precision temperature monitoring products. The company’s recent strategic acquisitions have further expanded its product capabilities in cold chain logistics, particularly for pharmaceutical applications.

SpotSee maintains a strong presence through its comprehensive range of shock, tilt, and temperature indicators, with specific solutions designed for aerospace, healthcare, and food safety applications. The company’s patented technology in irreversible color-change indicators has made it a preferred choice for compliance monitoring in regulated industries.

Meanwhile, Sensitech, a Carrier Global company, has reinforced its market position through continuous innovations in IoT-enabled temperature monitoring solutions. The company’s dual focus on disposable indicators and advanced data loggers allows it to serve diverse customer needs from small businesses to multinational corporations.

List of Key Ready-To-Use Temperature Indicators Companies

Tempmate (Australia)

The competition intensifies as companies develop specialized indicators for emerging applications like mRNA vaccine distribution and perishable e-commerce shipments. Smaller players like Timestrip and Kelgray compete through niche solutions, while larger corporations increasingly acquire innovative startups to expand their technological capabilities. This dynamic ensures continuous market evolution, driving improved accuracy, expanded temperature ranges, and enhanced user convenience across all product categories.

Segment Analysis:

By Type

Disposable Segment Leads Due to Cost-Effectiveness and Ease of Use

The market is segmented based on type into:

  • Disposable
  • Non-Disposable

By Application

Medical Industry Dominates with Stringent Temperature Monitoring Requirements

The market is segmented based on application into:

  • Medical Industry
  • Food & Beverage
  • Others

By Technology

Color-Changing Indicators Gain Preference for Visual Confirmation

The market is segmented based on technology into:

  • Color-changing indicators
  • Digital indicators
  • Chemical indicators

By Temperature Range

Medium Range Segment (0°C to 30°C) Holds Largest Share for Common Applications

The market is segmented based on temperature range into:

  • Low temperature range (below 0°C)
  • Medium temperature range (0°C to 30°C)
  • High temperature range (above 30°C)

Regional Analysis: Ready-To-Use Temperature Indicators Market

North America
North America dominates the global Ready-To-Use Temperature Indicators market, primarily due to stringent regulatory frameworks in healthcare and food safety, including FDA compliance mandates. The U.S. accounts for the largest share, driven by high adoption in pharmaceuticals and cold chain logistics. The demand is further accelerated by increasing investments in biopharmaceutical cold storage and the need for precise temperature monitoring during vaccine distribution. Leading manufacturers like Zebra Technologies and Sensitech are headquartered here, providing advanced disposable indicators tailored for medical and food applications. Sustainability trends are also pushing innovations in eco-friendly materials, though cost remains a challenge for widespread adoption in cost-sensitive sectors.

Europe
Europe follows closely, with strong growth attributed to strict EU regulations on temperature-sensitive product transportation, such as the European Medicines Agency (EMA) guidelines. Countries like Germany and France lead in adoption, supported by their robust pharmaceutical and perishable food industries. The market benefits from a focus on smart indicators integrating IoT for real-time monitoring, though higher costs of advanced solutions limit penetration in Eastern Europe. Key players, including JUMO and Timestrip, emphasize compliance with REACH and other environmental standards, fostering trust in quality and reliability.

Asia-Pacific
The Asia-Pacific region is the fastest-growing market, propelled by expanding healthcare infrastructure and rapid urbanization. China and India are pivotal, with increasing government initiatives to strengthen cold chain systems for vaccines and food safety. However, the market remains price-sensitive, with disposable indicators gaining traction over reusable variants due to lower upfront costs. Local manufacturers are emerging, but international brands like SpotSee are leveraging partnerships to capture share. Challenges include inconsistent regulatory enforcement and varying climatic conditions requiring adaptive solutions.

South America
South America shows moderate growth, with Brazil as the key market due to its growing pharmaceutical sector and agricultural exports. Adoption is hindered by economic instability and fragmented logistics networks. Despite this, rising awareness of food waste reduction and the need for temperature assurance in meat and dairy exports are creating opportunities. Manufacturers face hurdles in scaling due to limited local production capabilities, relying heavily on imports.

Middle East & Africa
This region presents nascent but promising demand, particularly in GCC countries like Saudi Arabia and the UAE, where healthcare modernization and perishable imports drive indicator usage. Africa’s market is constrained by underdeveloped infrastructure, though initiatives like the African Continental Free Trade Area (AfCFTA) may spur growth. The focus remains on cost-effective disposable solutions, with multinational companies gradually establishing local distribution channels to cater to niche applications in pharmaceuticals and hospitality.

Report Scope

This market research report provides a comprehensive analysis of the global and regional Ready-To-Use Temperature Indicators markets, covering the forecast period 2024–2032. It offers detailed insights into market dynamics, technological advancements, competitive landscape, and key trends shaping the industry.

Key focus areas of the report include:

  • Market Size & Forecast: Historical data and future projections for revenue, unit shipments, and market value across major regions and segments. The global Ready-To-Use Temperature Indicators market was valued at USD 266 million in 2024 and is projected to reach USD 373 million by 2032, growing at a CAGR of 5.5%.
  • Segmentation Analysis: Detailed breakdown by product type (disposable vs. non-disposable), application (medical industry, food & beverage, others), and end-user industry to identify high-growth segments and investment opportunities.
  • Regional Outlook: Insights into market performance across North America, Europe, Asia-Pacific, Latin America, and the Middle East & Africa, including country-level analysis. The U.S. market is estimated at USD million in 2024, while China is projected to reach USD million.
  • Competitive Landscape: Profiles of leading market participants including Zebra Technologies, CSSI Technologies, Sensitech, MultiSystems, Kelgray, Timestrip, Tempmate, SpotSee, Minco, and JUMO, covering their product offerings, market share, and recent developments.
  • Technology Trends & Innovation: Assessment of emerging technologies in temperature monitoring, integration with IoT solutions, and advancements in indicator materials and designs.
  • Market Drivers & Restraints: Evaluation of factors driving market growth such as stringent food safety regulations and vaccine cold chain requirements, along with challenges including price sensitivity and competition from alternative monitoring solutions.
  • Stakeholder Analysis: Insights for manufacturers, suppliers, distributors, healthcare providers, food processors, and policymakers regarding market opportunities and strategic decisions.

Primary and secondary research methods are employed, including interviews with industry experts, data from verified sources, and comprehensive market analysis to ensure the accuracy and reliability of the insights presented.

FREQUENTLY ASKED QUESTIONS:

What is the current market size of Global Ready-To-Use Temperature Indicators Market?

-> Ready-To-Use Temperature Indicators Market was valued at 266 million in 2024 and is projected to reach US$ 373 million by 2032, at a CAGR of 5.5% during the forecast period.

Which key companies operate in Global Ready-To-Use Temperature Indicators Market?

-> Key players include Zebra Technologies, CSSI Technologies, Sensitech, MultiSystems, Kelgray, Timestrip, Tempmate, SpotSee, Minco, and JUMO, among others.

What are the key growth drivers?

-> Key growth drivers include increasing food safety regulations, growing pharmaceutical cold chain requirements, and demand for simple temperature monitoring solutions.

Which region dominates the market?

-> North America currently leads the market, while Asia-Pacific is expected to show the highest growth rate during the forecast period.

What are the emerging trends?

-> Emerging trends include development of smart indicators with digital capabilities, eco-friendly disposable indicators, and integration with supply chain management systems.

Ready-To-Use Temperature Indicators Market, Trends, Business Strategies 2025-2032

Get Sample Report PDF for Exclusive Insights

Report Sample Includes

  • Table of Contents
  • List of Tables & Figures
  • Charts, Research Methodology, and more...
PDF Icon Download Sample Report PDF
SKU: 87ede266a844
Category:

Download Sample Report

Table of Content

1 Introduction to Research & Analysis Reports
1.1 Ready-To-Use Temperature Indicators Market Definition
1.2 Market Segments
1.2.1 Segment by Type
1.2.2 Segment by Application
1.3 Global Ready-To-Use Temperature Indicators Market Overview
1.4 Features & Benefits of This Report
1.5 Methodology & Sources of Information
1.5.1 Research Methodology
1.5.2 Research Process
1.5.3 Base Year
1.5.4 Report Assumptions & Caveats
2 Global Ready-To-Use Temperature Indicators Overall Market Size
2.1 Global Ready-To-Use Temperature Indicators Market Size: 2024 VS 2032
2.2 Global Ready-To-Use Temperature Indicators Market Size, Prospects & Forecasts: 2020-2032
2.3 Global Ready-To-Use Temperature Indicators Sales: 2020-2032
3 Company Landscape
3.1 Top Ready-To-Use Temperature Indicators Players in Global Market
3.2 Top Global Ready-To-Use Temperature Indicators Companies Ranked by Revenue
3.3 Global Ready-To-Use Temperature Indicators Revenue by Companies
3.4 Global Ready-To-Use Temperature Indicators Sales by Companies
3.5 Global Ready-To-Use Temperature Indicators Price by Manufacturer (2020-2025)
3.6 Top 3 and Top 5 Ready-To-Use Temperature Indicators Companies in Global Market, by Revenue in 2024
3.7 Global Manufacturers Ready-To-Use Temperature Indicators Product Type
3.8 Tier 1, Tier 2, and Tier 3 Ready-To-Use Temperature Indicators Players in Global Market
3.8.1 List of Global Tier 1 Ready-To-Use Temperature Indicators Companies
3.8.2 List of Global Tier 2 and Tier 3 Ready-To-Use Temperature Indicators Companies
4 Sights by Product
4.1 Overview
4.1.1 Segment by Type – Global Ready-To-Use Temperature Indicators Market Size Markets, 2024 & 2032
4.1.2 Disposable
4.1.3 Non-Disposable
4.2 Segment by Type – Global Ready-To-Use Temperature Indicators Revenue & Forecasts
4.2.1 Segment by Type – Global Ready-To-Use Temperature Indicators Revenue, 2020-2025
4.2.2 Segment by Type – Global Ready-To-Use Temperature Indicators Revenue, 2026-2032
4.2.3 Segment by Type – Global Ready-To-Use Temperature Indicators Revenue Market Share, 2020-2032
4.3 Segment by Type – Global Ready-To-Use Temperature Indicators Sales & Forecasts
4.3.1 Segment by Type – Global Ready-To-Use Temperature Indicators Sales, 2020-2025
4.3.2 Segment by Type – Global Ready-To-Use Temperature Indicators Sales, 2026-2032
4.3.3 Segment by Type – Global Ready-To-Use Temperature Indicators Sales Market Share, 2020-2032
4.4 Segment by Type – Global Ready-To-Use Temperature Indicators Price (Manufacturers Selling Prices), 2020-2032
5 Sights by Application
5.1 Overview
5.1.1 Segment by Application – Global Ready-To-Use Temperature Indicators Market Size, 2024 & 2032
5.1.2 Medical Industry
5.1.3 Food & Beverage
5.1.4 Others
5.2 Segment by Application – Global Ready-To-Use Temperature Indicators Revenue & Forecasts
5.2.1 Segment by Application – Global Ready-To-Use Temperature Indicators Revenue, 2020-2025
5.2.2 Segment by Application – Global Ready-To-Use Temperature Indicators Revenue, 2026-2032
5.2.3 Segment by Application – Global Ready-To-Use Temperature Indicators Revenue Market Share, 2020-2032
5.3 Segment by Application – Global Ready-To-Use Temperature Indicators Sales & Forecasts
5.3.1 Segment by Application – Global Ready-To-Use Temperature Indicators Sales, 2020-2025
5.3.2 Segment by Application – Global Ready-To-Use Temperature Indicators Sales, 2026-2032
5.3.3 Segment by Application – Global Ready-To-Use Temperature Indicators Sales Market Share, 2020-2032
5.4 Segment by Application – Global Ready-To-Use Temperature Indicators Price (Manufacturers Selling Prices), 2020-2032
6 Sights by Region
6.1 By Region – Global Ready-To-Use Temperature Indicators Market Size, 2024 & 2032
6.2 By Region – Global Ready-To-Use Temperature Indicators Revenue & Forecasts
6.2.1 By Region – Global Ready-To-Use Temperature Indicators Revenue, 2020-2025
6.2.2 By Region – Global Ready-To-Use Temperature Indicators Revenue, 2026-2032
6.2.3 By Region – Global Ready-To-Use Temperature Indicators Revenue Market Share, 2020-2032
6.3 By Region – Global Ready-To-Use Temperature Indicators Sales & Forecasts
6.3.1 By Region – Global Ready-To-Use Temperature Indicators Sales, 2020-2025
6.3.2 By Region – Global Ready-To-Use Temperature Indicators Sales, 2026-2032
6.3.3 By Region – Global Ready-To-Use Temperature Indicators Sales Market Share, 2020-2032
6.4 North America
6.4.1 By Country – North America Ready-To-Use Temperature Indicators Revenue, 2020-2032
6.4.2 By Country – North America Ready-To-Use Temperature Indicators Sales, 2020-2032
6.4.3 United States Ready-To-Use Temperature Indicators Market Size, 2020-2032
6.4.4 Canada Ready-To-Use Temperature Indicators Market Size, 2020-2032
6.4.5 Mexico Ready-To-Use Temperature Indicators Market Size, 2020-2032
6.5 Europe
6.5.1 By Country – Europe Ready-To-Use Temperature Indicators Revenue, 2020-2032
6.5.2 By Country – Europe Ready-To-Use Temperature Indicators Sales, 2020-2032
6.5.3 Germany Ready-To-Use Temperature Indicators Market Size, 2020-2032
6.5.4 France Ready-To-Use Temperature Indicators Market Size, 2020-2032
6.5.5 U.K. Ready-To-Use Temperature Indicators Market Size, 2020-2032
6.5.6 Italy Ready-To-Use Temperature Indicators Market Size, 2020-2032
6.5.7 Russia Ready-To-Use Temperature Indicators Market Size, 2020-2032
6.5.8 Nordic Countries Ready-To-Use Temperature Indicators Market Size, 2020-2032
6.5.9 Benelux Ready-To-Use Temperature Indicators Market Size, 2020-2032
6.6 Asia
6.6.1 By Region – Asia Ready-To-Use Temperature Indicators Revenue, 2020-2032
6.6.2 By Region – Asia Ready-To-Use Temperature Indicators Sales, 2020-2032
6.6.3 China Ready-To-Use Temperature Indicators Market Size, 2020-2032
6.6.4 Japan Ready-To-Use Temperature Indicators Market Size, 2020-2032
6.6.5 South Korea Ready-To-Use Temperature Indicators Market Size, 2020-2032
6.6.6 Southeast Asia Ready-To-Use Temperature Indicators Market Size, 2020-2032
6.6.7 India Ready-To-Use Temperature Indicators Market Size, 2020-2032
6.7 South America
6.7.1 By Country – South America Ready-To-Use Temperature Indicators Revenue, 2020-2032
6.7.2 By Country – South America Ready-To-Use Temperature Indicators Sales, 2020-2032
6.7.3 Brazil Ready-To-Use Temperature Indicators Market Size, 2020-2032
6.7.4 Argentina Ready-To-Use Temperature Indicators Market Size, 2020-2032
6.8 Middle East & Africa
6.8.1 By Country – Middle East & Africa Ready-To-Use Temperature Indicators Revenue, 2020-2032
6.8.2 By Country – Middle East & Africa Ready-To-Use Temperature Indicators Sales, 2020-2032
6.8.3 Turkey Ready-To-Use Temperature Indicators Market Size, 2020-2032
6.8.4 Israel Ready-To-Use Temperature Indicators Market Size, 2020-2032
6.8.5 Saudi Arabia Ready-To-Use Temperature Indicators Market Size, 2020-2032
6.8.6 UAE Ready-To-Use Temperature Indicators Market Size, 2020-2032
7 Manufacturers & Brands Profiles
7.1 Zebra Technologies
7.1.1 Zebra Technologies Company Summary
7.1.2 Zebra Technologies Business Overview
7.1.3 Zebra Technologies Ready-To-Use Temperature Indicators Major Product Offerings
7.1.4 Zebra Technologies Ready-To-Use Temperature Indicators Sales and Revenue in Global (2020-2025)
7.1.5 Zebra Technologies Key News & Latest Developments
7.2 CSSI Technologies
7.2.1 CSSI Technologies Company Summary
7.2.2 CSSI Technologies Business Overview
7.2.3 CSSI Technologies Ready-To-Use Temperature Indicators Major Product Offerings
7.2.4 CSSI Technologies Ready-To-Use Temperature Indicators Sales and Revenue in Global (2020-2025)
7.2.5 CSSI Technologies Key News & Latest Developments
7.3 Sensitech
7.3.1 Sensitech Company Summary
7.3.2 Sensitech Business Overview
7.3.3 Sensitech Ready-To-Use Temperature Indicators Major Product Offerings
7.3.4 Sensitech Ready-To-Use Temperature Indicators Sales and Revenue in Global (2020-2025)
7.3.5 Sensitech Key News & Latest Developments
7.4 MultiSystems
7.4.1 MultiSystems Company Summary
7.4.2 MultiSystems Business Overview
7.4.3 MultiSystems Ready-To-Use Temperature Indicators Major Product Offerings
7.4.4 MultiSystems Ready-To-Use Temperature Indicators Sales and Revenue in Global (2020-2025)
7.4.5 MultiSystems Key News & Latest Developments
7.5 Kelgray
7.5.1 Kelgray Company Summary
7.5.2 Kelgray Business Overview
7.5.3 Kelgray Ready-To-Use Temperature Indicators Major Product Offerings
7.5.4 Kelgray Ready-To-Use Temperature Indicators Sales and Revenue in Global (2020-2025)
7.5.5 Kelgray Key News & Latest Developments
7.6 Timestrip
7.6.1 Timestrip Company Summary
7.6.2 Timestrip Business Overview
7.6.3 Timestrip Ready-To-Use Temperature Indicators Major Product Offerings
7.6.4 Timestrip Ready-To-Use Temperature Indicators Sales and Revenue in Global (2020-2025)
7.6.5 Timestrip Key News & Latest Developments
7.7 Tempmate
7.7.1 Tempmate Company Summary
7.7.2 Tempmate Business Overview
7.7.3 Tempmate Ready-To-Use Temperature Indicators Major Product Offerings
7.7.4 Tempmate Ready-To-Use Temperature Indicators Sales and Revenue in Global (2020-2025)
7.7.5 Tempmate Key News & Latest Developments
7.8 SpotSee
7.8.1 SpotSee Company Summary
7.8.2 SpotSee Business Overview
7.8.3 SpotSee Ready-To-Use Temperature Indicators Major Product Offerings
7.8.4 SpotSee Ready-To-Use Temperature Indicators Sales and Revenue in Global (2020-2025)
7.8.5 SpotSee Key News & Latest Developments
7.9 Minco
7.9.1 Minco Company Summary
7.9.2 Minco Business Overview
7.9.3 Minco Ready-To-Use Temperature Indicators Major Product Offerings
7.9.4 Minco Ready-To-Use Temperature Indicators Sales and Revenue in Global (2020-2025)
7.9.5 Minco Key News & Latest Developments
7.10 JUMO
7.10.1 JUMO Company Summary
7.10.2 JUMO Business Overview
7.10.3 JUMO Ready-To-Use Temperature Indicators Major Product Offerings
7.10.4 JUMO Ready-To-Use Temperature Indicators Sales and Revenue in Global (2020-2025)
7.10.5 JUMO Key News & Latest Developments
8 Global Ready-To-Use Temperature Indicators Production Capacity, Analysis
8.1 Global Ready-To-Use Temperature Indicators Production Capacity, 2020-2032
8.2 Ready-To-Use Temperature Indicators Production Capacity of Key Manufacturers in Global Market
8.3 Global Ready-To-Use Temperature Indicators Production by Region
9 Key Market Trends, Opportunity, Drivers and Restraints
9.1 Market Opportunities & Trends
9.2 Market Drivers
9.3 Market Restraints
10 Ready-To-Use Temperature Indicators Supply Chain Analysis
10.1 Ready-To-Use Temperature Indicators Industry Value Chain
10.2 Ready-To-Use Temperature Indicators Upstream Market
10.3 Ready-To-Use Temperature Indicators Downstream and Clients
10.4 Marketing Channels Analysis
10.4.1 Marketing Channels
10.4.2 Ready-To-Use Temperature Indicators Distributors and Sales Agents in Global
11 Conclusion
12 Appendix
12.1 Note
12.2 Examples of Clients
12.3 DisclaimerList of Tables
Table 1. Key Players of Ready-To-Use Temperature Indicators in Global Market
Table 2. Top Ready-To-Use Temperature Indicators Players in Global Market, Ranking by Revenue (2024)
Table 3. Global Ready-To-Use Temperature Indicators Revenue by Companies, (US$, Mn), 2020-2025
Table 4. Global Ready-To-Use Temperature Indicators Revenue Share by Companies, 2020-2025
Table 5. Global Ready-To-Use Temperature Indicators Sales by Companies, (K Units), 2020-2025
Table 6. Global Ready-To-Use Temperature Indicators Sales Share by Companies, 2020-2025
Table 7. Key Manufacturers Ready-To-Use Temperature Indicators Price (2020-2025) & (US$/Unit)
Table 8. Global Manufacturers Ready-To-Use Temperature Indicators Product Type
Table 9. List of Global Tier 1 Ready-To-Use Temperature Indicators Companies, Revenue (US$, Mn) in 2024 and Market Share
Table 10. List of Global Tier 2 and Tier 3 Ready-To-Use Temperature Indicators Companies, Revenue (US$, Mn) in 2024 and Market Share
Table 11. Segment by Type – Global Ready-To-Use Temperature Indicators Revenue, (US$, Mn), 2024 & 2032
Table 12. Segment by Type – Global Ready-To-Use Temperature Indicators Revenue (US$, Mn), 2020-2025
Table 13. Segment by Type – Global Ready-To-Use Temperature Indicators Revenue (US$, Mn), 2026-2032
Table 14. Segment by Type – Global Ready-To-Use Temperature Indicators Sales (K Units), 2020-2025
Table 15. Segment by Type – Global Ready-To-Use Temperature Indicators Sales (K Units), 2026-2032
Table 16. Segment by Application – Global Ready-To-Use Temperature Indicators Revenue, (US$, Mn), 2024 & 2032
Table 17. Segment by Application – Global Ready-To-Use Temperature Indicators Revenue, (US$, Mn), 2020-2025
Table 18. Segment by Application – Global Ready-To-Use Temperature Indicators Revenue, (US$, Mn), 2026-2032
Table 19. Segment by Application – Global Ready-To-Use Temperature Indicators Sales, (K Units), 2020-2025
Table 20. Segment by Application – Global Ready-To-Use Temperature Indicators Sales, (K Units), 2026-2032
Table 21. By Region – Global Ready-To-Use Temperature Indicators Revenue, (US$, Mn), 2025-2032
Table 22. By Region – Global Ready-To-Use Temperature Indicators Revenue, (US$, Mn), 2020-2025
Table 23. By Region – Global Ready-To-Use Temperature Indicators Revenue, (US$, Mn), 2026-2032
Table 24. By Region – Global Ready-To-Use Temperature Indicators Sales, (K Units), 2020-2025
Table 25. By Region – Global Ready-To-Use Temperature Indicators Sales, (K Units), 2026-2032
Table 26. By Country – North America Ready-To-Use Temperature Indicators Revenue, (US$, Mn), 2020-2025
Table 27. By Country – North America Ready-To-Use Temperature Indicators Revenue, (US$, Mn), 2026-2032
Table 28. By Country – North America Ready-To-Use Temperature Indicators Sales, (K Units), 2020-2025
Table 29. By Country – North America Ready-To-Use Temperature Indicators Sales, (K Units), 2026-2032
Table 30. By Country – Europe Ready-To-Use Temperature Indicators Revenue, (US$, Mn), 2020-2025
Table 31. By Country – Europe Ready-To-Use Temperature Indicators Revenue, (US$, Mn), 2026-2032
Table 32. By Country – Europe Ready-To-Use Temperature Indicators Sales, (K Units), 2020-2025
Table 33. By Country – Europe Ready-To-Use Temperature Indicators Sales, (K Units), 2026-2032
Table 34. By Region – Asia Ready-To-Use Temperature Indicators Revenue, (US$, Mn), 2020-2025
Table 35. By Region – Asia Ready-To-Use Temperature Indicators Revenue, (US$, Mn), 2026-2032
Table 36. By Region – Asia Ready-To-Use Temperature Indicators Sales, (K Units), 2020-2025
Table 37. By Region – Asia Ready-To-Use Temperature Indicators Sales, (K Units), 2026-2032
Table 38. By Country – South America Ready-To-Use Temperature Indicators Revenue, (US$, Mn), 2020-2025
Table 39. By Country – South America Ready-To-Use Temperature Indicators Revenue, (US$, Mn), 2026-2032
Table 40. By Country – South America Ready-To-Use Temperature Indicators Sales, (K Units), 2020-2025
Table 41. By Country – South America Ready-To-Use Temperature Indicators Sales, (K Units), 2026-2032
Table 42. By Country – Middle East & Africa Ready-To-Use Temperature Indicators Revenue, (US$, Mn), 2020-2025
Table 43. By Country – Middle East & Africa Ready-To-Use Temperature Indicators Revenue, (US$, Mn), 2026-2032
Table 44. By Country – Middle East & Africa Ready-To-Use Temperature Indicators Sales, (K Units), 2020-2025
Table 45. By Country – Middle East & Africa Ready-To-Use Temperature Indicators Sales, (K Units), 2026-2032
Table 46. Zebra Technologies Company Summary
Table 47. Zebra Technologies Ready-To-Use Temperature Indicators Product Offerings
Table 48. Zebra Technologies Ready-To-Use Temperature Indicators Sales (K Units), Revenue (US$, Mn) and Average Price (US$/Unit) & (2020-2025)
Table 49. Zebra Technologies Key News & Latest Developments
Table 50. CSSI Technologies Company Summary
Table 51. CSSI Technologies Ready-To-Use Temperature Indicators Product Offerings
Table 52. CSSI Technologies Ready-To-Use Temperature Indicators Sales (K Units), Revenue (US$, Mn) and Average Price (US$/Unit) & (2020-2025)
Table 53. CSSI Technologies Key News & Latest Developments
Table 54. Sensitech Company Summary
Table 55. Sensitech Ready-To-Use Temperature Indicators Product Offerings
Table 56. Sensitech Ready-To-Use Temperature Indicators Sales (K Units), Revenue (US$, Mn) and Average Price (US$/Unit) & (2020-2025)
Table 57. Sensitech Key News & Latest Developments
Table 58. MultiSystems Company Summary
Table 59. MultiSystems Ready-To-Use Temperature Indicators Product Offerings
Table 60. MultiSystems Ready-To-Use Temperature Indicators Sales (K Units), Revenue (US$, Mn) and Average Price (US$/Unit) & (2020-2025)
Table 61. MultiSystems Key News & Latest Developments
Table 62. Kelgray Company Summary
Table 63. Kelgray Ready-To-Use Temperature Indicators Product Offerings
Table 64. Kelgray Ready-To-Use Temperature Indicators Sales (K Units), Revenue (US$, Mn) and Average Price (US$/Unit) & (2020-2025)
Table 65. Kelgray Key News & Latest Developments
Table 66. Timestrip Company Summary
Table 67. Timestrip Ready-To-Use Temperature Indicators Product Offerings
Table 68. Timestrip Ready-To-Use Temperature Indicators Sales (K Units), Revenue (US$, Mn) and Average Price (US$/Unit) & (2020-2025)
Table 69. Timestrip Key News & Latest Developments
Table 70. Tempmate Company Summary
Table 71. Tempmate Ready-To-Use Temperature Indicators Product Offerings
Table 72. Tempmate Ready-To-Use Temperature Indicators Sales (K Units), Revenue (US$, Mn) and Average Price (US$/Unit) & (2020-2025)
Table 73. Tempmate Key News & Latest Developments
Table 74. SpotSee Company Summary
Table 75. SpotSee Ready-To-Use Temperature Indicators Product Offerings
Table 76. SpotSee Ready-To-Use Temperature Indicators Sales (K Units), Revenue (US$, Mn) and Average Price (US$/Unit) & (2020-2025)
Table 77. SpotSee Key News & Latest Developments
Table 78. Minco Company Summary
Table 79. Minco Ready-To-Use Temperature Indicators Product Offerings
Table 80. Minco Ready-To-Use Temperature Indicators Sales (K Units), Revenue (US$, Mn) and Average Price (US$/Unit) & (2020-2025)
Table 81. Minco Key News & Latest Developments
Table 82. JUMO Company Summary
Table 83. JUMO Ready-To-Use Temperature Indicators Product Offerings
Table 84. JUMO Ready-To-Use Temperature Indicators Sales (K Units), Revenue (US$, Mn) and Average Price (US$/Unit) & (2020-2025)
Table 85. JUMO Key News & Latest Developments
Table 86. Ready-To-Use Temperature Indicators Capacity of Key Manufacturers in Global Market, 2023-2025 (K Units)
Table 87. Global Ready-To-Use Temperature Indicators Capacity Market Share of Key Manufacturers, 2023-2025
Table 88. Global Ready-To-Use Temperature Indicators Production by Region, 2020-2025 (K Units)
Table 89. Global Ready-To-Use Temperature Indicators Production by Region, 2026-2032 (K Units)
Table 90. Ready-To-Use Temperature Indicators Market Opportunities & Trends in Global Market
Table 91. Ready-To-Use Temperature Indicators Market Drivers in Global Market
Table 92. Ready-To-Use Temperature Indicators Market Restraints in Global Market
Table 93. Ready-To-Use Temperature Indicators Raw Materials
Table 94. Ready-To-Use Temperature Indicators Raw Materials Suppliers in Global Market
Table 95. Typical Ready-To-Use Temperature Indicators Downstream
Table 96. Ready-To-Use Temperature Indicators Downstream Clients in Global Market
Table 97. Ready-To-Use Temperature Indicators Distributors and Sales Agents in Global Market

List of Figures
Figure 1. Ready-To-Use Temperature Indicators Product Picture
Figure 2. Ready-To-Use Temperature Indicators Segment by Type in 2024
Figure 3. Ready-To-Use Temperature Indicators Segment by Application in 2024
Figure 4. Global Ready-To-Use Temperature Indicators Market Overview: 2024
Figure 5. Key Caveats
Figure 6. Global Ready-To-Use Temperature Indicators Market Size: 2024 VS 2032 (US$, Mn)
Figure 7. Global Ready-To-Use Temperature Indicators Revenue: 2020-2032 (US$, Mn)
Figure 8. Ready-To-Use Temperature Indicators Sales in Global Market: 2020-2032 (K Units)
Figure 9. The Top 3 and 5 Players Market Share by Ready-To-Use Temperature Indicators Revenue in 2024
Figure 10. Segment by Type – Global Ready-To-Use Temperature Indicators Revenue, (US$, Mn), 2024 & 2032
Figure 11. Segment by Type – Global Ready-To-Use Temperature Indicators Revenue Market Share, 2020-2032
Figure 12. Segment by Type – Global Ready-To-Use Temperature Indicators Sales Market Share, 2020-2032
Figure 13. Segment by Type – Global Ready-To-Use Temperature Indicators Price (US$/Unit), 2020-2032
Figure 14. Segment by Application – Global Ready-To-Use Temperature Indicators Revenue, (US$, Mn), 2024 & 2032
Figure 15. Segment by Application – Global Ready-To-Use Temperature Indicators Revenue Market Share, 2020-2032
Figure 16. Segment by Application – Global Ready-To-Use Temperature Indicators Sales Market Share, 2020-2032
Figure 17. Segment by Application -Global Ready-To-Use Temperature Indicators Price (US$/Unit), 2020-2032
Figure 18. By Region – Global Ready-To-Use Temperature Indicators Revenue, (US$, Mn), 2025 & 2032
Figure 19. By Region – Global Ready-To-Use Temperature Indicators Revenue Market Share, 2020 VS 2024 VS 2032
Figure 20. By Region – Global Ready-To-Use Temperature Indicators Revenue Market Share, 2020-2032
Figure 21. By Region – Global Ready-To-Use Temperature Indicators Sales Market Share, 2020-2032
Figure 22. By Country – North America Ready-To-Use Temperature Indicators Revenue Market Share, 2020-2032
Figure 23. By Country – North America Ready-To-Use Temperature Indicators Sales Market Share, 2020-2032
Figure 24. United States Ready-To-Use Temperature Indicators Revenue, (US$, Mn), 2020-2032
Figure 25. Canada Ready-To-Use Temperature Indicators Revenue, (US$, Mn), 2020-2032
Figure 26. Mexico Ready-To-Use Temperature Indicators Revenue, (US$, Mn), 2020-2032
Figure 27. By Country – Europe Ready-To-Use Temperature Indicators Revenue Market Share, 2020-2032
Figure 28. By Country – Europe Ready-To-Use Temperature Indicators Sales Market Share, 2020-2032
Figure 29. Germany Ready-To-Use Temperature Indicators Revenue, (US$, Mn), 2020-2032
Figure 30. France Ready-To-Use Temperature Indicators Revenue, (US$, Mn), 2020-2032
Figure 31. U.K. Ready-To-Use Temperature Indicators Revenue, (US$, Mn), 2020-2032
Figure 32. Italy Ready-To-Use Temperature Indicators Revenue, (US$, Mn), 2020-2032
Figure 33. Russia Ready-To-Use Temperature Indicators Revenue, (US$, Mn), 2020-2032
Figure 34. Nordic Countries Ready-To-Use Temperature Indicators Revenue, (US$, Mn), 2020-2032
Figure 35. Benelux Ready-To-Use Temperature Indicators Revenue, (US$, Mn), 2020-2032
Figure 36. By Region – Asia Ready-To-Use Temperature Indicators Revenue Market Share, 2020-2032
Figure 37. By Region – Asia Ready-To-Use Temperature Indicators Sales Market Share, 2020-2032
Figure 38. China Ready-To-Use Temperature Indicators Revenue, (US$, Mn), 2020-2032
Figure 39. Japan Ready-To-Use Temperature Indicators Revenue, (US$, Mn), 2020-2032
Figure 40. South Korea Ready-To-Use Temperature Indicators Revenue, (US$, Mn), 2020-2032
Figure 41. Southeast Asia Ready-To-Use Temperature Indicators Revenue, (US$, Mn), 2020-2032
Figure 42. India Ready-To-Use Temperature Indicators Revenue, (US$, Mn), 2020-2032
Figure 43. By Country – South America Ready-To-Use Temperature Indicators Revenue Market Share, 2020-2032
Figure 44. By Country – South America Ready-To-Use Temperature Indicators Sales, Market Share, 2020-2032
Figure 45. Brazil Ready-To-Use Temperature Indicators Revenue, (US$, Mn), 2020-2032
Figure 46. Argentina Ready-To-Use Temperature Indicators Revenue, (US$, Mn), 2020-2032
Figure 47. By Country – Middle East & Africa Ready-To-Use Temperature Indicators Revenue, Market Share, 2020-2032
Figure 48. By Country – Middle East & Africa Ready-To-Use Temperature Indicators Sales, Market Share, 2020-2032
Figure 49. Turkey Ready-To-Use Temperature Indicators Revenue, (US$, Mn), 2020-2032
Figure 50. Israel Ready-To-Use Temperature Indicators Revenue, (US$, Mn), 2020-2032
Figure 51. Saudi Arabia Ready-To-Use Temperature Indicators Revenue, (US$, Mn), 2020-2032
Figure 52. UAE Ready-To-Use Temperature Indicators Revenue, (US$, Mn), 2020-2032
Figure 53. Global Ready-To-Use Temperature Indicators Production Capacity (K Units), 2020-2032
Figure 54. The Percentage of Production Ready-To-Use Temperature Indicators by Region, 2024 VS 2032
Figure 55. Ready-To-Use Temperature Indicators Industry Value Chain
Figure 56. Marketing Channels

