SEMICONDUCTOR INSIGHT
MARKET RESEARCH REPORT

PVA Film for Polarizer Market

2026 to 2034
MARKET INTELLIGENCE
ACROSS KEY REGIONS
2026 EDITION
DISPLAY AND VISUALIZATION Semiconductor Market Research

PVA Film for Polarizer Market

Size, Share & Industry Analysis, By Type (Anti-glare Treatment (AG), Anti-glare + Low-reflective Treatment (AG + LR), CHC + LR Treatment, CHC Treatment, Other), By Application (Display Panel, Sunglasses, Photography Equipment, Watch, Other), By End User (Polarizer Manufacturers, Display Panel Manufacturers, Optical Goods Manufacturers), By Film Width (Standard Width, Wide-format, Ultra-wide 3 m-class), and Regional Forecast, 2026-2034

◷
UPDATED 12 October 2026
▤
REPORT LENGTH Detailed Report
▣
REPORT CODE 223506513a55
▯
FORMATS PDF

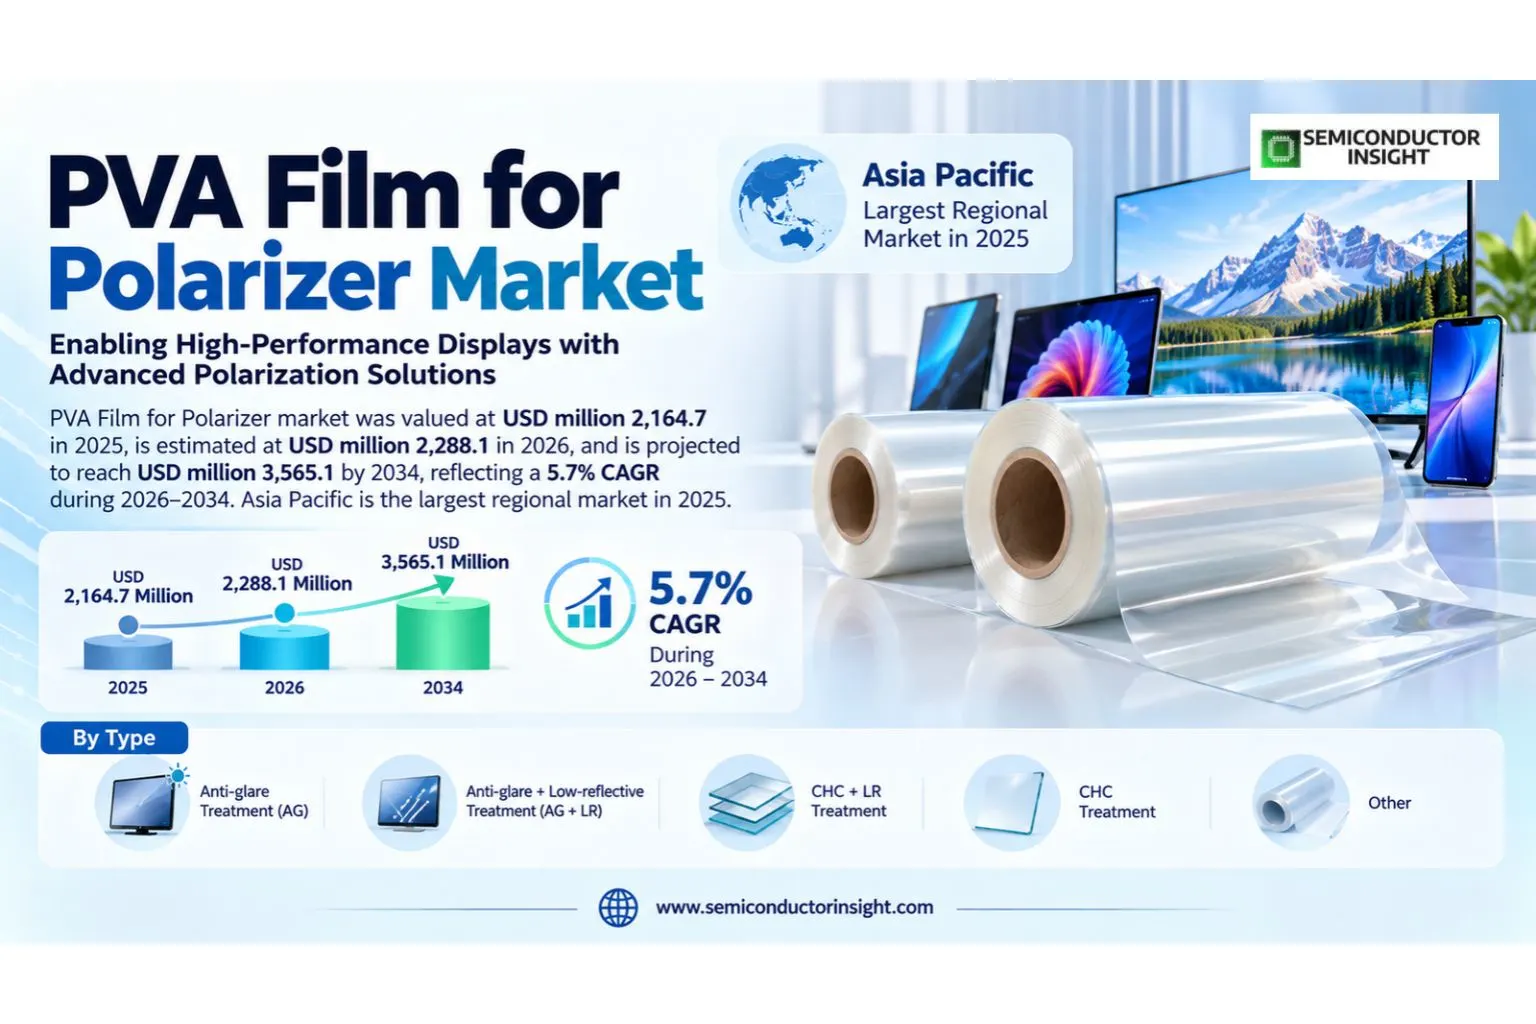
PVA Film for Polarizer market was valued at USD million 2,164.7 in 2025, is estimated at USD million 2,288.1 in 2026, and is projected to reach USD million 3,565.1 by 2034, reflecting a 5.7% CAGR during 2026–2034. Asia Pacific is the largest regional market in 2025.

Get the sample PDF with study scope, segmentation and methodology details.

Key Statistics

2025 Market Size
USD million 2,164.7
2034 Projected Market Size
USD million 3,565.1
CAGR (2026–2034)
5.7%
Largest Market in 2025
Asia Pacific

Key Takeaways

  • The global PVA Film for Polarizer market was valued at USD million 2,164.7 in 2025 and is projected to reach USD million 3,565.1 by 2034, representing a 5.7% CAGR over 2026–2034.
  • Wide-format and high-uniformity grades are positioned for above-average growth because customer designs increasingly reward integration, performance consistency and lower system-level complexity.
  • Large-area display panels provides one of the clearest demand pathways as purchasing decisions move toward higher performance, tighter qualification and longer lifecycle support.
  • Asia Pacific held the largest market position in 2025, supported by the concentration of relevant manufacturing, infrastructure, customers or technology investment.
  • The central market constraint is not simply price; qualification, process control and switching risk can slow adoption even when a competing product offers an attractive specification.
  • Competitive advantage is shifting toward suppliers that combine product performance with application engineering, dependable capacity and regional technical support.

PVA Film for Polarizer Market Overview

PVA Film for Polarizer market was valued at USD million 2,164.7 in 2025, is estimated at USD million 2,288.1 in 2026, and is projected to reach USD million 3,565.1 by 2034, reflecting a 5.7% CAGR during 2026–2034. Asia Pacific is the largest regional market in 2025.

Base year: 2025 · Estimated year: 2026 · Forecast period: 2026–2034 · Values in USD million unless otherwise stated

PVA Film for Polarizer refers to optical-grade polyvinyl alcohol film that is stretched, dyed and stabilized to create the light-selective layer used in polarizing plates for displays and optical products. The commercial boundary includes products and enabling solutions sold specifically for the defined application, while excluding adjacent technologies that do not perform the same core function. This scope discipline is important because neighboring components can share end customers without being economically interchangeable.

Demand is tied to polarizer output, panel-area growth and the migration toward larger television, monitor and automotive displays. Buyers prioritize thickness uniformity, optical consistency, stretch behavior and defect control because small film variations can translate into visible non-uniformity after lamination.

Segment Analysis: By Type

By type, the market is segmented into Anti-glare Treatment (AG), Anti-glare + Low-reflective Treatment (AG + LR), CHC + LR Treatment, CHC Treatment, Other. The segment mix reflects differences in architecture, cost, integration and end-use qualification. Wide-format and high-uniformity grades are positioned for stronger growth where customers value higher performance or reduced system complexity.

Type Market role Commercial characteristics
Anti-glare Treatment (AG) Core segment Anti-glare Treatment (AG) represents a distinct purchasing and performance profile within the PVA Film for Polarizer market. Supplier differentiation depends on technical fit, qualification requirements, operating environment and the economics of the customer workflow rather than on a single headline specification.
Anti-glare + Low-reflective Treatment (AG + LR) Strategic segment Anti-glare + Low-reflective Treatment (AG + LR) represents a distinct purchasing and performance profile within the PVA Film for Polarizer market. Supplier differentiation depends on technical fit, qualification requirements, operating environment and the economics of the customer workflow rather than on a single headline specification.
CHC + LR Treatment Strategic segment CHC + LR Treatment represents a distinct purchasing and performance profile within the PVA Film for Polarizer market. Supplier differentiation depends on technical fit, qualification requirements, operating environment and the economics of the customer workflow rather than on a single headline specification.
CHC Treatment Strategic segment CHC Treatment represents a distinct purchasing and performance profile within the PVA Film for Polarizer market. Supplier differentiation depends on technical fit, qualification requirements, operating environment and the economics of the customer workflow rather than on a single headline specification.
Other Strategic segment Other represents a distinct purchasing and performance profile within the PVA Film for Polarizer market. Supplier differentiation depends on technical fit, qualification requirements, operating environment and the economics of the customer workflow rather than on a single headline specification.

Segment Analysis: By End User

End User Market role Commercial characteristics
Polarizer Manufacturers Core segment Polarizer Manufacturers represents a distinct purchasing and performance profile within the PVA Film for Polarizer market. Supplier differentiation depends on technical fit, qualification requirements, operating environment and the economics of the customer workflow rather than on a single headline specification.
Display Panel Manufacturers Strategic segment Display Panel Manufacturers represents a distinct purchasing and performance profile within the PVA Film for Polarizer market. Supplier differentiation depends on technical fit, qualification requirements, operating environment and the economics of the customer workflow rather than on a single headline specification.
Optical Goods Manufacturers Strategic segment Optical Goods Manufacturers represents a distinct purchasing and performance profile within the PVA Film for Polarizer market. Supplier differentiation depends on technical fit, qualification requirements, operating environment and the economics of the customer workflow rather than on a single headline specification.

Segment Analysis: By Film Width

Film Width Market role Commercial characteristics
Standard Width Core segment Standard Width represents a distinct purchasing and performance profile within the PVA Film for Polarizer market. Supplier differentiation depends on technical fit, qualification requirements, operating environment and the economics of the customer workflow rather than on a single headline specification.
Wide-format Strategic segment Wide-format represents a distinct purchasing and performance profile within the PVA Film for Polarizer market. Supplier differentiation depends on technical fit, qualification requirements, operating environment and the economics of the customer workflow rather than on a single headline specification.
Ultra-wide 3 m-class Strategic segment Ultra-wide 3 m-class represents a distinct purchasing and performance profile within the PVA Film for Polarizer market. Supplier differentiation depends on technical fit, qualification requirements, operating environment and the economics of the customer workflow rather than on a single headline specification.

Segment Analysis: By Application

By application, demand spans Display Panel, Sunglasses, Photography Equipment, Watch, Other. Large-area display panels has one of the strongest growth profiles because performance requirements and deployment intensity are increasing faster than in mature replacement-led uses.

Application Demand characteristics
Display Panel Purchasing in Display Panel is driven by application performance, qualification, lifecycle cost and supplier support. The segment rewards vendors that can translate technical specifications into measurable system-level reliability, throughput or user value rather than competing only on component price.
Sunglasses Purchasing in Sunglasses is driven by application performance, qualification, lifecycle cost and supplier support. The segment rewards vendors that can translate technical specifications into measurable system-level reliability, throughput or user value rather than competing only on component price.
Photography Equipment Purchasing in Photography Equipment is driven by application performance, qualification, lifecycle cost and supplier support. The segment rewards vendors that can translate technical specifications into measurable system-level reliability, throughput or user value rather than competing only on component price.
Watch Purchasing in Watch is driven by application performance, qualification, lifecycle cost and supplier support. The segment rewards vendors that can translate technical specifications into measurable system-level reliability, throughput or user value rather than competing only on component price.
Other Purchasing in Other is driven by application performance, qualification, lifecycle cost and supplier support. The segment rewards vendors that can translate technical specifications into measurable system-level reliability, throughput or user value rather than competing only on component price.

Regional Analysis

Asia Pacific leads the market in 2025. Regional demand differs by manufacturing concentration, deployment economics, regulation, infrastructure maturity and customer qualification practices, so supplier strategies must be adapted rather than copied from one geography to another.

How does regional demand differ in the PVA Film for Polarizer market?

Regional performance depends on where the underlying systems are manufactured, deployed and qualified. Asia Pacific benefits from the strongest concentration of the relevant demand engine, while North America and Europe typically offer deeper premium niches and structured qualification. South America and Middle East & Africa remain smaller but can provide project-driven or import-led opportunities.

Region Position Growth outlook Demand profile Supplier selection
Asia Pacific Largest Positive Distinct application mix Qualification, availability and lifecycle support
North America Position 2 Positive Distinct application mix Qualification, availability and lifecycle support
Europe Position 3 Positive Distinct application mix Qualification, availability and lifecycle support
South America Position 4 Positive Distinct application mix Qualification, availability and lifecycle support
Middle East & Africa Position 5 Positive Distinct application mix Qualification, availability and lifecycle support
Asia Pacific

What shapes Asia Pacific demand for PVA Film for Polarizer?

The region combines the largest LCD and polarizer manufacturing base with upstream specialty-film know-how in Japan, South Korea and China. Capacity decisions are therefore closely linked to panel dimensions, polarizer conversion yields and local qualification cycles.

Market positionLargest region
Growth outlookPositive, application-led
Demand profileTechnology and qualification driven
Access gateLocal qualification and channel support
Country Role Demand logic
China Relevant demand center China contributes through a market-specific combination of manufacturing, infrastructure, regulated procurement, downstream system integration or import demand. Commercial success depends on matching product qualification and service capability to the local customer base rather than assuming a uniform regional purchasing model.
Japan Relevant demand center Japan contributes through a market-specific combination of manufacturing, infrastructure, regulated procurement, downstream system integration or import demand. Commercial success depends on matching product qualification and service capability to the local customer base rather than assuming a uniform regional purchasing model.
South Korea Relevant demand center South Korea contributes through a market-specific combination of manufacturing, infrastructure, regulated procurement, downstream system integration or import demand. Commercial success depends on matching product qualification and service capability to the local customer base rather than assuming a uniform regional purchasing model.
Market instance 1 — demand base. In Asia Pacific, the addressable opportunity is anchored in the local mix of manufacturing, infrastructure deployment and system integration. The commercial signal is strongest where investment creates new qualification programs rather than simply replacing existing units, because greenfield designs give suppliers a clearer opening to win positions.
Market instance 2 — qualification and channels.Buyers in Asia Pacific typically combine technical validation with local availability, documentation and service expectations. This matters because a globally competitive product can still lose a program when the supplier lacks regional engineering support, approved distribution or the ability to resolve qualification issues on the customer’s timetable.
Market instance 3 — lifecycle economics. Replacement cycles in Asia Pacific favor incumbents where redesign costs are high, while new platforms create openings for suppliers offering better integration or lower operating risk. The resulting market effect is a two-speed structure: installed-base demand is relationship-heavy, whereas new projects are more contestable and specification-driven.

The full regional assessment for PVA Film for Polarizer should be read through customer concentration, technical qualification and supply-chain geography. These factors explain why nominal demand growth does not translate uniformly into supplier opportunity across countries or end markets.

North America

What shapes North America demand for PVA Film for Polarizer?

Demand is primarily downstream and specification-driven, with optical film consumed through display, instrumentation and specialty optics value chains rather than a large indigenous panel-manufacturing base.

Market positionPosition 2
Growth outlookPositive, application-led
Demand profileTechnology and qualification driven
Access gateLocal qualification and channel support
Country Role Demand logic
United States Relevant demand center United States contributes through a market-specific combination of manufacturing, infrastructure, regulated procurement, downstream system integration or import demand. Commercial success depends on matching product qualification and service capability to the local customer base rather than assuming a uniform regional purchasing model.
Canada Relevant demand center Canada contributes through a market-specific combination of manufacturing, infrastructure, regulated procurement, downstream system integration or import demand. Commercial success depends on matching product qualification and service capability to the local customer base rather than assuming a uniform regional purchasing model.
Mexico Relevant demand center Mexico contributes through a market-specific combination of manufacturing, infrastructure, regulated procurement, downstream system integration or import demand. Commercial success depends on matching product qualification and service capability to the local customer base rather than assuming a uniform regional purchasing model.
Market instance 1 — demand base. In North America, the addressable opportunity is anchored in the local mix of manufacturing, infrastructure deployment and system integration. The commercial signal is strongest where investment creates new qualification programs rather than simply replacing existing units, because greenfield designs give suppliers a clearer opening to win positions.
Market instance 2 — qualification and channels. Buyers in North America typically combine technical validation with local availability, documentation and service expectations. This matters because a globally competitive product can still lose a program when the supplier lacks regional engineering support, approved distribution or the ability to resolve qualification issues on the customer’s timetable.
Market instance 3 — lifecycle economics. Replacement cycles in North America favor incumbents where redesign costs are high, while new platforms create openings for suppliers offering better integration or lower operating risk. The resulting market effect is a two-speed structure: installed-base demand is relationship-heavy, whereas new projects are more contestable and specification-driven.

The full regional assessment for PVA Film for Polarizer should be read through customer concentration, technical qualification and supply-chain geography. These factors explain why nominal demand growth does not translate uniformly into supplier opportunity across countries or end markets.

Europe

What shapes Europe demand for PVA Film for Polarizer?

European demand is concentrated in automotive displays, industrial visualization and premium optical applications, where reliability, traceability and long qualification cycles often matter more than commodity volume.

Market positionPosition 3
Growth outlookPositive, application-led
Demand profileTechnology and qualification driven
Access gateLocal qualification and channel support
Country Role Demand logic
Germany Relevant demand center Germany contributes through a market-specific combination of manufacturing, infrastructure, regulated procurement, downstream system integration or import demand. Commercial success depends on matching product qualification and service capability to the local customer base rather than assuming a uniform regional purchasing model.
United Kingdom Relevant demand center United Kingdom contributes through a market-specific combination of manufacturing, infrastructure, regulated procurement, downstream system integration or import demand. Commercial success depends on matching product qualification and service capability to the local customer base rather than assuming a uniform regional purchasing model.
France Relevant demand center France contributes through a market-specific combination of manufacturing, infrastructure, regulated procurement, downstream system integration or import demand. Commercial success depends on matching product qualification and service capability to the local customer base rather than assuming a uniform regional purchasing model.
Market instance 1 — demand base. In Europe, the addressable opportunity is anchored in the local mix of manufacturing, infrastructure deployment and system integration. The commercial signal is strongest where investment creates new qualification programs rather than simply replacing existing units, because greenfield designs give suppliers a clearer opening to win positions.
Market instance 2 — qualification and channels. Buyers in Europe typically combine technical validation with local availability, documentation and service expectations. This matters because a globally competitive product can still lose a program when the supplier lacks regional engineering support, approved distribution or the ability to resolve qualification issues on the customer’s timetable.
Market instance 3 — lifecycle economics. Replacement cycles in Europe favor incumbents where redesign costs are high, while new platforms create openings for suppliers offering better integration or lower operating risk. The resulting market effect is a two-speed structure: installed-base demand is relationship-heavy, whereas new projects are more contestable and specification-driven.

The full regional assessment for PVA Film for Polarizer should be read through customer concentration, technical qualification and supply-chain geography. These factors explain why nominal demand growth does not translate uniformly into supplier opportunity across countries or end markets.

South America

What shapes South America demand for PVA Film for Polarizer?

The market is import-led and centered on replacement electronics, consumer displays and optical goods, making distributor inventory and landed cost important determinants of availability.

Market positionPosition 4
Growth outlookPositive, application-led
Demand profileTechnology and qualification driven
Access gateLocal qualification and channel support
Country Role Demand logic
Brazil Relevant demand center Brazil contributes through a market-specific combination of manufacturing, infrastructure, regulated procurement, downstream system integration or import demand. Commercial success depends on matching product qualification and service capability to the local customer base rather than assuming a uniform regional purchasing model.
Argentina Relevant demand center Argentina contributes through a market-specific combination of manufacturing, infrastructure, regulated procurement, downstream system integration or import demand. Commercial success depends on matching product qualification and service capability to the local customer base rather than assuming a uniform regional purchasing model.
Chile Relevant demand center Chile contributes through a market-specific combination of manufacturing, infrastructure, regulated procurement, downstream system integration or import demand. Commercial success depends on matching product qualification and service capability to the local customer base rather than assuming a uniform regional purchasing model.
Market instance 1 — demand base. In South America, the addressable opportunity is anchored in the local mix of manufacturing, infrastructure deployment and system integration. The commercial signal is strongest where investment creates new qualification programs rather than simply replacing existing units, because greenfield designs give suppliers a clearer opening to win positions.
Market instance 2 — qualification and channels. Buyers in South America typically combine technical validation with local availability, documentation and service expectations. This matters because a globally competitive product can still lose a program when the supplier lacks regional engineering support, approved distribution or the ability to resolve qualification issues on the customer’s timetable.
Market instance 3 — lifecycle economics. Replacement cycles in South America favor incumbents where redesign costs are high, while new platforms create openings for suppliers offering better integration or lower operating risk. The resulting market effect is a two-speed structure: installed-base demand is relationship-heavy, whereas new projects are more contestable and specification-driven.

The full regional assessment for PVA Film for Polarizer should be read through customer concentration, technical qualification and supply-chain geography. These factors explain why nominal demand growth does not translate uniformly into supplier opportunity across countries or end markets.

Middle East & Africa

What shapes Middle East & Africa demand for PVA Film for Polarizer?

Demand remains project- and import-driven, with opportunities in commercial displays, digital signage and optical products but limited local polarizer conversion capacity.

Market positionPosition 5
Growth outlookPositive, application-led
Demand profileTechnology and qualification driven
Access gateLocal qualification and channel support
Country Role Demand logic
Saudi Arabia Relevant demand center Saudi Arabia contributes through a market-specific combination of manufacturing, infrastructure, regulated procurement, downstream system integration or import demand. Commercial success depends on matching product qualification and service capability to the local customer base rather than assuming a uniform regional purchasing model.
UAE Relevant demand center UAE contributes through a market-specific combination of manufacturing, infrastructure, regulated procurement, downstream system integration or import demand. Commercial success depends on matching product qualification and service capability to the local customer base rather than assuming a uniform regional purchasing model.
South Africa Relevant demand center South Africa contributes through a market-specific combination of manufacturing, infrastructure, regulated procurement, downstream system integration or import demand. Commercial success depends on matching product qualification and service capability to the local customer base rather than assuming a uniform regional purchasing model.
Market instance 1 — demand base. In Middle East & Africa, the addressable opportunity is anchored in the local mix of manufacturing, infrastructure deployment and system integration. The commercial signal is strongest where investment creates new qualification programs rather than simply replacing existing units, because greenfield designs give suppliers a clearer opening to win positions.
Market instance 2 — qualification and channels. Buyers in Middle East & Africa typically combine technical validation with local availability, documentation and service expectations. This matters because a globally competitive product can still lose a program when the supplier lacks regional engineering support, approved distribution or the ability to resolve qualification issues on the customer’s timetable.
Market instance 3 — lifecycle economics. Replacement cycles in Middle East & Africa favor incumbents where redesign costs are high, while new platforms create openings for suppliers offering better integration or lower operating risk. The resulting market effect is a two-speed structure: installed-base demand is relationship-heavy, whereas new projects are more contestable and specification-driven.

The full regional assessment for PVA Film for Polarizer should be read through customer concentration, technical qualification and supply-chain geography. These factors explain why nominal demand growth does not translate uniformly into supplier opportunity across countries or end markets.

Competitive Landscape

Competition in the PVA Film for Polarizer market is shaped by technical differentiation, qualification history, application engineering and the ability to support customers through design-in and production. Price remains important, but switching risk gives incumbents an advantage once a product is qualified.

The competitive set includes Kuraray, Samsung SDI, Mitsubishi Chemical, YS America, Nitto, Anhui Wanwei Group alongside specialist and regional suppliers. Large diversified vendors benefit from broader customer access and manufacturing scale, while specialists compete through narrower technical depth, customization and responsiveness. The balance varies by application because qualification intensity and purchasing volumes differ materially.

Supplier share can change slowly in mature qualified applications because redesigning a component, material or software element creates engineering work beyond the purchase price. New platforms and greenfield capacity therefore create disproportionate opportunities for challengers, while aftermarket and replacement demand tends to reinforce incumbent relationships.

Competitive group Representative companies Primary advantage
Global diversified suppliers Kuraray, Samsung SDI, Mitsubishi Chemical, YS America Scale, broad account access, quality systems and lifecycle support
Specialists and focused vendors Nitto, Anhui Wanwei Group, Sinopec Chongqing SVW Chemical, Sichuan Longhua Film, Changchun Group Application expertise, customization and faster engineering response
Regional and emerging suppliers Additional regional suppliers Local availability, price competitiveness and proximity to customers

Key Participants

The profiled competitive landscape includes Kuraray, Samsung SDI, Mitsubishi Chemical, YS America, Nitto, Anhui Wanwei Group, Sinopec Chongqing SVW Chemical, Sichuan Longhua Film, Changchun Group. Competitive relevance should be read by product fit and end-market qualification, since not every supplier participates with the same breadth across all regions, specifications and customer tiers.

Production Capacity Analysis

Capacity in the PVA Film for Polarizer market is constrained by more than nominal factory output. The commercially useful measure is qualified capacity: production that can repeatedly meet customer specifications, quality controls and delivery requirements. Expansion therefore requires process capability, test infrastructure and trained engineering support as well as physical equipment.

Geographic concentration follows the upstream and downstream ecosystem supporting the market. Asia Pacific has a structural advantage where local suppliers can shorten qualification loops, support customer troubleshooting and synchronize capacity with nearby system manufacturers or deployment programs. North American and European suppliers often defend premium niches through IP, certification and application expertise.

The principal capacity risk is mismatch rather than absolute shortage. A supplier can have available floor space yet lack the process window, material grade, test capability or customer approval needed for a specific design. Buyers therefore increasingly examine business-continuity planning, second-source readiness and regional service capability when approving strategic suppliers.

Market Dynamics

The market is expanding because technology intensity is increasing in the systems that consume PVA Film for Polarizer solutions, but adoption remains gated by qualification, lifecycle economics and supply-chain execution. The strongest suppliers convert technical performance into lower integration risk and more predictable customer operations.

Market Drivers

Driver Impact Commercial mechanism
Larger display areas increase square-meter film consumption High Larger display areas increase square-meter film consumption expands addressable demand by increasing system performance requirements, installation intensity or replacement value. The impact is strongest where customers can quantify avoided downtime, improved throughput or reduced integration complexity.
Automotive cockpit displays add higher-specification optical demand High Automotive cockpit displays add higher-specification optical demand expands addressable demand by increasing system performance requirements, installation intensity or replacement value. The impact is strongest where customers can quantify avoided downtime, improved throughput or reduced integration complexity.
Chinese polarizer localization expands qualified local supply chains Medium Chinese polarizer localization expands qualified local supply chains expands addressable demand by increasing system performance requirements, installation intensity or replacement value. The impact is strongest where customers can quantify avoided downtime, improved throughput or reduced integration complexity.
Wearables and specialty optics diversify demand beyond televisions Medium Wearables and specialty optics diversify demand beyond televisions expands addressable demand by increasing system performance requirements, installation intensity or replacement value. The impact is strongest where customers can quantify avoided downtime, improved throughput or reduced integration complexity.

Larger display areas increase square-meter film consumption

Larger display areas increase square-meter film consumption is a meaningful driver because it changes the customer requirement rather than merely adding market awareness. Suppliers benefit when the trend creates a new technical threshold, additional unit content or a higher-value specification. Commercial conversion still depends on qualification timing and whether the customer can justify the system-level benefit against switching cost.

Automotive cockpit displays add higher-specification optical demand

Automotive cockpit displays add higher-specification optical demand is a meaningful driver because it changes the customer requirement rather than merely adding market awareness. Suppliers benefit when the trend creates a new technical threshold, additional unit content or a higher-value specification. Commercial conversion still depends on qualification timing and whether the customer can justify the system-level benefit against switching cost.

Chinese polarizer localization expands qualified local supply chains

Chinese polarizer localization expands qualified local supply chains is a meaningful driver because it changes the customer requirement rather than merely adding market awareness. Suppliers benefit when the trend creates a new technical threshold, additional unit content or a higher-value specification. Commercial conversion still depends on qualification timing and whether the customer can justify the system-level benefit against switching cost.

Wearables and specialty optics diversify demand beyond televisions

Wearables and specialty optics diversify demand beyond televisions is a meaningful driver because it changes the customer requirement rather than merely adding market awareness. Suppliers benefit when the trend creates a new technical threshold, additional unit content or a higher-value specification. Commercial conversion still depends on qualification timing and whether the customer can justify the system-level benefit against switching cost.

Market Restraints

Restraint Impact Market effect
Tight defect tolerances create qualification barriers and yield risk High Tight defect tolerances create qualification barriers and yield risk can delay adoption, narrow the qualified supplier pool or increase total ownership cost. The effect is strongest in applications where redesign or process change creates validation risk beyond the component purchase price.
LCD investment cycles expose suppliers to panel-industry volatility High LCD investment cycles expose suppliers to panel-industry volatility can delay adoption, narrow the qualified supplier pool or increase total ownership cost. The effect is strongest in applications where redesign or process change creates validation risk beyond the component purchase price.
Ultra-wide optical film lines require specialized capital and process control Medium Ultra-wide optical film lines require specialized capital and process control can delay adoption, narrow the qualified supplier pool or increase total ownership cost. The effect is strongest in applications where redesign or process change creates validation risk beyond the component purchase price.
Alternative display architectures can change polarizer intensity by device Medium Alternative display architectures can change polarizer intensity by device can delay adoption, narrow the qualified supplier pool or increase total ownership cost. The effect is strongest in applications where redesign or process change creates validation risk beyond the component purchase price.

Tight defect tolerances create qualification barriers and yield risk

Tight defect tolerances create qualification barriers and yield risk constrains market conversion because buyers must manage technical, operational and financial risk simultaneously. Even when the long-term technology direction is favorable, project delays, qualification burden or competing architectures can shift demand between suppliers and postpone revenue recognition. Successful vendors address the restraint through design support, reliability evidence and clearer lifecycle economics.

LCD investment cycles expose suppliers to panel-industry volatility

LCD investment cycles expose suppliers to panel-industry volatility constrains market conversion because buyers must manage technical, operational and financial risk simultaneously. Even when the long-term technology direction is favorable, project delays, qualification burden or competing architectures can shift demand between suppliers and postpone revenue recognition. Successful vendors address the restraint through design support, reliability evidence and clearer lifecycle economics.

Ultra-wide optical film lines require specialized capital and process control

Ultra-wide optical film lines require specialized capital and process control constrains market conversion because buyers must manage technical, operational and financial risk simultaneously. Even when the long-term technology direction is favorable, project delays, qualification burden or competing architectures can shift demand between suppliers and postpone revenue recognition. Successful vendors address the restraint through design support, reliability evidence and clearer lifecycle economics.

Alternative display architectures can change polarizer intensity by device

Alternative display architectures can change polarizer intensity by device constrains market conversion because buyers must manage technical, operational and financial risk simultaneously. Even when the long-term technology direction is favorable, project delays, qualification burden or competing architectures can shift demand between suppliers and postpone revenue recognition. Successful vendors address the restraint through design support, reliability evidence and clearer lifecycle economics.

Market Opportunities

Ultra-wide film for large television and monitor formats

Ultra-wide film for large television and monitor formats creates a focused opportunity where existing products or operating models no longer fully match customer requirements. The most attractive positioning combines a measurable technical advantage with easier qualification, reliable supply and application support. Suppliers that enter early in the design cycle can secure longer-lived revenue because redesign costs increase after customer validation.

Automotive-grade polarizers with stricter durability requirements

Automotive-grade polarizers with stricter durability requirements creates a focused opportunity where existing products or operating models no longer fully match customer requirements. The most attractive positioning combines a measurable technical advantage with easier qualification, reliable supply and application support. Suppliers that enter early in the design cycle can secure longer-lived revenue because redesign costs increase after customer validation.

Localized supply for Chinese polarizer converters

Localized supply for Chinese polarizer converters creates a focused opportunity where existing products or operating models no longer fully match customer requirements. The most attractive positioning combines a measurable technical advantage with easier qualification, reliable supply and application support. Suppliers that enter early in the design cycle can secure longer-lived revenue because redesign costs increase after customer validation.

Specialty polarizing optics for instruments and photography

Specialty polarizing optics for instruments and photography creates a focused opportunity where existing products or operating models no longer fully match customer requirements. The most attractive positioning combines a measurable technical advantage with easier qualification, reliable supply and application support. Suppliers that enter early in the design cycle can secure longer-lived revenue because redesign costs increase after customer validation.

Supply Chain Analysis

Stage 1
PVA resin and functional additives
Stage 2
Optical-grade film casting and stretching
Stage 3
Polarizer conversion, dyeing and lamination
Stage 4
Display and optical-device integration

PVA resin and functional additives

PVA resin and functional additives is a critical value-chain stage because quality, lead time and technical consistency at this point propagate into downstream performance. Value capture is highest when suppliers solve a difficult qualification or integration problem, while bottlenecks emerge when specialized materials, process know-how or test capacity cannot be substituted quickly.

Optical-grade film casting and stretching

Optical-grade film casting and stretching is a critical value-chain stage because quality, lead time and technical consistency at this point propagate into downstream performance. Value capture is highest when suppliers solve a difficult qualification or integration problem, while bottlenecks emerge when specialized materials, process know-how or test capacity cannot be substituted quickly.

Polarizer conversion, dyeing and lamination

Polarizer conversion, dyeing and lamination is a critical value-chain stage because quality, lead time and technical consistency at this point propagate into downstream performance. Value capture is highest when suppliers solve a difficult qualification or integration problem, while bottlenecks emerge when specialized materials, process know-how or test capacity cannot be substituted quickly.

Display and optical-device integration

Display and optical-device integration is a critical value-chain stage because quality, lead time and technical consistency at this point propagate into downstream performance. Value capture is highest when suppliers solve a difficult qualification or integration problem, while bottlenecks emerge when specialized materials, process know-how or test capacity cannot be substituted quickly.

Recent Developments

June 2025

Kuraray announced a new optical-use Poval film line at its Saijo Plant designed to support wider products, including compatibility with 3-meter-class polarizing film. The investment matters because larger display formats raise both film-width requirements and the economic penalty from defects across a wider web. Source

2025

Display supply chains continued to emphasize larger screen sizes and higher-value automotive visualization, strengthening the commercial case for wide, optically uniform PVA film rather than undifferentiated commodity grades. Source

2025

Integrated resin-to-film expertise remained a strategic differentiator because optical-grade PVA film performance depends on polymer quality, stretching control and surface uniformity working as one process chain. Source

Taken together, these developments show that market structure is being shaped by concrete technology, capacity, standards and regulatory changes rather than by demand growth alone. For suppliers, the practical implication is to align product roadmaps and regional support with the specific transition that is changing customer qualification or procurement behavior.

Report Scope & Segmentation

Attribute Coverage
Base year 2025
Estimated year 2026
Forecast period 2026–2034
2025 market size USD million 2,164.7
2026 estimated size USD million 2,288.1
2034 projected size USD million 3,565.1
CAGR (2026–2034) 5.7%
By Type Anti-glare Treatment (AG), Anti-glare + Low-reflective Treatment (AG + LR), CHC + LR Treatment, CHC Treatment, Other
By Application Display Panel, Sunglasses, Photography Equipment, Watch, Other
By End User Polarizer Manufacturers, Display Panel Manufacturers, Optical Goods Manufacturers
By Film Width Standard Width, Wide-format, Ultra-wide 3 m-class
Regions North America, Europe, Asia Pacific, South America, Middle East & Africa
Companies Kuraray, Samsung SDI, Mitsubishi Chemical, YS America, Nitto, Anhui Wanwei Group, Sinopec Chongqing SVW Chemical, Sichuan Longhua Film, Changchun Group

Frequently Asked Questions

What is the PVA Film for Polarizer market size in 2025?

The global market is valued at USD million 2,164.7 in 2025. The 2026 estimate is USD million 2,288.1, providing the starting point for the 2026–2034 forecast period.

What is the forecast market size by 2034?

The market is projected to reach USD million 3,565.1 by 2034, reflecting continued adoption across the applications and regions covered in this overview.

What is the expected CAGR during 2026–2034?

The market is expected to expand at a CAGR of 5.7% during 2026–2034. Growth is supported by technology upgrades, higher performance requirements and broader deployment in the strongest application segments.

Which region is the largest market?

Asia Pacific is the largest regional market in 2025. Its position reflects the concentration of relevant manufacturing, infrastructure deployment, technology investment or end-user demand supporting this market.

Which product type has the strongest growth profile?

Wide-format and high-uniformity grades have a strong growth profile because customers increasingly value performance, integration and lifecycle economics. Segment leadership can vary by application because qualification requirements and system architectures are not uniform.

Which application is expanding fastest?

Large-area display panels is one of the fastest-expanding application areas, supported by rising technical requirements and a growing need for qualified suppliers that can support design-in, integration and ongoing operations.

What are the main market drivers?

The main drivers include Larger display areas increase square-meter film consumption, Automotive cockpit displays add higher-specification optical demand, Chinese polarizer localization expands qualified local supply chains. Each driver affects purchasing by changing required performance, deployment intensity or the cost of system failure rather than simply increasing product awareness.

What are the main restraints?

Key restraints include Tight defect tolerances create qualification barriers and yield risk, LCD investment cycles expose suppliers to panel-industry volatility, Ultra-wide optical film lines require specialized capital and process control. These factors can extend qualification cycles, raise switching costs or shift demand toward competing architectures when customers prioritize risk reduction.

Who are the key market participants?

Key profiled participants include Kuraray, Samsung SDI, Mitsubishi Chemical, YS America, Nitto, Anhui Wanwei Group, Sinopec Chongqing SVW Chemical, alongside additional specialist and regional suppliers. Competitive positioning depends on product fit, qualification record, supply reliability and application support.

What determines supplier selection?

Supplier selection is typically determined by technical compliance, repeatable quality, qualification history, total lifecycle cost, delivery reliability and access to regional application support. In high-consequence applications, proven field performance can outweigh a modest unit-price difference.

Research Sources & Evidence Base

View research sources used for this overview.
  1. Kuraray. Poval Film product overview — Optical-use PVA film product and application context.
  2. Kuraray. Applications: Polarizing Plates — Use of PVA film in LCD polarizing plates.
  3. Kuraray. Capacity expansion for optical-use Poval film — 2025 investment supporting wider optical-use film and 3-meter-class polarizing film.
PVA Film for Polarizer Market Size, Share & Industry Analysis, By Type (Anti-glare Treatment (AG), Anti-glare + Low-reflective Treatment (AG + LR), CHC + LR Treatment, CHC Treatment, Other), By Application (Display Panel, Sunglasses, Photography Equipment, Watch, Other), By End User (Polarizer Manufacturers, Display Panel Manufacturers, Optical Goods Manufacturers), By Film Width (Standard Width, Wide-format, Ultra-wide 3 m-class), and Regional Forecast, 2026-2034

Get Sample Report PDF for Exclusive Insights

Report Sample Includes

  • Table of Contents
  • List of Tables & Figures
  • Charts, Research Methodology, and more...

PDF Icon Download Sample Report PDF

Download Sample Report

Table of Content

Table of Contents
1 Research Methodology and Statistical Scope
1.1 Market Definition and Statistical Scope of PVA Film for Polarizer
1.2 Key Market Segments
1.2.1 PVA Film for Polarizer Segment by Type
1.2.2 PVA Film for Polarizer Segment by Application
1.3 Methodology & Sources of Information
1.3.1 Research Methodology
1.3.2 Research Process
1.3.3 Market Breakdown and Data Triangulation
1.3.4 Base Year
1.3.5 Report Assumptions & Caveats
2 PVA Film for Polarizer Market Overview
2.1 Global Market Overview
2.1.1 Global PVA Film for Polarizer Market Size (M USD) Estimates and Forecasts (2026-2034)
2.1.2 Global PVA Film for Polarizer Sales Estimates and Forecasts (2026-2034)
2.2 Market Segment Executive Summary
2.3 Global Market Size by Region
3 PVA Film for Polarizer Market Competitive Landscape
3.1 Global PVA Film for Polarizer Sales by Manufacturers (2019-2025)
3.2 Global PVA Film for Polarizer Revenue Market Share by Manufacturers (2019-2025)
3.3 PVA Film for Polarizer Market Share by Company Type (Tier 1, Tier 2, and Tier 3)
3.4 Global PVA Film for Polarizer Average Price by Manufacturers (2019-2025)
3.5 Manufacturers PVA Film for Polarizer Sales Sites, Area Served, Product Type
3.6 PVA Film for Polarizer Market Competitive Situation and Trends
3.6.1 PVA Film for Polarizer Market Concentration Rate
3.6.2 Global 5 and 10 Largest PVA Film for Polarizer Players Market Share by Revenue
3.6.3 Mergers & Acquisitions, Expansion
4 PVA Film for Polarizer Industry Chain Analysis
4.1 PVA Film for Polarizer Industry Chain Analysis
4.2 Market Overview of Key Raw Materials
4.3 Midstream Market Analysis
4.4 Downstream Customer Analysis
5 The Development and Dynamics of PVA Film for Polarizer Market
5.1 Key Development Trends
5.2 Driving Factors
5.3 Market Challenges
5.4 Market Restraints
5.5 Industry News
5.5.1 New Product Developments
5.5.2 Mergers & Acquisitions
5.5.3 Expansions
5.5.4 Collaboration/Supply Contracts
5.6 Industry Policies
6 PVA Film for Polarizer Market Segmentation by Type
6.1 Evaluation Matrix of Segment Market Development Potential (Type)
6.2 Global PVA Film for Polarizer Sales Market Share by Type (2019-2025)
6.3 Global PVA Film for Polarizer Market Size Market Share by Type (2019-2025)
6.4 Global PVA Film for Polarizer Price by Type (2019-2025)
7 PVA Film for Polarizer Market Segmentation by Application
7.1 Evaluation Matrix of Segment Market Development Potential (Application)
7.2 Global PVA Film for Polarizer Market Sales by Application (2019-2025)
7.3 Global PVA Film for Polarizer Market Size (M USD) by Application (2019-2025)
7.4 Global PVA Film for Polarizer Sales Growth Rate by Application (2019-2025)
8 PVA Film for Polarizer Market Segmentation by Region
8.1 Global PVA Film for Polarizer Sales by Region
8.1.1 Global PVA Film for Polarizer Sales by Region
8.1.2 Global PVA Film for Polarizer Sales Market Share by Region
8.2 North America
8.2.1 North America PVA Film for Polarizer Sales by Country
8.2.2 U.S.
8.2.3 Canada
8.2.4 Mexico
8.3 Europe
8.3.1 Europe PVA Film for Polarizer Sales by Country
8.3.2 Germany
8.3.3 France
8.3.4 U.K.
8.3.5 Italy
8.3.6 Russia
8.4 Asia Pacific
8.4.1 Asia Pacific PVA Film for Polarizer Sales by Region
8.4.2 China
8.4.3 Japan
8.4.4 South Korea
8.4.5 India
8.4.6 Southeast Asia
8.5 South America
8.5.1 South America PVA Film for Polarizer Sales by Country
8.5.2 Brazil
8.5.3 Argentina
8.5.4 Columbia
8.6 Middle East and Africa
8.6.1 Middle East and Africa PVA Film for Polarizer Sales by Region
8.6.2 Saudi Arabia
8.6.3 UAE
8.6.4 Egypt
8.6.5 Nigeria
8.6.6 South Africa
9 Key Companies Profile
9.1 Kuraray
9.1.1 Kuraray PVA Film for Polarizer Basic Information
9.1.2 Kuraray PVA Film for Polarizer Product Overview
9.1.3 Kuraray PVA Film for Polarizer Product Market Performance
9.1.4 Kuraray Business Overview
9.1.5 Kuraray PVA Film for Polarizer SWOT Analysis
9.1.6 Kuraray Recent Developments
9.2 Samsung SDI
9.2.1 Samsung SDI PVA Film for Polarizer Basic Information
9.2.2 Samsung SDI PVA Film for Polarizer Product Overview
9.2.3 Samsung SDI PVA Film for Polarizer Product Market Performance
9.2.4 Samsung SDI Business Overview
9.2.5 Samsung SDI PVA Film for Polarizer SWOT Analysis
9.2.6 Samsung SDI Recent Developments
9.3 Mitsubishi Chemical
9.3.1 Mitsubishi Chemical PVA Film for Polarizer Basic Information
9.3.2 Mitsubishi Chemical PVA Film for Polarizer Product Overview
9.3.3 Mitsubishi Chemical PVA Film for Polarizer Product Market Performance
9.3.4 Mitsubishi Chemical PVA Film for Polarizer SWOT Analysis
9.3.5 Mitsubishi Chemical Business Overview
9.3.6 Mitsubishi Chemical Recent Developments
9.4 YS America
9.4.1 YS America PVA Film for Polarizer Basic Information
9.4.2 YS America PVA Film for Polarizer Product Overview
9.4.3 YS America PVA Film for Polarizer Product Market Performance
9.4.4 YS America Business Overview
9.4.5 YS America Recent Developments
9.5 Nitto
9.5.1 Nitto PVA Film for Polarizer Basic Information
9.5.2 Nitto PVA Film for Polarizer Product Overview
9.5.3 Nitto PVA Film for Polarizer Product Market Performance
9.5.4 Nitto Business Overview
9.5.5 Nitto Recent Developments
9.6 Anhui Wanwei Group
9.6.1 Anhui Wanwei Group PVA Film for Polarizer Basic Information
9.6.2 Anhui Wanwei Group PVA Film for Polarizer Product Overview
9.6.3 Anhui Wanwei Group PVA Film for Polarizer Product Market Performance
9.6.4 Anhui Wanwei Group Business Overview
9.6.5 Anhui Wanwei Group Recent Developments
9.7 Sinopec Chongqing SVW Chemical
9.7.1 Sinopec Chongqing SVW Chemical PVA Film for Polarizer Basic Information
9.7.2 Sinopec Chongqing SVW Chemical PVA Film for Polarizer Product Overview
9.7.3 Sinopec Chongqing SVW Chemical PVA Film for Polarizer Product Market Performance
9.7.4 Sinopec Chongqing SVW Chemical Business Overview
9.7.5 Sinopec Chongqing SVW Chemical Recent Developments
9.8 Sichuan Longhua Film
9.8.1 Sichuan Longhua Film PVA Film for Polarizer Basic Information
9.8.2 Sichuan Longhua Film PVA Film for Polarizer Product Overview
9.8.3 Sichuan Longhua Film PVA Film for Polarizer Product Market Performance
9.8.4 Sichuan Longhua Film Business Overview
9.8.5 Sichuan Longhua Film Recent Developments
9.9 Changchun Group
9.9.1 Changchun Group PVA Film for Polarizer Basic Information
9.9.2 Changchun Group PVA Film for Polarizer Product Overview
9.9.3 Changchun Group PVA Film for Polarizer Product Market Performance
9.9.4 Changchun Group Business Overview
9.9.5 Changchun Group Recent Developments
10 PVA Film for Polarizer Market Forecast by Region
10.1 Global PVA Film for Polarizer Market Size Forecast
10.2 Global PVA Film for Polarizer Market Forecast by Region
10.2.1 North America Market Size Forecast by Country
10.2.2 Europe PVA Film for Polarizer Market Size Forecast by Country
10.2.3 Asia Pacific PVA Film for Polarizer Market Size Forecast by Region
10.2.4 South America PVA Film for Polarizer Market Size Forecast by Country
10.2.5 Middle East and Africa Forecasted Consumption of PVA Film for Polarizer by Country
11 Forecast Market by Type and by Application (2025-2030)
11.1 Global PVA Film for Polarizer Market Forecast by Type (2025-2030)
11.1.1 Global Forecasted Sales of PVA Film for Polarizer by Type (2025-2030)
11.1.2 Global PVA Film for Polarizer Market Size Forecast by Type (2025-2030)
11.1.3 Global Forecasted Price of PVA Film for Polarizer by Type (2025-2030)
11.2 Global PVA Film for Polarizer Market Forecast by Application (2025-2030)
11.2.1 Global PVA Film for Polarizer Sales (K Units) Forecast by Application
11.2.2 Global PVA Film for Polarizer Market Size (M USD) Forecast by Application (2025-2030)
12 Conclusion and Key FindingsList of Tables
Table 1. Introduction of the Type
Table 2. Introduction of the Application
Table 3. Market Size (M USD) Segment Executive Summary
Table 4. PVA Film for Polarizer Market Size Comparison by Region (M USD)
Table 5. Global PVA Film for Polarizer Sales (K Units) by Manufacturers (2019-2025)
Table 6. Global PVA Film for Polarizer Sales Market Share by Manufacturers (2019-2025)
Table 7. Global PVA Film for Polarizer Revenue (M USD) by Manufacturers (2019-2025)
Table 8. Global PVA Film for Polarizer Revenue Share by Manufacturers (2019-2025)
Table 9. Company Type (Tier 1, Tier 2, and Tier 3) & (based on the Revenue in PVA Film for Polarizer as of 2022)
Table 10. Global Market PVA Film for Polarizer Average Price (USD/Unit) of Key Manufacturers (2019-2025)
Table 11. Manufacturers PVA Film for Polarizer Sales Sites and Area Served
Table 12. Manufacturers PVA Film for Polarizer Product Type
Table 13. Global PVA Film for Polarizer Manufacturers Market Concentration Ratio (CR5 and HHI)
Table 14. Mergers & Acquisitions, Expansion Plans
Table 15. Industry Chain Map of PVA Film for Polarizer
Table 16. Market Overview of Key Raw Materials
Table 17. Midstream Market Analysis
Table 18. Downstream Customer Analysis
Table 19. Key Development Trends
Table 20. Driving Factors
Table 21. PVA Film for Polarizer Market Challenges
Table 22. Global PVA Film for Polarizer Sales by Type (K Units)
Table 23. Global PVA Film for Polarizer Market Size by Type (M USD)
Table 24. Global PVA Film for Polarizer Sales (K Units) by Type (2019-2025)
Table 25. Global PVA Film for Polarizer Sales Market Share by Type (2019-2025)
Table 26. Global PVA Film for Polarizer Market Size (M USD) by Type (2019-2025)
Table 27. Global PVA Film for Polarizer Market Size Share by Type (2019-2025)
Table 28. Global PVA Film for Polarizer Price (USD/Unit) by Type (2019-2025)
Table 29. Global PVA Film for Polarizer Sales (K Units) by Application
Table 30. Global PVA Film for Polarizer Market Size by Application
Table 31. Global PVA Film for Polarizer Sales by Application (2019-2025) & (K Units)
Table 32. Global PVA Film for Polarizer Sales Market Share by Application (2019-2025)
Table 33. Global PVA Film for Polarizer Sales by Application (2019-2025) & (M USD)
Table 34. Global PVA Film for Polarizer Market Share by Application (2019-2025)
Table 35. Global PVA Film for Polarizer Sales Growth Rate by Application (2019-2025)
Table 36. Global PVA Film for Polarizer Sales by Region (2019-2025) & (K Units)
Table 37. Global PVA Film for Polarizer Sales Market Share by Region (2019-2025)
Table 38. North America PVA Film for Polarizer Sales by Country (2019-2025) & (K Units)
Table 39. Europe PVA Film for Polarizer Sales by Country (2019-2025) & (K Units)
Table 40. Asia Pacific PVA Film for Polarizer Sales by Region (2019-2025) & (K Units)
Table 41. South America PVA Film for Polarizer Sales by Country (2019-2025) & (K Units)
Table 42. Middle East and Africa PVA Film for Polarizer Sales by Region (2019-2025) & (K Units)
Table 43. Kuraray PVA Film for Polarizer Basic Information
Table 44. Kuraray PVA Film for Polarizer Product Overview
Table 45. Kuraray PVA Film for Polarizer Sales (K Units), Revenue (M USD), Price (USD/Unit) and Gross Margin (2019-2025)
Table 46. Kuraray Business Overview
Table 47. Kuraray PVA Film for Polarizer SWOT Analysis
Table 48. Kuraray Recent Developments
Table 49. Samsung SDI PVA Film for Polarizer Basic Information
Table 50. Samsung SDI PVA Film for Polarizer Product Overview
Table 51. Samsung SDI PVA Film for Polarizer Sales (K Units), Revenue (M USD), Price (USD/Unit) and Gross Margin (2019-2025)
Table 52. Samsung SDI Business Overview
Table 53. Samsung SDI PVA Film for Polarizer SWOT Analysis
Table 54. Samsung SDI Recent Developments
Table 55. Mitsubishi Chemical PVA Film for Polarizer Basic Information
Table 56. Mitsubishi Chemical PVA Film for Polarizer Product Overview
Table 57. Mitsubishi Chemical PVA Film for Polarizer Sales (K Units), Revenue (M USD), Price (USD/Unit) and Gross Margin (2019-2025)
Table 58. Mitsubishi Chemical PVA Film for Polarizer SWOT Analysis
Table 59. Mitsubishi Chemical Business Overview
Table 60. Mitsubishi Chemical Recent Developments
Table 61. YS America PVA Film for Polarizer Basic Information
Table 62. YS America PVA Film for Polarizer Product Overview
Table 63. YS America PVA Film for Polarizer Sales (K Units), Revenue (M USD), Price (USD/Unit) and Gross Margin (2019-2025)
Table 64. YS America Business Overview
Table 65. YS America Recent Developments
Table 66. Nitto PVA Film for Polarizer Basic Information
Table 67. Nitto PVA Film for Polarizer Product Overview
Table 68. Nitto PVA Film for Polarizer Sales (K Units), Revenue (M USD), Price (USD/Unit) and Gross Margin (2019-2025)
Table 69. Nitto Business Overview
Table 70. Nitto Recent Developments
Table 71. Anhui Wanwei Group PVA Film for Polarizer Basic Information
Table 72. Anhui Wanwei Group PVA Film for Polarizer Product Overview
Table 73. Anhui Wanwei Group PVA Film for Polarizer Sales (K Units), Revenue (M USD), Price (USD/Unit) and Gross Margin (2019-2025)
Table 74. Anhui Wanwei Group Business Overview
Table 75. Anhui Wanwei Group Recent Developments
Table 76. Sinopec Chongqing SVW Chemical PVA Film for Polarizer Basic Information
Table 77. Sinopec Chongqing SVW Chemical PVA Film for Polarizer Product Overview
Table 78. Sinopec Chongqing SVW Chemical PVA Film for Polarizer Sales (K Units), Revenue (M USD), Price (USD/Unit) and Gross Margin (2019-2025)
Table 79. Sinopec Chongqing SVW Chemical Business Overview
Table 80. Sinopec Chongqing SVW Chemical Recent Developments
Table 81. Sichuan Longhua Film PVA Film for Polarizer Basic Information
Table 82. Sichuan Longhua Film PVA Film for Polarizer Product Overview
Table 83. Sichuan Longhua Film PVA Film for Polarizer Sales (K Units), Revenue (M USD), Price (USD/Unit) and Gross Margin (2019-2025)
Table 84. Sichuan Longhua Film Business Overview
Table 85. Sichuan Longhua Film Recent Developments
Table 86. Changchun Group PVA Film for Polarizer Basic Information
Table 87. Changchun Group PVA Film for Polarizer Product Overview
Table 88. Changchun Group PVA Film for Polarizer Sales (K Units), Revenue (M USD), Price (USD/Unit) and Gross Margin (2019-2025)
Table 89. Changchun Group Business Overview
Table 90. Changchun Group Recent Developments
Table 91. Global PVA Film for Polarizer Sales Forecast by Region (2025-2030) & (K Units)
Table 92. Global PVA Film for Polarizer Market Size Forecast by Region (2025-2030) & (M USD)
Table 93. North America PVA Film for Polarizer Sales Forecast by Country (2025-2030) & (K Units)
Table 94. North America PVA Film for Polarizer Market Size Forecast by Country (2025-2030) & (M USD)
Table 95. Europe PVA Film for Polarizer Sales Forecast by Country (2025-2030) & (K Units)
Table 96. Europe PVA Film for Polarizer Market Size Forecast by Country (2025-2030) & (M USD)
Table 97. Asia Pacific PVA Film for Polarizer Sales Forecast by Region (2025-2030) & (K Units)
Table 98. Asia Pacific PVA Film for Polarizer Market Size Forecast by Region (2025-2030) & (M USD)
Table 99. South America PVA Film for Polarizer Sales Forecast by Country (2025-2030) & (K Units)
Table 100. South America PVA Film for Polarizer Market Size Forecast by Country (2025-2030) & (M USD)
Table 101. Middle East and Africa PVA Film for Polarizer Consumption Forecast by Country (2025-2030) & (Units)
Table 102. Middle East and Africa PVA Film for Polarizer Market Size Forecast by Country (2025-2030) & (M USD)
Table 103. Global PVA Film for Polarizer Sales Forecast by Type (2025-2030) & (K Units)
Table 104. Global PVA Film for Polarizer Market Size Forecast by Type (2025-2030) & (M USD)
Table 105. Global PVA Film for Polarizer Price Forecast by Type (2025-2030) & (USD/Unit)
Table 106. Global PVA Film for Polarizer Sales (K Units) Forecast by Application (2025-2030)
Table 107. Global PVA Film for Polarizer Market Size Forecast by Application (2025-2030) & (M USD)
List of Figures
Figure 1. Product Picture of PVA Film for Polarizer
Figure 2. Data Triangulation
Figure 3. Key Caveats
Figure 4. Global PVA Film for Polarizer Market Size (M USD), 2026-2034
Figure 5. Global PVA Film for Polarizer Market Size (M USD) (2026-2034)
Figure 6. Global PVA Film for Polarizer Sales (K Units) & (2026-2034)
Figure 7. Evaluation Matrix of Segment Market Development Potential (Type)
Figure 8. Evaluation Matrix of Segment Market Development Potential (Application)
Figure 9. Evaluation Matrix of Regional Market Development Potential
Figure 10. PVA Film for Polarizer Market Size by Country (M USD)
Figure 11. PVA Film for Polarizer Sales Share by Manufacturers in 2023
Figure 12. Global PVA Film for Polarizer Revenue Share by Manufacturers in 2023
Figure 13. PVA Film for Polarizer Market Share by Company Type (Tier 1, Tier 2 and Tier 3): 2023
Figure 14. Global Market PVA Film for Polarizer Average Price (USD/Unit) of Key Manufacturers in 2023
Figure 15. The Global 5 and 10 Largest Players: Market Share by PVA Film for Polarizer Revenue in 2023
Figure 16. Evaluation Matrix of Segment Market Development Potential (Type)
Figure 17. Global PVA Film for Polarizer Market Share by Type
Figure 18. Sales Market Share of PVA Film for Polarizer by Type (2019-2025)
Figure 19. Sales Market Share of PVA Film for Polarizer by Type in 2023
Figure 20. Market Size Share of PVA Film for Polarizer by Type (2019-2025)
Figure 21. Market Size Market Share of PVA Film for Polarizer by Type in 2023
Figure 22. Evaluation Matrix of Segment Market Development Potential (Application)
Figure 23. Global PVA Film for Polarizer Market Share by Application
Figure 24. Global PVA Film for Polarizer Sales Market Share by Application (2019-2025)
Figure 25. Global PVA Film for Polarizer Sales Market Share by Application in 2023
Figure 26. Global PVA Film for Polarizer Market Share by Application (2019-2025)
Figure 27. Global PVA Film for Polarizer Market Share by Application in 2023
Figure 28. Global PVA Film for Polarizer Sales Growth Rate by Application (2019-2025)
Figure 29. Global PVA Film for Polarizer Sales Market Share by Region (2019-2025)
Figure 30. North America PVA Film for Polarizer Sales and Growth Rate (2019-2025) & (K Units)
Figure 31. North America PVA Film for Polarizer Sales Market Share by Country in 2023
Figure 32. U.S. PVA Film for Polarizer Sales and Growth Rate (2019-2025) & (K Units)
Figure 33. Canada PVA Film for Polarizer Sales (K Units) and Growth Rate (2019-2025)
Figure 34. Mexico PVA Film for Polarizer Sales (Units) and Growth Rate (2019-2025)
Figure 35. Europe PVA Film for Polarizer Sales and Growth Rate (2019-2025) & (K Units)
Figure 36. Europe PVA Film for Polarizer Sales Market Share by Country in 2023
Figure 37. Germany PVA Film for Polarizer Sales and Growth Rate (2019-2025) & (K Units)
Figure 38. France PVA Film for Polarizer Sales and Growth Rate (2019-2025) & (K Units)
Figure 39. U.K. PVA Film for Polarizer Sales and Growth Rate (2019-2025) & (K Units)
Figure 40. Italy PVA Film for Polarizer Sales and Growth Rate (2019-2025) & (K Units)
Figure 41. Russia PVA Film for Polarizer Sales and Growth Rate (2019-2025) & (K Units)
Figure 42. Asia Pacific PVA Film for Polarizer Sales and Growth Rate (K Units)
Figure 43. Asia Pacific PVA Film for Polarizer Sales Market Share by Region in 2023
Figure 44. China PVA Film for Polarizer Sales and Growth Rate (2019-2025) & (K Units)
Figure 45. Japan PVA Film for Polarizer Sales and Growth Rate (2019-2025) & (K Units)
Figure 46. South Korea PVA Film for Polarizer Sales and Growth Rate (2019-2025) & (K Units)
Figure 47. India PVA Film for Polarizer Sales and Growth Rate (2019-2025) & (K Units)
Figure 48. Southeast Asia PVA Film for Polarizer Sales and Growth Rate (2019-2025) & (K Units)
Figure 49. South America PVA Film for Polarizer Sales and Growth Rate (K Units)
Figure 50. South America PVA Film for Polarizer Sales Market Share by Country in 2023
Figure 51. Brazil PVA Film for Polarizer Sales and Growth Rate (2019-2025) & (K Units)
Figure 52. Argentina PVA Film for Polarizer Sales and Growth Rate (2019-2025) & (K Units)
Figure 53. Columbia PVA Film for Polarizer Sales and Growth Rate (2019-2025) & (K Units)
Figure 54. Middle East and Africa PVA Film for Polarizer Sales and Growth Rate (K Units)
Figure 55. Middle East and Africa PVA Film for Polarizer Sales Market Share by Region in 2023
Figure 56. Saudi Arabia PVA Film for Polarizer Sales and Growth Rate (2019-2025) & (K Units)
Figure 57. UAE PVA Film for Polarizer Sales and Growth Rate (2019-2025) & (K Units)
Figure 58. Egypt PVA Film for Polarizer Sales and Growth Rate (2019-2025) & (K Units)
Figure 59. Nigeria PVA Film for Polarizer Sales and Growth Rate (2019-2025) & (K Units)
Figure 60. South Africa PVA Film for Polarizer Sales and Growth Rate (2019-2025) & (K Units)
Figure 61. Global PVA Film for Polarizer Sales Forecast by Volume (2026-2034) & (K Units)
Figure 62. Global PVA Film for Polarizer Market Size Forecast by Value (2026-2034) & (M USD)
Figure 63. Global PVA Film for Polarizer Sales Market Share Forecast by Type (2025-2030)
Figure 64. Global PVA Film for Polarizer Market Share Forecast by Type (2025-2030)
Figure 65. Global PVA Film for Polarizer Sales Forecast by Application (2025-2030)
Figure 66. Global PVA Film for Polarizer Market Share Forecast by Application (2025-2030)