PV and Energy Storage Fuses Market Overview
Fuse refers to an electrical device that uses the heat generated by itself to fuse the melt and disconnect the circuit when the current exceeds the specified value. Fuses are widely used in high and low voltage distribution systems, control systems, and electrical equipment. As short circuit and overcurrent protectors, they are one of the most commonly used protective devices.
This report provides a deep insight into the global PV and Energy Storage Fuses market covering all its essential aspects. This ranges from a macro overview of the market to micro details of the market size, competitive landscape, development trend, niche market, key market drivers and challenges, SWOT analysis, value chain analysis, etc.
The analysis helps the reader to shape the competition within the industries and strategies for the competitive environment to enhance the potential profit. Furthermore, it provides a simple framework for evaluating and accessing the position of the business organization. The report structure also focuses on the competitive landscape of the Global PV and Energy Storage Fuses Market, this report introduces in detail the market share, market performance, product situation, operation situation, etc. of the main players, which helps the readers in the industry to identify the main competitors and deeply understand the competition pattern of the market.
In a word, this report is a must-read for industry players, investors, researchers, consultants, business strategists, and all those who have any kind of stake or are planning to foray into the PV and Energy Storage Fuses market in any manner.
PV and Energy Storage Fuses Market Analysis:
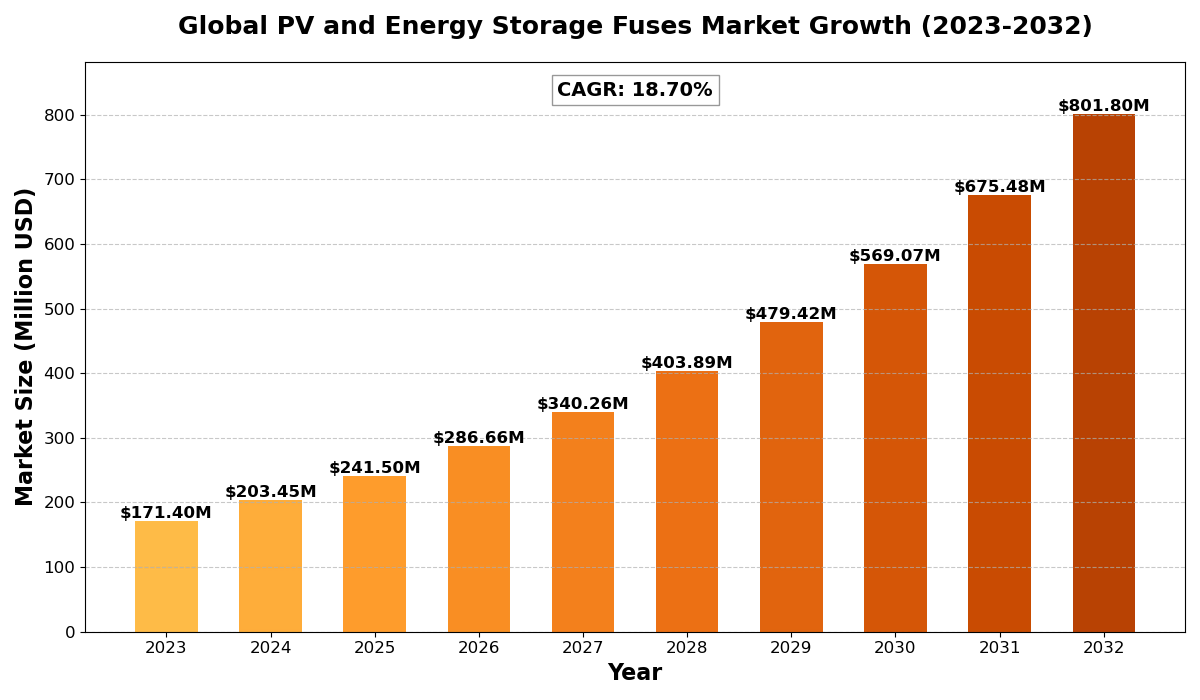
The global PV and Energy Storage Fuses Market size was estimated at USD 171.40 million in 2023 and is projected to reach USD 801.80 million by 2032, exhibiting a CAGR of 18.70% during the forecast period.
North America PV and Energy Storage Fuses market size was estimated at USD 60.13 million in 2023, at a CAGR of 16.03% during the forecast period of 2025 through 2032.
PV and Energy Storage Fuses Key Market Trends :
- Rising Adoption of Renewable Energy
Growing investments in solar power and energy storage solutions are increasing the demand for fuses, ensuring safety and efficiency. - Advancements in Fuse Technology
Smart and self-resetting fuses are emerging, enhancing reliability and performance in electrical protection systems. - Increasing Energy Storage Deployments
With the rise of battery storage systems, specialized fuses designed for energy storage applications are gaining traction. - Regulatory and Safety Standards Compliance
Stringent government regulations for electrical safety are pushing manufacturers to develop high-quality and reliable fuses. - Growing Demand for High-Voltage Fuses
The need for high-capacity fuses is increasing with the expansion of grid infrastructure and large-scale renewable energy projects.
PV and Energy Storage Fuses Market Regional Analysis :

-
North America:
Strong demand driven by EVs, 5G infrastructure, and renewable energy, with the U.S. leading the market.
-
Europe:
Growth fueled by automotive electrification, renewable energy, and strong regulatory support, with Germany as a key player.
-
Asia-Pacific:
Dominates the market due to large-scale manufacturing in China and Japan, with growing demand from EVs, 5G, and semiconductors.
-
South America:
Emerging market, driven by renewable energy and EV adoption, with Brazil leading growth.
-
Middle East & Africa:
Gradual growth, mainly due to investments in renewable energy and EV infrastructure, with Saudi Arabia and UAE as key contributors.
PV and Energy Storage Fuses Market Segmentation :
The research report includes specific segments by region (country), manufacturers, Type, and Application. Market segmentation creates subsets of a market based on product type, end-user or application, Geographic, and other factors. By understanding the market segments, the decision-maker can leverage this targeting in the product, sales, and marketing strategies. Market segments can power your product development cycles by informing how you create product offerings for different segments.
Key Company
- Littelfuse
- Eton
- Mersen
- Siba
- PEC
- Sensata
- Siemens
- SCHURTER
- ABB
- SOC
- Xi’an Sinofuse Electric
- Guangdong Chnbel Energy Technology
- Superfuse
Market Segmentation (by Type)
- High Voltage Fuse
- Low Voltage Fuse
Market Segmentation (by Application)
- Convergence System
- Inverter System
- Control System
- Energy Storage System
Market Drivers
- Surge in Renewable Energy Projects
The increasing installation of solar PV and battery storage systems worldwide is driving the demand for efficient fuse protection. - Growing Emphasis on Electrical Safety
Rising awareness regarding electrical safety and regulatory compliance is boosting the adoption of high-quality fuses. - Expansion of Smart Grid Infrastructure
The integration of advanced grid technologies and energy management solutions is fueling the need for reliable fuse components.
Market Restraints
- High Initial Investment Costs
Advanced fuses with smart technology require higher investment, which can be a deterrent for some end-users. - Complexity in Fuse Selection
The presence of multiple fuse types and specifications can make selection and installation more challenging for buyers. - Market Competition from Circuit Breakers
The increasing adoption of circuit breakers as an alternative to fuses may hinder market growth.
Market Opportunities
- Rising Investments in Smart Energy Solutions
The integration of smart grid and IoT-based monitoring systems presents new opportunities for advanced fuse technologies. - Expansion in Emerging Markets
Growing demand in Asia-Pacific, South America, and the Middle East is opening up lucrative business prospects for manufacturers. - Development of Eco-Friendly Fuses
Manufacturers are focusing on sustainable and recyclable fuse materials to align with environmental concerns and regulations.
Market Challenges
- Fluctuating Raw Material Prices
The cost variations in essential materials like copper and silver impact the pricing and profitability of fuse manufacturers. - Limited Awareness in Developing Regions
A lack of awareness about fuse specifications and standards in emerging markets poses a challenge to widespread adoption. - Technical Integration in Energy Storage Systems
Ensuring compatibility with evolving energy storage technologies requires constant innovation and adaptation.
Key Benefits of This Market Research:
- Industry drivers, restraints, and opportunities covered in the study
- Neutral perspective on the market performance
- Recent industry trends and developments
- Competitive landscape & strategies of key players
- Potential & niche segments and regions exhibiting promising growth covered
- Historical, current, and projected market size, in terms of value
- In-depth analysis of the PV and Energy Storage Fuses Market
- Overview of the regional outlook of the PV and Energy Storage Fuses Market:
Key Reasons to Buy this Report:
- Access to date statistics compiled by our researchers. These provide you with historical and forecast data, which is analyzed to tell you why your market is set to change
- This enables you to anticipate market changes to remain ahead of your competitors
- You will be able to copy data from the Excel spreadsheet straight into your marketing plans, business presentations, or other strategic documents
- The concise analysis, clear graph, and table format will enable you to pinpoint the information you require quickly
- Provision of market value data for each segment and sub-segment
- Indicates the region and segment that is expected to witness the fastest growth as well as to dominate the market
- Provides insight into the market through Value Chain
- Market dynamics scenario, along with growth opportunities of the market in the years to come
- 6-month post-sales analyst support
Customization of the Report
In case of any queries or customization requirements, please connect with our sales team, who will ensure that your requirements are met.
FAQs
Q: What are the key driving factors and opportunities in the PV and Energy Storage Fuses market?
A: The primary driving factors include increasing adoption of renewable energy, growing investments in smart grids, and rising safety regulations. Opportunities exist in emerging markets, smart fuse technology, and eco-friendly fuse development.
Q: Which region is projected to have the largest market share?
A: Asia-Pacific is expected to dominate the market due to rapid industrialization, increasing solar power installations, and strong government initiatives in renewable energy.
Q: Who are the top players in the global PV and Energy Storage Fuses market?
A: Key players include Littelfuse, Eton, Mersen, Siba, PEC, Sensata, Siemens, SCHURTER, ABB, SOC, Xi’an Sinofuse Electric, Guangdong Chnbel Energy Technology, and Superfuse.
Q: What are the latest technological advancements in the industry?
A: Innovations include smart fuses with real-time monitoring, self-resetting fuses, and high-efficiency fuses designed specifically for energy storage applications.
Q: What is the current size of the global PV and Energy Storage Fuses market?
A: The market was valued at USD 171.40 million in 2023 and is projected to reach USD 801.80 million by 2032, growing at a CAGR of 18.70%.

Get Sample Report PDF for Exclusive Insights
Report Sample Includes
- Table of Contents
- List of Tables & Figures
- Charts, Research Methodology, and more...