Printing Densitometer Market, Trends, Business Strategies 2026-2034

Global Printing Densitometer Market was valued at USD 107 million in 2025 and is projected to reach USD 153 million by 2034, at a CAGR of 4.5%.

PDF Icon Download Sample Report PDF
  • Quick Dispatch

    All Orders

  • Secure Payment

    100% Secure Payment

Price range: $1,500.00 through $4,250.00

Clear

Printing Densitometer Market Insights

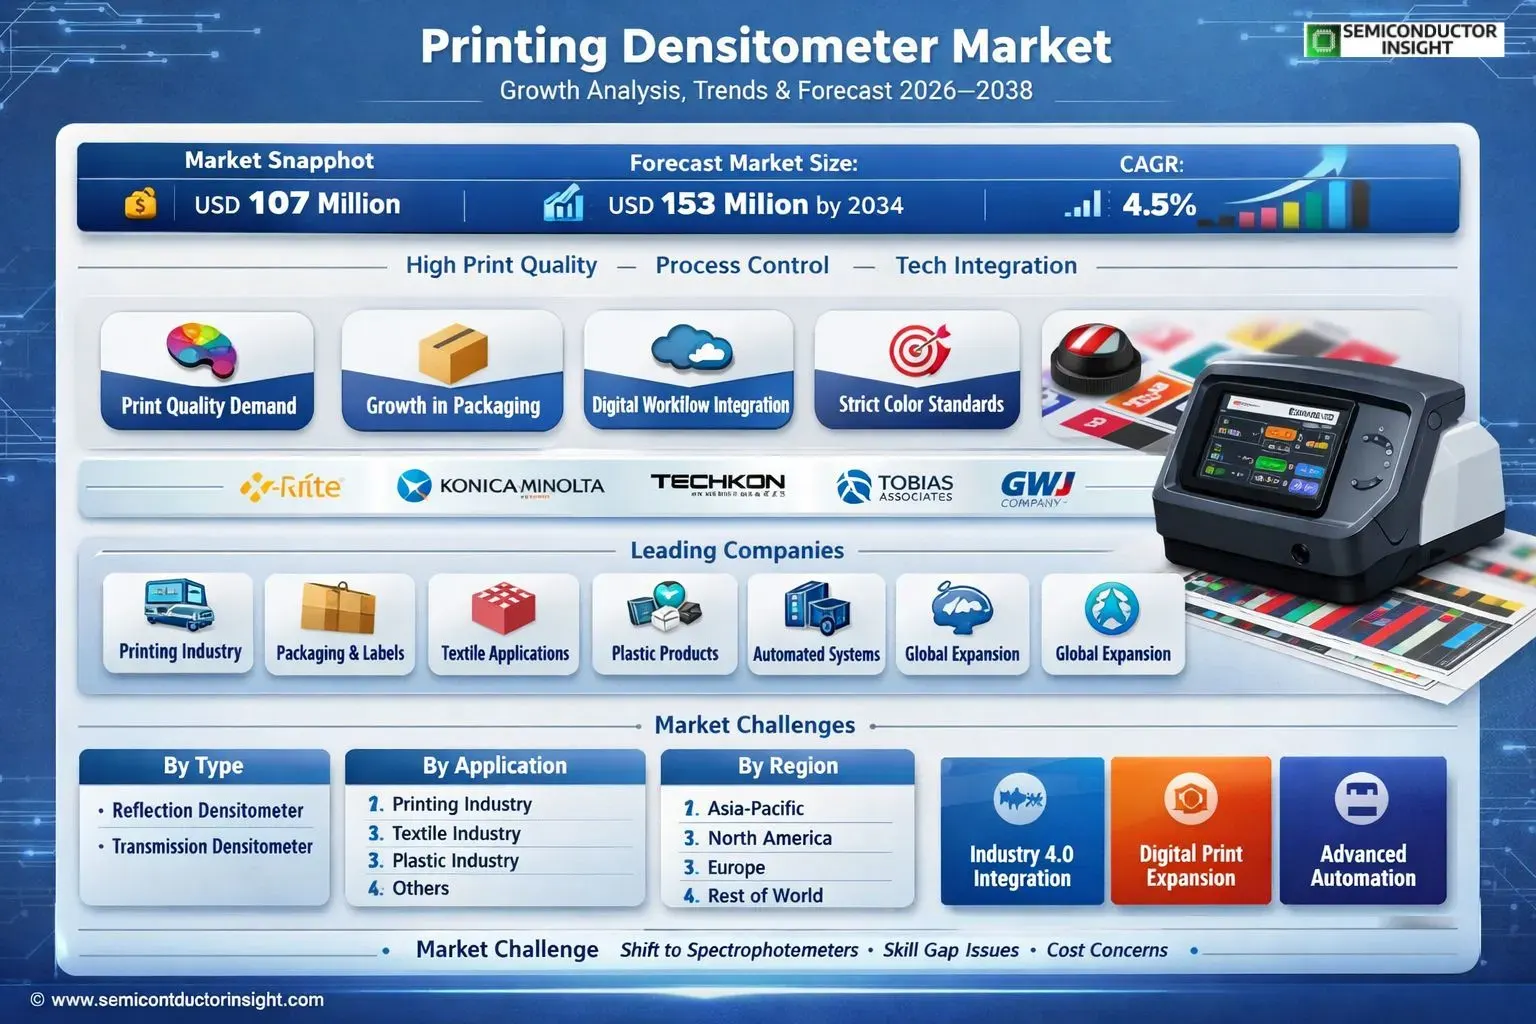
Global printing densitometer market size was valued at USD 107 million in 2025. The market is projected to grow from USD 112 million in 2026 to USD 153 million by 2034, exhibiting a CAGR of 4.5% during the forecast period.

A printing densitometer is a precision instrument used primarily in the printing industry to measure the optical density, or darkness, of ink on a substrate. This tool is fundamental for ensuring color consistency, maintaining stringent quality control, and achieving accurate image reproduction throughout the printing process. By providing objective data on ink density, operators can precisely adjust press parameters to minimize waste and guarantee uniform, high-quality prints across large print runs.

The market’s steady growth is driven by the persistent demand for superior print quality across packaging, commercial printing, and publishing sectors. Furthermore, the integration of densitometers with digital workflow systems and the rising adoption of automated color measurement solutions are key technological trends supporting expansion. However, competition from advanced spectrophotometers presents a challenge for certain segments. Leading players such as X-Rite (now part of Danaher), Konica Minolta, and Techkon continue to innovate with user-friendly and connected devices to meet evolving industry standards for efficiency and color accuracy.

Printing Densitometer Market


MARKET DRIVERS

Emphasis on Print Quality and Color Consistency

The ongoing demand for high-fidelity color reproduction in commercial and packaging printing is a primary driver for the printing densitometer market. As brands seek to maintain consistent visual identity across global campaigns, the need for precise color measurement and density control in pressrooms has intensified. This technological requirement directly supports the adoption of advanced handheld and automated densitometers, which are critical for meeting tight color tolerances, reducing waste, and ensuring brand integrity.

Growth in Packaging and Label Printing

The expansion of the e-commerce sector and evolving consumer goods packaging are fueling specialized printing applications. The printing densitometer market benefits significantly from this trend, as ensuring accurate ink density on diverse substrates like flexible film, corrugated board, and metallic foils is essential for quality and regulatory compliance. Investments in new packaging lines often include integrated color measurement solutions to maintain process control.

Stringent industry standards for spot color matching and process control continue to mandate the use of professional-grade printing densitometers as essential quality assurance tools.

Furthermore, the gradual integration of densitometry with digital workflow software for data tracking and analytics is creating a more connected and efficient pressroom environment, enhancing the value proposition of modern densitometer devices.

MARKET CHALLENGES


Transition to Spectrophotometry and Digital Workflows

A significant challenge facing the printing densitometer market is the competitive pressure from spectrophotometers and advanced color management systems. While densitometers excel at measuring ink film thickness and dot gain, many print shops are adopting spectrophotometers for their ability to measure color directly, which is more aligned with brand color communication and digital proofing. This shift requires densitometer manufacturers to innovate or integrate complementary functionalities to maintain relevance in a changing technological landscape.

Other Challenges

Skill Gap and Training Requirements

Effective use of a printing densitometer requires trained personnel to interpret density readings and make appropriate press adjustments. The shortage of skilled press operators who understand color theory and densitometry principles can limit the effective utilization and ROI of this equipment, particularly in smaller print shops.

Cost Sensitivity in Small to Medium Print Shops

For many small and medium-sized enterprises (SMEs), the initial capital investment for high-end or automated densitometry systems can be prohibitive. This cost sensitivity often leads to reliance on older equipment or visual inspection, creating a barrier to market penetration for newer, more advanced printing densitometer solutions.

MARKET RESTRAINTS


Maturation of Analog Print Segments

The overall growth of the printing densitometer market is tempered by the relative maturity and slow growth of certain traditional analog print segments, such as commercial offset and newspaper printing. While these sectors remain substantial users of densitometry, their capital expenditure cycles are long, and fleet expansion is limited. This results in a replacement-driven demand rather than one fueled by new market creation, constraining the pace of overall market expansion for traditional printing densitometer devices.

MARKET OPPORTUNITIES

Integration with Industry 4.0 and Smart Manufacturing

The rise of smart factories and data-driven manufacturing presents a substantial opportunity. Developing printing densitometers with IoT connectivity, wireless data transmission, and cloud-based analytics can position them as key sensors within Industry 4.0 pressroom ecosystems. This allows for real-time monitoring, predictive maintenance alerts, and seamless integration with MIS (Management Information Systems), creating a strong value-add for modern print service providers.

Expansion into Hybrid and Digital Print Applications

The growing adoption of high-speed production inkjet and toner-based digital presses for packaging and commercial work opens a new frontier. These digital processes also require consistent color and density control. There is a significant opportunity to develop and market specialized printing densitometer solutions tailored for the unique characteristics and faster turnaround times of digital print environments, bridging a gap in the current quality control toolkit.

Printing Densitometer Market Trends

Advancement in Color Measurement and Data Integration

The evolution towards a more data-centric print workflow is a dominant trend in the Printing Densitometer Market. Modern densitometers are increasingly equipped with wireless connectivity, cloud-based software, and advanced spectral analysis capabilities beyond basic density readings. This allows for real-time monitoring of print quality and automatic adjustments to press settings. The integration of densitometry data with broader color management and production execution systems is becoming standard. This trend is driven by the demand for higher efficiency, reduced waste from color errors, and the need for consistent brand color reproduction across diverse printing platforms and global locations.

Other Trends

Expansion into Non-Traditional Applications

While the core application remains the commercial and packaging printing industry, the utility of densitometers is growing in adjacent sectors. There is increased adoption within the textile industry for measuring print density on fabrics and in the plastic industry for quality control of decorated or printed polymer surfaces. This diversification represents a strategic trend for manufacturers in the Printing Densitometer Market to expand their addressable market and develop specialized models tailored to different substrate properties and measurement environments.

Consolidation and Specialized Competition

The competitive landscape features a mix of established global players and specialized manufacturers. Leading companies such as X-Rite, Konica Minolta, and Techkon continue to drive innovation with comprehensive solutions. Concurrently, the market sees competition from focused suppliers offering cost-effective or application-specific instruments. This dynamic encourages continuous product development, with trends focusing on improving user interfaces, enhancing ruggedness for press-side use, and developing portable, handheld devices with laboratory-grade accuracy for on-site verification.

Shift Towards Process Automation and Standardization

A significant trend is the role of the printing densitometer as a critical component in automated, closed-loop control systems. As printing presses become more automated, the demand for densitometers that can provide reliable, repeatable measurements for automated feedback loops is rising. This trend is closely tied to the industry-wide push for standardization, such as adherence to ISO printing standards. Densitometers are essential for verifying and maintaining these standards, ensuring that print buyers and producers have a common, objective benchmark for quality, which is crucial in a globalized supply chain.

COMPETITIVE LANDSCAPE

Key Industry Players

A consolidated market dominated by established providers of measurement and quality control solutions.

Global Printing Densitometer market is moderately consolidated, with the top five players accounting for a significant revenue share as of 2025. Market leadership is firmly held by companies like X-Rite (now part of Danaher) and Konica Minolta Sensing, which leverage their broad portfolios in color management and optical measurement technologies. These major players compete on precision, integration with digital workflows, software capabilities, and global sales and support networks. Competition often centers on product features such as speed, accuracy, connectivity (USB, Bluetooth), and the ability to measure across diverse substrates and printing processes, including offset, flexographic, and digital printing.

Beyond the top-tier leaders, several specialized and regional players hold important niche positions. Companies such as Techkon and Tobias Associates are recognized for their robust and user-centric densitometer designs tailored for pressroom environments. Emerging manufacturers, particularly in Asia, are focusing on cost-competitive and increasingly sophisticated offerings, addressing the needs of small to mid-sized print shops and expanding into adjacent industrial applications. The competitive intensity is further driven by continuous R&D investments toward multi-functional devices that combine densitometry with spectrophotometry for comprehensive color control.

List of Key Printing Densitometer Companies Profiled

Segment Analysis:


Segment Category Sub-Segments Key Insights
By Type
  • Reflection Densitometer
  • Transmission Densitometer
Reflection Densitometer is the dominant segment, driven by its primary application in measuring the density of ink on opaque printed substrates which constitute the vast majority of printing jobs.

  • Its fundamental role in maintaining color consistency and quality control for surface printing on paper, cardboard, and packaging materials ensures steady demand.
  • Continuous technological integration for higher precision and connectivity with digital workflow systems supports its leading position and adoption in modern print shops.
  • The instrument’s essential function in standard offset, flexographic, and gravure printing processes underpins its critical status as a core quality assurance tool.
By Application
  • Printing Industry
  • Textile Industry
  • Plastic Industry
  • Others
Printing Industry remains the unequivocal leading application segment, as densitometers are intrinsic to the printing process itself.

  • Demand is anchored in the instrument’s non-negotiable role for pre-press calibration, press-side density monitoring, and final quality verification across commercial, packaging, and publication printing.
  • The shift towards shorter runs and customized printing increases the frequency of setup changes, thereby elevating the reliance on densitometers for rapid, accurate color matching and waste reduction.
  • Ongoing industry emphasis on brand color integrity and sustainability, which requires precise ink usage, further solidifies densitometers as a cornerstone technology in this sector.
By End User
  • Commercial Printers
  • Packaging Converters
  • Publishing Houses
Packaging Converters represent a highly influential and growing end-user segment due to stringent quality demands and high-volume production.

  • The critical need for brand color consistency across global packaging runs for consumer goods, food, and beverages makes densitometer accuracy paramount for brand owners and converters alike.
  • Expansion of flexible packaging and the use of diverse substrates drive the need for advanced densitometers capable of measuring on films, foils, and specialty papers to ensure print quality and adhesion.
  • Rising regulatory and consumer focus on product information legibility and visual appeal directly ties print density control to compliance and shelf impact, fueling investment in measurement tools.
By Technology Integration
  • Traditional Standalone
  • Digital/Network-Connected
  • Portable Handheld
Digital/Network-Connected densitometers are emerging as the leading growth-oriented segment, aligning with Industry 4.0 trends.

  • Integration with cloud-based quality management systems allows for real-time data logging, traceability, and remote monitoring, which is increasingly valued for process optimization and audit trails.
  • This connectivity facilitates closed-loop control in advanced printing presses, where density measurements can automatically trigger ink adjustments, minimizing manual intervention and reducing waste.
  • The ability to seamlessly feed data into digital workflows supports a more analytical approach to print production, helping shops move from reactive correction to predictive quality assurance.
By Purchase Driver
  • Quality & Consistency Assurance
  • Process Efficiency & Waste Reduction
  • Compliance & Standardization
Process Efficiency & Waste Reduction has become a paramount purchase driver, surpassing basic quality checks as the primary rationale for investment.

  • In a competitive market with tight margins, printers prioritize densitometers that enable faster makeready times and minimize substrate and ink waste, offering a clear and calculable return on investment.
  • The capability to maintain consistent density throughout a long print run prevents costly mid-job adjustments and rejects, directly impacting operational profitability and sustainability metrics.
  • This driver is closely linked to technological integration, as smarter devices provide the actionable data needed to streamline the entire printing workflow and reduce material usage systematically.

Regional Analysis: Printing Densitometer Market

North America

North America is the established leader in the Printing Densitometer Market, driven by a highly advanced commercial printing industry, stringent quality control standards, and the early adoption of automation. The presence of major packaging and commercial print service providers in the United States and Canada creates consistent, sophisticated demand for high-precision color measurement tools. This region exhibits a strong preference for advanced digital and integrated densitometers that can interface seamlessly with modern press control systems, including CTP (Computer-to-Plate) workflows and cloud-based color management platforms. Regulatory requirements for branding consistency across major consumer goods and pharmaceutical packaging further compel investments in reliable densitometry equipment. The printing densitometer market here is characterized by a shift towards multi-functional instruments capable of measuring density, dot gain, and trapping, with vendors competing primarily on software integration, instrument longevity, and service support, rather than just hardware specifications.

Technology Leadership & Innovation
The North American printing densitometer market is defined by a high rate of technological refresh. Leading print houses prioritize densitometers with advanced connectivity, supporting integration into broader Industry 4.0 and smart factory environments. This drive for data-driven precision creates sustained demand for next-generation devices in the printing densitometer market segment.
Regulatory & Quality Compliance
Strict industry standards from organizations like G7 and ISO 12647 for color reproduction mandate reliable color measurement. This compliance environment makes the printing densitometer a non-negotiable tool for quality assurance, especially in packaging and label printing, securing its essential role in the regional printing workflow.
Service-Oriented Vendor Ecosystem
Market success is heavily dependent on post-sale support. Vendors in the North American printing densitometer market compete through comprehensive calibration services, technical training, and rapid repair cycles, catering to the high-uptime requirements of commercial print facilities with continuous production schedules.
Shift to Packaging & Labels
While commercial print remains steady, significant growth in the printing densitometer market is tied to the robust packaging sector. The need for perfect color matching across flexible packaging, corrugated boxes, and labels for consumer goods directly fuels demand for precise, durable benchtop and handheld densitometer models.

Europe
Europe represents a mature and highly sophisticated segment of Global printing densitometer market. The region’s emphasis on high-quality, short-run commercial printing, luxury packaging, and security printing applications sustains demand for premium color control instruments. Adoption is driven by a combination of historical craftsmanship in printing and modern environmental directives that require precise ink usage and waste reduction, where densitometers play a critical role in optimization. The Western European printing densitometer market, particularly in Germany, the UK, and Italy, is characterized by the integration of densitometry data with CIM (Computer Integrated Manufacturing) systems. In Eastern Europe, market growth is more incremental, focused on cost-effective yet reliable solutions as the printing industry modernizes, creating a two-tiered demand structure within the regional printing densitometer market landscape.

Asia-Pacific
The Asia-Pacific region is the fastest-growing area in the printing densitometer market, propelled by the massive expansion of its packaging, publishing, and commercial print industries. Rapid industrialization, rising consumerism, and export-oriented manufacturing in countries like China, India, Japan, and South Korea are key growth drivers. The regional market for printing densitometers is highly diverse, ranging from demand for basic, affordable models in emerging print shops to sophisticated, automated systems in large, export-focused packaging plants. Local manufacturers are increasingly prominent, offering competitive alternatives and influencing pricing dynamics. The growth of the printing densitometer market here is intrinsically linked to the overall expansion and technological upgrading of the regional printing sector, with increasing awareness of international quality standards pushing adoption beyond major metropolitan hubs into secondary industrial clusters.

South America
The printing densitometer market in South America is developing, with growth concentrated in key economies such as Brazil and Argentina. The market is primarily fueled by the domestic packaging industry and commercial printing sectors serving local consumer markets. Demand tends to focus on robust, mid-range densitometer solutions that offer a balance between accuracy, durability, and cost, as many printers navigate economic volatilities. The adoption curve in the South American printing densitometer market is gradual, with technology uptake often following regional economic stability. While not a primary innovation hub, the region presents steady opportunities for densitometer suppliers, particularly those offering strong local distribution and service networks to support the region’s evolving print quality requirements.

Middle East & Africa
The Middle East & Africa region represents a smaller yet emerging segment of Global printing densitometer market. Growth is sporadic and linked to specific industrial development projects, urbanization, and the expansion of consumer goods packaging in Gulf Cooperation Council (GCC) countries and parts of North Africa. The market is characterized by a high reliance on imports, with demand centered on reliable, user-friendly densitometers for basic print quality control in commercial and packaging applications. In the broader Middle East & Africa printing densitometer market, adoption is often driven by multinational corporations setting up local production facilities that bring standardized quality control practices, thereby introducing advanced densitometry tools to the regional supply chain.

Report Scope

This market research report provides a comprehensive analysis of the Printing Densitometer Market , covering the forecast period 2026–2034. It offers detailed insights into market dynamics, technological advancements, competitive landscape, and key trends shaping the industry.

Key focus areas of the report include:

  • Market Overview: The report begins with an overview outlining its current market scenario, key growth indicators, and industry transformation drivers. It discusses macroeconomic factors, demand–supply balance, regulatory landscape, and the strategic role of semiconductors in powering advancements across industries such as automotive, telecommunications, consumer electronics, and industrial automation.
  • Market Size & Forecast: Historical data and future projections for revenue, unit shipments, and market value across major regions and segments.
  • Segmentation Analysis: Detailed breakdown by product type, technology, application, and end-user industry to identify high-growth segments and investment opportunities.
  • Regional Insights: Insights into market performance across North America, Europe, Asia-Pacific, Latin America, and the Middle East & Africa, including country-level analysis where relevant.
  • Competitive Landscape: Profiles of leading market participants, including their product offerings, R&D focus, manufacturing capacity, pricing strategies, and recent developments such as mergers, acquisitions, and partnerships.
  • Technology Trends & Innovation: Assessment of emerging technologies, integration of AI/IoT, semiconductor design trends, fabrication techniques, and evolving industry standards.
  • Market Drivers & Restraints: Evaluation of factors driving market growth along with challenges, supply chain constraints, regulatory issues, and market-entry barriers.
  • Stakeholder Insights: Insights for component suppliers, OEMs, system integrators, investors, and policymakers regarding the evolving ecosystem and strategic opportunities.

Primary and secondary research methods are employed, including interviews with industry experts, data from verified sources, and real-time market intelligence to ensure the accuracy and reliability of the insights presented.

FREQUENTLY ASKED QUESTIONS:

What is the current market size of Printing Densitometer Market?

-> Global Printing Densitometer Market was valued at USD 107 million in 2025 and is projected to reach USD 153 million by 2034, at a CAGR of 4.5%.

Which key companies operate in Printing Densitometer Market?

-> Key players include X-Rite, Techkon, Konica Minolta, Tobias Associates, GWJ Company, FAG, 3nh, among others.

What are the key growth drivers?

-> Key growth drivers include the demand for high-quality, consistent print reproduction, stringent color management requirements in the printing industry, and the need for process control and quality assurance across applications.

Which region dominates the market?

-> The report provides detailed regional analysis covering North America, Europe, Asia, South America, and the Middle East & Africa, with specific focus on key countries like the U.S., China, Germany, and Japan.

What are the emerging trends?

-> Emerging trends include technological advancements in densitometer precision and integration with digital color management systems, alongside growing adoption in diverse industries beyond traditional printing, such as textiles and plastics.

Printing Densitometer Market, Trends, Business Strategies 2026-2034

Get Sample Report PDF for Exclusive Insights

Report Sample Includes

  • Table of Contents
  • List of Tables & Figures
  • Charts, Research Methodology, and more...
PDF Icon Download Sample Report PDF
SKU: 1d73ac81b9dc
Category:
License Type

Corporate License, Excel License, PDF and Excel Databook License

Download Sample Report

Table of Content

1 Introduction to Research & Analysis Reports
1.1 Printing Densitometer Market Definition
1.2 Market Segments
1.2.1 Segment by Type
1.2.2 Segment by Application
1.3 Global Printing Densitometer Market Overview
1.4 Features & Benefits of This Report
1.5 Methodology & Sources of Information
1.5.1 Research Methodology
1.5.2 Research Process
1.5.3 Base Year
1.5.4 Report Assumptions & Caveats
2 Global Printing Densitometer Overall Market Size
2.1 Global Printing Densitometer Market Size: 2025 VS 2034
2.2 Global Printing Densitometer Market Size, Prospects & Forecasts: 2020-2034
2.3 Global Printing Densitometer Sales: 2020-2034
3 Company Landscape
3.1 Top Printing Densitometer Players in Global Market
3.2 Top Global Printing Densitometer Companies Ranked by Revenue
3.3 Global Printing Densitometer Revenue by Companies
3.4 Global Printing Densitometer Sales by Companies
3.5 Global Printing Densitometer Price by Manufacturer (2020-2026)
3.6 Top 3 and Top 5 Printing Densitometer Companies in Global Market, by Revenue in 2025
3.7 Global Manufacturers Printing Densitometer Product Type
3.8 Tier 1, Tier 2, and Tier 3 Printing Densitometer Players in Global Market
3.8.1 List of Global Tier 1 Printing Densitometer Companies
3.8.2 List of Global Tier 2 and Tier 3 Printing Densitometer Companies
4 Sights by Product
4.1 Overview
4.1.1 Segment by Type – Global Printing Densitometer Market Size Markets, 2025 & 2034
4.1.2 Reflection Densitometer
4.1.3 Transmission Densitometer
4.2 Segment by Type – Global Printing Densitometer Revenue & Forecasts
4.2.1 Segment by Type – Global Printing Densitometer Revenue, 2020-2026
4.2.2 Segment by Type – Global Printing Densitometer Revenue, 2026-2034
4.2.3 Segment by Type – Global Printing Densitometer Revenue Market Share, 2020-2034
4.3 Segment by Type – Global Printing Densitometer Sales & Forecasts
4.3.1 Segment by Type – Global Printing Densitometer Sales, 2020-2026
4.3.2 Segment by Type – Global Printing Densitometer Sales, 2026-2034
4.3.3 Segment by Type – Global Printing Densitometer Sales Market Share, 2020-2034
4.4 Segment by Type – Global Printing Densitometer Price (Manufacturers Selling Prices), 2020-2034
5 Sights by Application
5.1 Overview
5.1.1 Segment by Application – Global Printing Densitometer Market Size, 2025 & 2034
5.1.2 Printing Industry
5.1.3 Textile Industry
5.1.4 Plastic Industry
5.1.5 Others
5.2 Segment by Application – Global Printing Densitometer Revenue & Forecasts
5.2.1 Segment by Application – Global Printing Densitometer Revenue, 2020-2026
5.2.2 Segment by Application – Global Printing Densitometer Revenue, 2026-2034
5.2.3 Segment by Application – Global Printing Densitometer Revenue Market Share, 2020-2034
5.3 Segment by Application – Global Printing Densitometer Sales & Forecasts
5.3.1 Segment by Application – Global Printing Densitometer Sales, 2020-2026
5.3.2 Segment by Application – Global Printing Densitometer Sales, 2026-2034
5.3.3 Segment by Application – Global Printing Densitometer Sales Market Share, 2020-2034
5.4 Segment by Application – Global Printing Densitometer Price (Manufacturers Selling Prices), 2020-2034
6 Sights by Region
6.1 By Region – Global Printing Densitometer Market Size, 2025 & 2034
6.2 By Region – Global Printing Densitometer Revenue & Forecasts
6.2.1 By Region – Global Printing Densitometer Revenue, 2020-2026
6.2.2 By Region – Global Printing Densitometer Revenue, 2026-2034
6.2.3 By Region – Global Printing Densitometer Revenue Market Share, 2020-2034
6.3 By Region – Global Printing Densitometer Sales & Forecasts
6.3.1 By Region – Global Printing Densitometer Sales, 2020-2026
6.3.2 By Region – Global Printing Densitometer Sales, 2026-2034
6.3.3 By Region – Global Printing Densitometer Sales Market Share, 2020-2034
6.4 North America
6.4.1 By Country – North America Printing Densitometer Revenue, 2020-2034
6.4.2 By Country – North America Printing Densitometer Sales, 2020-2034
6.4.3 United States Printing Densitometer Market Size, 2020-2034
6.4.4 Canada Printing Densitometer Market Size, 2020-2034
6.4.5 Mexico Printing Densitometer Market Size, 2020-2034
6.5 Europe
6.5.1 By Country – Europe Printing Densitometer Revenue, 2020-2034
6.5.2 By Country – Europe Printing Densitometer Sales, 2020-2034
6.5.3 Germany Printing Densitometer Market Size, 2020-2034
6.5.4 France Printing Densitometer Market Size, 2020-2034
6.5.5 U.K. Printing Densitometer Market Size, 2020-2034
6.5.6 Italy Printing Densitometer Market Size, 2020-2034
6.5.7 Russia Printing Densitometer Market Size, 2020-2034
6.5.8 Nordic Countries Printing Densitometer Market Size, 2020-2034
6.5.9 Benelux Printing Densitometer Market Size, 2020-2034
6.6 Asia
6.6.1 By Region – Asia Printing Densitometer Revenue, 2020-2034
6.6.2 By Region – Asia Printing Densitometer Sales, 2020-2034
6.6.3 China Printing Densitometer Market Size, 2020-2034
6.6.4 Japan Printing Densitometer Market Size, 2020-2034
6.6.5 South Korea Printing Densitometer Market Size, 2020-2034
6.6.6 Southeast Asia Printing Densitometer Market Size, 2020-2034
6.6.7 India Printing Densitometer Market Size, 2020-2034
6.7 South America
6.7.1 By Country – South America Printing Densitometer Revenue, 2020-2034
6.7.2 By Country – South America Printing Densitometer Sales, 2020-2034
6.7.3 Brazil Printing Densitometer Market Size, 2020-2034
6.7.4 Argentina Printing Densitometer Market Size, 2020-2034
6.8 Middle East & Africa
6.8.1 By Country – Middle East & Africa Printing Densitometer Revenue, 2020-2034
6.8.2 By Country – Middle East & Africa Printing Densitometer Sales, 2020-2034
6.8.3 Turkey Printing Densitometer Market Size, 2020-2034
6.8.4 Israel Printing Densitometer Market Size, 2020-2034
6.8.5 Saudi Arabia Printing Densitometer Market Size, 2020-2034
6.8.6 UAE Printing Densitometer Market Size, 2020-2034
7 Manufacturers & Brands Profiles
7.1 X-Rite
7.1.1 X-Rite Company Summary
7.1.2 X-Rite Business Overview
7.1.3 X-Rite Printing Densitometer Major Product Offerings
7.1.4 X-Rite Printing Densitometer Sales and Revenue in Global (2020-2026)
7.1.5 X-Rite Key News & Latest Developments
7.2 Techkon
7.2.1 Techkon Company Summary
7.2.2 Techkon Business Overview
7.2.3 Techkon Printing Densitometer Major Product Offerings
7.2.4 Techkon Printing Densitometer Sales and Revenue in Global (2020-2026)
7.2.5 Techkon Key News & Latest Developments
7.3 Konica Minolta
7.3.1 Konica Minolta Company Summary
7.3.2 Konica Minolta Business Overview
7.3.3 Konica Minolta Printing Densitometer Major Product Offerings
7.3.4 Konica Minolta Printing Densitometer Sales and Revenue in Global (2020-2026)
7.3.5 Konica Minolta Key News & Latest Developments
7.4 Tobias Associates
7.4.1 Tobias Associates Company Summary
7.4.2 Tobias Associates Business Overview
7.4.3 Tobias Associates Printing Densitometer Major Product Offerings
7.4.4 Tobias Associates Printing Densitometer Sales and Revenue in Global (2020-2026)
7.4.5 Tobias Associates Key News & Latest Developments
7.5 GWJ Company
7.5.1 GWJ Company Company Summary
7.5.2 GWJ Company Business Overview
7.5.3 GWJ Company Printing Densitometer Major Product Offerings
7.5.4 GWJ Company Printing Densitometer Sales and Revenue in Global (2020-2026)
7.5.5 GWJ Company Key News & Latest Developments
7.6 FAG
7.6.1 FAG Company Summary
7.6.2 FAG Business Overview
7.6.3 FAG Printing Densitometer Major Product Offerings
7.6.4 FAG Printing Densitometer Sales and Revenue in Global (2020-2026)
7.6.5 FAG Key News & Latest Developments
7.7 3nh
7.7.1 3nh Company Summary
7.7.2 3nh Business Overview
7.7.3 3nh Printing Densitometer Major Product Offerings
7.7.4 3nh Printing Densitometer Sales and Revenue in Global (2020-2026)
7.7.5 3nh Key News & Latest Developments
8 Global Printing Densitometer Production Capacity, Analysis
8.1 Global Printing Densitometer Production Capacity, 2020-2034
8.2 Printing Densitometer Production Capacity of Key Manufacturers in Global Market
8.3 Global Printing Densitometer Production by Region
9 Key Market Trends, Opportunity, Drivers and Restraints
9.1 Market Opportunities & Trends
9.2 Market Drivers
9.3 Market Restraints
10 Printing Densitometer Supply Chain Analysis
10.1 Printing Densitometer Industry Value Chain
10.2 Printing Densitometer Upstream Market
10.3 Printing Densitometer Downstream and Clients
10.4 Marketing Channels Analysis
10.4.1 Marketing Channels
10.4.2 Printing Densitometer Distributors and Sales Agents in Global
11 Conclusion
12 Appendix
12.1 Note
12.2 Examples of Clients
12.3 DisclaimerList of Tables
Table 1. Key Players of Printing Densitometer in Global Market
Table 2. Top Printing Densitometer Players in Global Market, Ranking by Revenue (2025)
Table 3. Global Printing Densitometer Revenue by Companies, (US$, Mn), 2020-2026
Table 4. Global Printing Densitometer Revenue Share by Companies, 2020-2026
Table 5. Global Printing Densitometer Sales by Companies, (K Units), 2020-2026
Table 6. Global Printing Densitometer Sales Share by Companies, 2020-2026
Table 7. Key Manufacturers Printing Densitometer Price (2020-2026) & (US$/Unit)
Table 8. Global Manufacturers Printing Densitometer Product Type
Table 9. List of Global Tier 1 Printing Densitometer Companies, Revenue (US$, Mn) in 2025 and Market Share
Table 10. List of Global Tier 2 and Tier 3 Printing Densitometer Companies, Revenue (US$, Mn) in 2025 and Market Share
Table 11. Segment by Type – Global Printing Densitometer Revenue, (US$, Mn), 2025 & 2034
Table 12. Segment by Type – Global Printing Densitometer Revenue (US$, Mn), 2020-2026
Table 13. Segment by Type – Global Printing Densitometer Revenue (US$, Mn), 2026-2034
Table 14. Segment by Type – Global Printing Densitometer Sales (K Units), 2020-2026
Table 15. Segment by Type – Global Printing Densitometer Sales (K Units), 2026-2034
Table 16. Segment by Application – Global Printing Densitometer Revenue, (US$, Mn), 2025 & 2034
Table 17. Segment by Application – Global Printing Densitometer Revenue, (US$, Mn), 2020-2026
Table 18. Segment by Application – Global Printing Densitometer Revenue, (US$, Mn), 2026-2034
Table 19. Segment by Application – Global Printing Densitometer Sales, (K Units), 2020-2026
Table 20. Segment by Application – Global Printing Densitometer Sales, (K Units), 2026-2034
Table 21. By Region – Global Printing Densitometer Revenue, (US$, Mn), 2026-2034
Table 22. By Region – Global Printing Densitometer Revenue, (US$, Mn), 2020-2026
Table 23. By Region – Global Printing Densitometer Revenue, (US$, Mn), 2026-2034
Table 24. By Region – Global Printing Densitometer Sales, (K Units), 2020-2026
Table 25. By Region – Global Printing Densitometer Sales, (K Units), 2026-2034
Table 26. By Country – North America Printing Densitometer Revenue, (US$, Mn), 2020-2026
Table 27. By Country – North America Printing Densitometer Revenue, (US$, Mn), 2026-2034
Table 28. By Country – North America Printing Densitometer Sales, (K Units), 2020-2026
Table 29. By Country – North America Printing Densitometer Sales, (K Units), 2026-2034
Table 30. By Country – Europe Printing Densitometer Revenue, (US$, Mn), 2020-2026
Table 31. By Country – Europe Printing Densitometer Revenue, (US$, Mn), 2026-2034
Table 32. By Country – Europe Printing Densitometer Sales, (K Units), 2020-2026
Table 33. By Country – Europe Printing Densitometer Sales, (K Units), 2026-2034
Table 34. By Region – Asia Printing Densitometer Revenue, (US$, Mn), 2020-2026
Table 35. By Region – Asia Printing Densitometer Revenue, (US$, Mn), 2026-2034
Table 36. By Region – Asia Printing Densitometer Sales, (K Units), 2020-2026
Table 37. By Region – Asia Printing Densitometer Sales, (K Units), 2026-2034
Table 38. By Country – South America Printing Densitometer Revenue, (US$, Mn), 2020-2026
Table 39. By Country – South America Printing Densitometer Revenue, (US$, Mn), 2026-2034
Table 40. By Country – South America Printing Densitometer Sales, (K Units), 2020-2026
Table 41. By Country – South America Printing Densitometer Sales, (K Units), 2026-2034
Table 42. By Country – Middle East & Africa Printing Densitometer Revenue, (US$, Mn), 2020-2026
Table 43. By Country – Middle East & Africa Printing Densitometer Revenue, (US$, Mn), 2026-2034
Table 44. By Country – Middle East & Africa Printing Densitometer Sales, (K Units), 2020-2026
Table 45. By Country – Middle East & Africa Printing Densitometer Sales, (K Units), 2026-2034
Table 46. X-Rite Company Summary
Table 47. X-Rite Printing Densitometer Product Offerings
Table 48. X-Rite Printing Densitometer Sales (K Units), Revenue (US$, Mn) and Average Price (US$/Unit) & (2020-2026)
Table 49. X-Rite Key News & Latest Developments
Table 50. Techkon Company Summary
Table 51. Techkon Printing Densitometer Product Offerings
Table 52. Techkon Printing Densitometer Sales (K Units), Revenue (US$, Mn) and Average Price (US$/Unit) & (2020-2026)
Table 53. Techkon Key News & Latest Developments
Table 54. Konica Minolta Company Summary
Table 55. Konica Minolta Printing Densitometer Product Offerings
Table 56. Konica Minolta Printing Densitometer Sales (K Units), Revenue (US$, Mn) and Average Price (US$/Unit) & (2020-2026)
Table 57. Konica Minolta Key News & Latest Developments
Table 58. Tobias Associates Company Summary
Table 59. Tobias Associates Printing Densitometer Product Offerings
Table 60. Tobias Associates Printing Densitometer Sales (K Units), Revenue (US$, Mn) and Average Price (US$/Unit) & (2020-2026)
Table 61. Tobias Associates Key News & Latest Developments
Table 62. GWJ Company Company Summary
Table 63. GWJ Company Printing Densitometer Product Offerings
Table 64. GWJ Company Printing Densitometer Sales (K Units), Revenue (US$, Mn) and Average Price (US$/Unit) & (2020-2026)
Table 65. GWJ Company Key News & Latest Developments
Table 66. FAG Company Summary
Table 67. FAG Printing Densitometer Product Offerings
Table 68. FAG Printing Densitometer Sales (K Units), Revenue (US$, Mn) and Average Price (US$/Unit) & (2020-2026)
Table 69. FAG Key News & Latest Developments
Table 70. 3nh Company Summary
Table 71. 3nh Printing Densitometer Product Offerings
Table 72. 3nh Printing Densitometer Sales (K Units), Revenue (US$, Mn) and Average Price (US$/Unit) & (2020-2026)
Table 73. 3nh Key News & Latest Developments
Table 74. Printing Densitometer Capacity of Key Manufacturers in Global Market, 2023-2026 (K Units)
Table 75. Global Printing Densitometer Capacity Market Share of Key Manufacturers, 2023-2026
Table 76. Global Printing Densitometer Production by Region, 2020-2026 (K Units)
Table 77. Global Printing Densitometer Production by Region, 2026-2034 (K Units)
Table 78. Printing Densitometer Market Opportunities & Trends in Global Market
Table 79. Printing Densitometer Market Drivers in Global Market
Table 80. Printing Densitometer Market Restraints in Global Market
Table 81. Printing Densitometer Raw Materials
Table 82. Printing Densitometer Raw Materials Suppliers in Global Market
Table 83. Typical Printing Densitometer Downstream
Table 84. Printing Densitometer Downstream Clients in Global Market
Table 85. Printing Densitometer Distributors and Sales Agents in Global Market

List of Figures
Figure 1. Printing Densitometer Product Picture
Figure 2. Printing Densitometer Segment by Type in 2025
Figure 3. Printing Densitometer Segment by Application in 2025
Figure 4. Global Printing Densitometer Market Overview: 2025
Figure 5. Key Caveats
Figure 6. Global Printing Densitometer Market Size: 2025 VS 2034 (US$, Mn)
Figure 7. Global Printing Densitometer Revenue: 2020-2034 (US$, Mn)
Figure 8. Printing Densitometer Sales in Global Market: 2020-2034 (K Units)
Figure 9. The Top 3 and 5 Players Market Share by Printing Densitometer Revenue in 2025
Figure 10. Segment by Type – Global Printing Densitometer Revenue, (US$, Mn), 2025 & 2034
Figure 11. Segment by Type – Global Printing Densitometer Revenue Market Share, 2020-2034
Figure 12. Segment by Type – Global Printing Densitometer Sales Market Share, 2020-2034
Figure 13. Segment by Type – Global Printing Densitometer Price (US$/Unit), 2020-2034
Figure 14. Segment by Application – Global Printing Densitometer Revenue, (US$, Mn), 2025 & 2034
Figure 15. Segment by Application – Global Printing Densitometer Revenue Market Share, 2020-2034
Figure 16. Segment by Application – Global Printing Densitometer Sales Market Share, 2020-2034
Figure 17. Segment by Application -Global Printing Densitometer Price (US$/Unit), 2020-2034
Figure 18. By Region – Global Printing Densitometer Revenue, (US$, Mn), 2026 & 2034
Figure 19. By Region – Global Printing Densitometer Revenue Market Share, 2020 VS 2025 VS 2034
Figure 20. By Region – Global Printing Densitometer Revenue Market Share, 2020-2034
Figure 21. By Region – Global Printing Densitometer Sales Market Share, 2020-2034
Figure 22. By Country – North America Printing Densitometer Revenue Market Share, 2020-2034
Figure 23. By Country – North America Printing Densitometer Sales Market Share, 2020-2034
Figure 24. United States Printing Densitometer Revenue, (US$, Mn), 2020-2034
Figure 25. Canada Printing Densitometer Revenue, (US$, Mn), 2020-2034
Figure 26. Mexico Printing Densitometer Revenue, (US$, Mn), 2020-2034
Figure 27. By Country – Europe Printing Densitometer Revenue Market Share, 2020-2034
Figure 28. By Country – Europe Printing Densitometer Sales Market Share, 2020-2034
Figure 29. Germany Printing Densitometer Revenue, (US$, Mn), 2020-2034
Figure 30. France Printing Densitometer Revenue, (US$, Mn), 2020-2034
Figure 31. U.K. Printing Densitometer Revenue, (US$, Mn), 2020-2034
Figure 32. Italy Printing Densitometer Revenue, (US$, Mn), 2020-2034
Figure 33. Russia Printing Densitometer Revenue, (US$, Mn), 2020-2034
Figure 34. Nordic Countries Printing Densitometer Revenue, (US$, Mn), 2020-2034
Figure 35. Benelux Printing Densitometer Revenue, (US$, Mn), 2020-2034
Figure 36. By Region – Asia Printing Densitometer Revenue Market Share, 2020-2034
Figure 37. By Region – Asia Printing Densitometer Sales Market Share, 2020-2034
Figure 38. China Printing Densitometer Revenue, (US$, Mn), 2020-2034
Figure 39. Japan Printing Densitometer Revenue, (US$, Mn), 2020-2034
Figure 40. South Korea Printing Densitometer Revenue, (US$, Mn), 2020-2034
Figure 41. Southeast Asia Printing Densitometer Revenue, (US$, Mn), 2020-2034
Figure 42. India Printing Densitometer Revenue, (US$, Mn), 2020-2034
Figure 43. By Country – South America Printing Densitometer Revenue Market Share, 2020-2034
Figure 44. By Country – South America Printing Densitometer Sales, Market Share, 2020-2034
Figure 45. Brazil Printing Densitometer Revenue, (US$, Mn), 2020-2034
Figure 46. Argentina Printing Densitometer Revenue, (US$, Mn), 2020-2034
Figure 47. By Country – Middle East & Africa Printing Densitometer Revenue, Market Share, 2020-2034
Figure 48. By Country – Middle East & Africa Printing Densitometer Sales, Market Share, 2020-2034
Figure 49. Turkey Printing Densitometer Revenue, (US$, Mn), 2020-2034
Figure 50. Israel Printing Densitometer Revenue, (US$, Mn), 2020-2034
Figure 51. Saudi Arabia Printing Densitometer Revenue, (US$, Mn), 2020-2034
Figure 52. UAE Printing Densitometer Revenue, (US$, Mn), 2020-2034
Figure 53. Global Printing Densitometer Production Capacity (K Units), 2020-2034
Figure 54. The Percentage of Production Printing Densitometer by Region, 2025 VS 2034
Figure 55. Printing Densitometer Industry Value Chain
Figure 56. Marketing Channels