Global Printed Circuit Board (PCB) E-scrap Recycling Market Trends ,Business Strategies 2025-2032

Global Printed Circuit Board (PCB) E-scrap Recycling market size was estimated at USD 605 million in 2023 and is projected to reach USD 1159.93 million by 2032, exhibiting a CAGR of 7.50% during the forecast period.

PDF Icon Download Sample Report PDF
  • Quick Dispatch

    All Orders

  • Secure Payment

    100% Secure Payment

Compare

$1,500.00$4,250.00

Clear

Printed Circuit Board (PCB) E-scrap Recycling Market Overview

EEE includes a wide range of products with circuity or electrical components with a power or battery supply. Almost any household or business use products like basic kitchen appliances, toys, tools to music, and ICT items, such as mobile phones, laptops, etc. EEE becomes e-waste once it has been discarded by its owner as waste without the intent of reuse. Each product has different material content, is disposed of and recycled in different ways, and is unequally harmful to the environment and human health if not managed in an environmentally sound manner. Printed circuit board is an electronic circuit used in electronic devices to provide mechanical support. PCB mechanically supports and electrically converts electronic components using conductive pathways, tracks, or signal traces etched from copper sheets laminated onto a non-conductive substrate. They are generally made of metal circuits, chips, ICs, sockets, cables, and plastic laminates. These are the elementary component for most of the electronics in the present scenario. PCBs are present in almost all electronic devices we use on a daily basis which include computers, TVs, smartphones, washing machines, coffee makers, ovens and refrigerators etc. E-waste recycling industry refers to the work or business contains the collecting, transporting, re-using or processing of e-waste. In this report, we will have an oversight of the current situation and development trend of PCB e-scrap recycling industry worldwide.

This report provides a deep insight into the global Printed Circuit Board (PCB) E-scrap Recycling market covering all its essential aspects. This ranges from a macro overview of the market to micro details of the market size, competitive landscape, development trend, niche market, key market drivers and challenges, SWOT analysis, value chain analysis, etc.

The analysis helps the reader to shape the competition within the industries and strategies for the competitive environment to enhance the potential profit. Furthermore, it provides a simple framework for evaluating and accessing the position of the business organization. The report structure also focuses on the competitive landscape of the Global Printed Circuit Board (PCB) E-scrap Recycling Market, this report introduces in detail the market share, market performance, product situation, operation situation, etc. of the main players, which helps the readers in the industry to identify the main competitors and deeply understand the competition pattern of the market.
In a word, this report is a must-read for industry players, investors, researchers, consultants, business strategists, and all those who have any kind of stake or are planning to foray into the Printed Circuit Board (PCB) E-scrap Recycling market in any manner.

Printed Circuit Board (PCB) E-scrap Recycling Market Analysis:

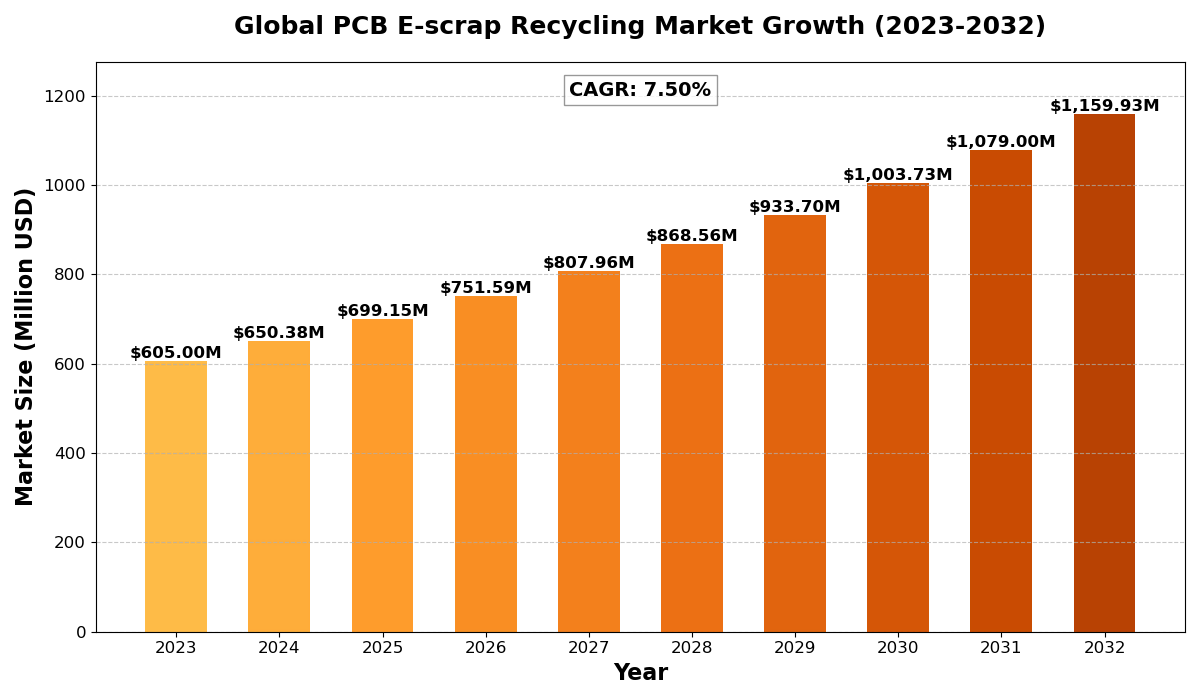
The global Printed Circuit Board (PCB) E-scrap Recycling market size was estimated at USD 605 million in 2023 and is projected to reach USD 1159.93 million by 2032, exhibiting a CAGR of 7.50% during the forecast period.

North America Printed Circuit Board (PCB) E-scrap Recycling market size was estimated at USD 178.57 million in 2023, at a CAGR of 6.43% during the forecast period of 2025 through 2032.

Printed Circuit Board (PCB) E-scrap Recycling Key Market Trends  

  1. Rising E-waste Generation
    The surge in electronic device usage has led to an increase in e-waste, boosting the need for efficient PCB recycling.
  2. Advancements in Recycling Technologies
    New methods, such as hydrometallurgical and biometallurgical processes, are improving metal recovery rates from PCBs.
  3. Strict Environmental Regulations
    Governments worldwide are enforcing regulations to manage e-waste responsibly, driving the recycling market.
  4. Increased Precious Metal Recovery
    The high value of metals like gold, silver, and palladium in PCBs is encouraging more recycling efforts.
  5. Growing Circular Economy Initiatives
    Emphasis on sustainability and resource efficiency is promoting PCB recycling as part of the circular economy

Printed Circuit Board (PCB) E-scrap Recycling Market Regional Analysis :

semi insight

  • North America:Strong demand driven by EVs, 5G infrastructure, and renewable energy, with the U.S. leading the market.
  • Europe:Growth fueled by automotive electrification, renewable energy, and strong regulatory support, with Germany as a key player.
  • Asia-Pacific:Dominates the market due to large-scale manufacturing in China and Japan, with growing demand from EVs, 5G, and semiconductors.
  • South America:Emerging market, driven by renewable energy and EV adoption, with Brazil leading growth.
  • Middle East & Africa:Gradual growth, mainly due to investments in renewable energy and EV infrastructure, with Saudi Arabia and UAE as key contributors.

Printed Circuit Board (PCB) E-scrap Recycling Market Segmentation

The research report includes specific segments by region (country), manufacturers, Type, and Application. Market segmentation creates subsets of a market based on product type, end-user or application, Geographic, and other factors. By understanding the market segments, the decision-maker can leverage this targeting in the product, sales, and marketing strategies. Market segments can power your product development cycles by informing how you create product offerings for different segments.
Key Company

  • Boliden
  • Umicore
  • Aurubis
  • Mitsubishi Materials Corporation
  • Glencore(Canada)
  • LS-Nikko Copper
  • Dowa Holdings
  • JX Nippon Mining & Metals
  • Korea Zinc
  • Asahi Holdings
  • Mitsui Mining & Smelting
  • UWin Nanotech. Co. Ltd.
  • SingWay Technology Co.,Ltd.
  • Solar Applied Materials
  • Jiin Yeeh Ding
  • WASTE Recovery Technology

Market Segmentation (by Type)

  • Precious Metal
  • Copper
  • Others

Market Segmentation (by Application)

  • Smartphones
  • PC & Laptop
  • Telecommunications
  • TV & Monitor
  • Others

Drivers

  • Growing E-waste Volume
    The exponential rise in discarded electronics fuels demand for effective PCB recycling solutions.
  • High Value of Recovered Materials
    Recovering precious and rare metals from PCBs offers significant economic incentives.
  • Government Regulations and Incentives
    Policies aimed at reducing e-waste and promoting recycling are driving market growth.

Restraints

  • Complexity of Recycling Processes
    Recycling PCBs involves complex processes that require specialized equipment and expertise.
  • High Initial Investment Costs
    Setting up advanced recycling facilities demands substantial capital, limiting market entry.
  • Environmental and Health Risks
    Improper recycling methods can release toxic substances, posing environmental and health risks.

Opportunities

  • Technological Innovations in Recycling
    Development of more efficient and eco-friendly recycling technologies presents growth opportunities.
  • Expansion in Emerging Markets
    Increasing e-waste in developing regions offers new market opportunities for recycling services.
  • Partnerships and Collaborations
    Strategic alliances between recycling firms and electronics manufacturers can boost market growth.

Challenges

  • Handling Hazardous Materials
    Safely managing toxic components in PCBs remains a significant challenge.
  • Regulatory Compliance
    Adhering to diverse regulations across regions adds complexity to recycling operations.
  • Lack of Consumer Awareness
    Limited public knowledge about proper e-waste disposal hinders recycling efforts.

Key Benefits of This Market Research:

  • Industry drivers, restraints, and opportunities covered in the study
  • Neutral perspective on the market performance
  • Recent industry trends and developments
  • Competitive landscape & strategies of key players
  • Potential & niche segments and regions exhibiting promising growth covered
  • Historical, current, and projected market size, in terms of value
  • In-depth analysis of the Printed Circuit Board (PCB) E-scrap Recycling Market
  • Overview of the regional outlook of the Printed Circuit Board (PCB) E-scrap Recycling Market:

Key Reasons to Buy this Report:

  • Access to date statistics compiled by our researchers. These provide you with historical and forecast data, which is analyzed to tell you why your market is set to change
  • This enables you to anticipate market changes to remain ahead of your competitors
  • You will be able to copy data from the Excel spreadsheet straight into your marketing plans, business presentations, or other strategic documents
  • The concise analysis, clear graph, and table format will enable you to pinpoint the information you require quickly
  • Provision of market value data for each segment and sub-segment
  • Indicates the region and segment that is expected to witness the fastest growth as well as to dominate the market
  • Provides insight into the market through Value Chain
  • Market dynamics scenario, along with growth opportunities of the market in the years to come
  • 6-month post-sales analyst support

Customization of the Report
In case of any queries or customization requirements, please connect with our sales team, who will ensure that your requirements are met.

FAQs

Q: What are the key driving factors and opportunities in the global PCB e-scrap recycling market?
A: Key drivers include the growing volume of e-waste, high value of recovered materials, and supportive government regulations. Opportunities lie in technological innovations, emerging markets, and strategic partnerships.


Q: Which region is projected to have the largest market share?
A: Asia-Pacific is expected to dominate the market due to its large electronics manufacturing base and increasing e-waste generation.


Q: Who are the top players in the global PCB e-scrap recycling market?
A: Leading companies include Umicore, Boliden Group, Dowa Holdings Co., Ltd., Aurubis AG, and Sims Metal Management.


Q: What are the latest technological advancements in the industry?
A: Innovations include advanced hydrometallurgical processes, environmentally friendly biometallurgical methods, and automated sorting technologies.


Q: What is the current size of the global PCB e-scrap recycling market?
A: The market was valued at approximately USD 2.5 billion in 2023 and is projected to grow at a CAGR of 8.1% from 2025 to 2032.


Global  Printed Circuit Board (PCB) E-scrap Recycling Market Trends ,Business Strategies 2025-2032

Get Sample Report PDF for Exclusive Insights

Report Sample Includes

  • Table of Contents
  • List of Tables & Figures
  • Charts, Research Methodology, and more...
PDF Icon Download Sample Report PDF

Download Sample Report

Table of Content

Table of Contents
1 Research Methodology and Statistical Scope
1.1 Market Definition and Statistical Scope of Printed Circuit Board (PCB) E-scrap Recycling
1.2 Key Market Segments
1.2.1 Printed Circuit Board (PCB) E-scrap Recycling Segment by Type
1.2.2 Printed Circuit Board (PCB) E-scrap Recycling Segment by Application
1.3 Methodology & Sources of Information
1.3.1 Research Methodology
1.3.2 Research Process
1.3.3 Market Breakdown and Data Triangulation
1.3.4 Base Year
1.3.5 Report Assumptions & Caveats
2 Printed Circuit Board (PCB) E-scrap Recycling Market Overview
2.1 Global Market Overview
2.1.1 Global Printed Circuit Board (PCB) E-scrap Recycling Market Size (M USD) Estimates and Forecasts (2019-2032)
2.1.2 Global Printed Circuit Board (PCB) E-scrap Recycling Sales Estimates and Forecasts (2019-2032)
2.2 Market Segment Executive Summary
2.3 Global Market Size by Region
3 Printed Circuit Board (PCB) E-scrap Recycling Market Competitive Landscape
3.1 Global Printed Circuit Board (PCB) E-scrap Recycling Sales by Manufacturers (2019-2025)
3.2 Global Printed Circuit Board (PCB) E-scrap Recycling Revenue Market Share by Manufacturers (2019-2025)
3.3 Printed Circuit Board (PCB) E-scrap Recycling Market Share by Company Type (Tier 1, Tier 2, and Tier 3)
3.4 Global Printed Circuit Board (PCB) E-scrap Recycling Average Price by Manufacturers (2019-2025)
3.5 Manufacturers Printed Circuit Board (PCB) E-scrap Recycling Sales Sites, Area Served, Product Type
3.6 Printed Circuit Board (PCB) E-scrap Recycling Market Competitive Situation and Trends
3.6.1 Printed Circuit Board (PCB) E-scrap Recycling Market Concentration Rate
3.6.2 Global 5 and 10 Largest Printed Circuit Board (PCB) E-scrap Recycling Players Market Share by Revenue
3.6.3 Mergers & Acquisitions, Expansion
4 Printed Circuit Board (PCB) E-scrap Recycling Industry Chain Analysis
4.1 Printed Circuit Board (PCB) E-scrap Recycling Industry Chain Analysis
4.2 Market Overview of Key Raw Materials
4.3 Midstream Market Analysis
4.4 Downstream Customer Analysis
5 The Development and Dynamics of Printed Circuit Board (PCB) E-scrap Recycling Market
5.1 Key Development Trends
5.2 Driving Factors
5.3 Market Challenges
5.4 Market Restraints
5.5 Industry News
5.5.1 New Product Developments
5.5.2 Mergers & Acquisitions
5.5.3 Expansions
5.5.4 Collaboration/Supply Contracts
5.6 Industry Policies
6 Printed Circuit Board (PCB) E-scrap Recycling Market Segmentation by Type
6.1 Evaluation Matrix of Segment Market Development Potential (Type)
6.2 Global Printed Circuit Board (PCB) E-scrap Recycling Sales Market Share by Type (2019-2025)
6.3 Global Printed Circuit Board (PCB) E-scrap Recycling Market Size Market Share by Type (2019-2025)
6.4 Global Printed Circuit Board (PCB) E-scrap Recycling Price by Type (2019-2025)
7 Printed Circuit Board (PCB) E-scrap Recycling Market Segmentation by Application
7.1 Evaluation Matrix of Segment Market Development Potential (Application)
7.2 Global Printed Circuit Board (PCB) E-scrap Recycling Market Sales by Application (2019-2025)
7.3 Global Printed Circuit Board (PCB) E-scrap Recycling Market Size (M USD) by Application (2019-2025)
7.4 Global Printed Circuit Board (PCB) E-scrap Recycling Sales Growth Rate by Application (2019-2025)
8 Printed Circuit Board (PCB) E-scrap Recycling Market Consumption by Region
8.1 Global Printed Circuit Board (PCB) E-scrap Recycling Sales by Region
8.1.1 Global Printed Circuit Board (PCB) E-scrap Recycling Sales by Region
8.1.2 Global Printed Circuit Board (PCB) E-scrap Recycling Sales Market Share by Region
8.2 North America
8.2.1 North America Printed Circuit Board (PCB) E-scrap Recycling Sales by Country
8.2.2 U.S.
8.2.3 Canada
8.2.4 Mexico
8.3 Europe
8.3.1 Europe Printed Circuit Board (PCB) E-scrap Recycling Sales by Country
8.3.2 Germany
8.3.3 France
8.3.4 U.K.
8.3.5 Italy
8.3.6 Russia
8.4 Asia Pacific
8.4.1 Asia Pacific Printed Circuit Board (PCB) E-scrap Recycling Sales by Region
8.4.2 China
8.4.3 Japan
8.4.4 South Korea
8.4.5 India
8.4.6 Southeast Asia
8.5 South America
8.5.1 South America Printed Circuit Board (PCB) E-scrap Recycling Sales by Country
8.5.2 Brazil
8.5.3 Argentina
8.5.4 Columbia
8.6 Middle East and Africa
8.6.1 Middle East and Africa Printed Circuit Board (PCB) E-scrap Recycling Sales by Region
8.6.2 Saudi Arabia
8.6.3 UAE
8.6.4 Egypt
8.6.5 Nigeria
8.6.6 South Africa
9 Printed Circuit Board (PCB) E-scrap Recycling Market Production by Region
9.1 Global Production of Printed Circuit Board (PCB) E-scrap Recycling by Region (2019-2025)
9.2 Global Printed Circuit Board (PCB) E-scrap Recycling Revenue Market Share by Region (2019-2025)
9.3 Global Printed Circuit Board (PCB) E-scrap Recycling Production, Revenue, Price and Gross Margin (2019-2025)
9.4 North America Printed Circuit Board (PCB) E-scrap Recycling Production
9.4.1 North America Printed Circuit Board (PCB) E-scrap Recycling Production Growth Rate (2019-2025)
9.4.2 North America Printed Circuit Board (PCB) E-scrap Recycling Production, Revenue, Price and Gross Margin (2019-2025)
9.5 Europe Printed Circuit Board (PCB) E-scrap Recycling Production
9.5.1 Europe Printed Circuit Board (PCB) E-scrap Recycling Production Growth Rate (2019-2025)
9.5.2 Europe Printed Circuit Board (PCB) E-scrap Recycling Production, Revenue, Price and Gross Margin (2019-2025)
9.6 Japan Printed Circuit Board (PCB) E-scrap Recycling Production (2019-2025)
9.6.1 Japan Printed Circuit Board (PCB) E-scrap Recycling Production Growth Rate (2019-2025)
9.6.2 Japan Printed Circuit Board (PCB) E-scrap Recycling Production, Revenue, Price and Gross Margin (2019-2025)
9.7 China Printed Circuit Board (PCB) E-scrap Recycling Production (2019-2025)
9.7.1 China Printed Circuit Board (PCB) E-scrap Recycling Production Growth Rate (2019-2025)
9.7.2 China Printed Circuit Board (PCB) E-scrap Recycling Production, Revenue, Price and Gross Margin (2019-2025)
10 Key Companies Profile
10.1 Boliden
10.1.1 Boliden Printed Circuit Board (PCB) E-scrap Recycling Basic Information
10.1.2 Boliden Printed Circuit Board (PCB) E-scrap Recycling Product Overview
10.1.3 Boliden Printed Circuit Board (PCB) E-scrap Recycling Product Market Performance
10.1.4 Boliden Business Overview
10.1.5 Boliden Printed Circuit Board (PCB) E-scrap Recycling SWOT Analysis
10.1.6 Boliden Recent Developments
10.2 Umicore
10.2.1 Umicore Printed Circuit Board (PCB) E-scrap Recycling Basic Information
10.2.2 Umicore Printed Circuit Board (PCB) E-scrap Recycling Product Overview
10.2.3 Umicore Printed Circuit Board (PCB) E-scrap Recycling Product Market Performance
10.2.4 Umicore Business Overview
10.2.5 Umicore Printed Circuit Board (PCB) E-scrap Recycling SWOT Analysis
10.2.6 Umicore Recent Developments
10.3 Aurubis
10.3.1 Aurubis Printed Circuit Board (PCB) E-scrap Recycling Basic Information
10.3.2 Aurubis Printed Circuit Board (PCB) E-scrap Recycling Product Overview
10.3.3 Aurubis Printed Circuit Board (PCB) E-scrap Recycling Product Market Performance
10.3.4 Aurubis Printed Circuit Board (PCB) E-scrap Recycling SWOT Analysis
10.3.5 Aurubis Business Overview
10.3.6 Aurubis Recent Developments
10.4 Mitsubishi Materials Corporation
10.4.1 Mitsubishi Materials Corporation Printed Circuit Board (PCB) E-scrap Recycling Basic Information
10.4.2 Mitsubishi Materials Corporation Printed Circuit Board (PCB) E-scrap Recycling Product Overview
10.4.3 Mitsubishi Materials Corporation Printed Circuit Board (PCB) E-scrap Recycling Product Market Performance
10.4.4 Mitsubishi Materials Corporation Business Overview
10.4.5 Mitsubishi Materials Corporation Recent Developments
10.5 Glencore(Canada)
10.5.1 Glencore(Canada) Printed Circuit Board (PCB) E-scrap Recycling Basic Information
10.5.2 Glencore(Canada) Printed Circuit Board (PCB) E-scrap Recycling Product Overview
10.5.3 Glencore(Canada) Printed Circuit Board (PCB) E-scrap Recycling Product Market Performance
10.5.4 Glencore(Canada) Business Overview
10.5.5 Glencore(Canada) Recent Developments
10.6 LS-Nikko Copper
10.6.1 LS-Nikko Copper Printed Circuit Board (PCB) E-scrap Recycling Basic Information
10.6.2 LS-Nikko Copper Printed Circuit Board (PCB) E-scrap Recycling Product Overview
10.6.3 LS-Nikko Copper Printed Circuit Board (PCB) E-scrap Recycling Product Market Performance
10.6.4 LS-Nikko Copper Business Overview
10.6.5 LS-Nikko Copper Recent Developments
10.7 Dowa Holdings
10.7.1 Dowa Holdings Printed Circuit Board (PCB) E-scrap Recycling Basic Information
10.7.2 Dowa Holdings Printed Circuit Board (PCB) E-scrap Recycling Product Overview
10.7.3 Dowa Holdings Printed Circuit Board (PCB) E-scrap Recycling Product Market Performance
10.7.4 Dowa Holdings Business Overview
10.7.5 Dowa Holdings Recent Developments
10.8 JX Nippon Mining and Metals
10.8.1 JX Nippon Mining and Metals Printed Circuit Board (PCB) E-scrap Recycling Basic Information
10.8.2 JX Nippon Mining and Metals Printed Circuit Board (PCB) E-scrap Recycling Product Overview
10.8.3 JX Nippon Mining and Metals Printed Circuit Board (PCB) E-scrap Recycling Product Market Performance
10.8.4 JX Nippon Mining and Metals Business Overview
10.8.5 JX Nippon Mining and Metals Recent Developments
10.9 Korea Zinc
10.9.1 Korea Zinc Printed Circuit Board (PCB) E-scrap Recycling Basic Information
10.9.2 Korea Zinc Printed Circuit Board (PCB) E-scrap Recycling Product Overview
10.9.3 Korea Zinc Printed Circuit Board (PCB) E-scrap Recycling Product Market Performance
10.9.4 Korea Zinc Business Overview
10.9.5 Korea Zinc Recent Developments
10.10 Asahi Holdings
10.10.1 Asahi Holdings Printed Circuit Board (PCB) E-scrap Recycling Basic Information
10.10.2 Asahi Holdings Printed Circuit Board (PCB) E-scrap Recycling Product Overview
10.10.3 Asahi Holdings Printed Circuit Board (PCB) E-scrap Recycling Product Market Performance
10.10.4 Asahi Holdings Business Overview
10.10.5 Asahi Holdings Recent Developments
10.11 Mitsui Mining and Smelting
10.11.1 Mitsui Mining and Smelting Printed Circuit Board (PCB) E-scrap Recycling Basic Information
10.11.2 Mitsui Mining and Smelting Printed Circuit Board (PCB) E-scrap Recycling Product Overview
10.11.3 Mitsui Mining and Smelting Printed Circuit Board (PCB) E-scrap Recycling Product Market Performance
10.11.4 Mitsui Mining and Smelting Business Overview
10.11.5 Mitsui Mining and Smelting Recent Developments
10.12 UWin Nanotech. Co. Ltd.
10.12.1 UWin Nanotech. Co. Ltd. Printed Circuit Board (PCB) E-scrap Recycling Basic Information
10.12.2 UWin Nanotech. Co. Ltd. Printed Circuit Board (PCB) E-scrap Recycling Product Overview
10.12.3 UWin Nanotech. Co. Ltd. Printed Circuit Board (PCB) E-scrap Recycling Product Market Performance
10.12.4 UWin Nanotech. Co. Ltd. Business Overview
10.12.5 UWin Nanotech. Co. Ltd. Recent Developments
10.13 SingWay Technology Co.,Ltd.
10.13.1 SingWay Technology Co.,Ltd. Printed Circuit Board (PCB) E-scrap Recycling Basic Information
10.13.2 SingWay Technology Co.,Ltd. Printed Circuit Board (PCB) E-scrap Recycling Product Overview
10.13.3 SingWay Technology Co.,Ltd. Printed Circuit Board (PCB) E-scrap Recycling Product Market Performance
10.13.4 SingWay Technology Co.,Ltd. Business Overview
10.13.5 SingWay Technology Co.,Ltd. Recent Developments
10.14 Solar Applied Materials
10.14.1 Solar Applied Materials Printed Circuit Board (PCB) E-scrap Recycling Basic Information
10.14.2 Solar Applied Materials Printed Circuit Board (PCB) E-scrap Recycling Product Overview
10.14.3 Solar Applied Materials Printed Circuit Board (PCB) E-scrap Recycling Product Market Performance
10.14.4 Solar Applied Materials Business Overview
10.14.5 Solar Applied Materials Recent Developments
10.15 Jiin Yeeh Ding
10.15.1 Jiin Yeeh Ding Printed Circuit Board (PCB) E-scrap Recycling Basic Information
10.15.2 Jiin Yeeh Ding Printed Circuit Board (PCB) E-scrap Recycling Product Overview
10.15.3 Jiin Yeeh Ding Printed Circuit Board (PCB) E-scrap Recycling Product Market Performance
10.15.4 Jiin Yeeh Ding Business Overview
10.15.5 Jiin Yeeh Ding Recent Developments
10.16 WASTE Recovery Technology
10.16.1 WASTE Recovery Technology Printed Circuit Board (PCB) E-scrap Recycling Basic Information
10.16.2 WASTE Recovery Technology Printed Circuit Board (PCB) E-scrap Recycling Product Overview
10.16.3 WASTE Recovery Technology Printed Circuit Board (PCB) E-scrap Recycling Product Market Performance
10.16.4 WASTE Recovery Technology Business Overview
10.16.5 WASTE Recovery Technology Recent Developments
11 Printed Circuit Board (PCB) E-scrap Recycling Market Forecast by Region
11.1 Global Printed Circuit Board (PCB) E-scrap Recycling Market Size Forecast
11.2 Global Printed Circuit Board (PCB) E-scrap Recycling Market Forecast by Region
11.2.1 North America Market Size Forecast by Country
11.2.2 Europe Printed Circuit Board (PCB) E-scrap Recycling Market Size Forecast by Country
11.2.3 Asia Pacific Printed Circuit Board (PCB) E-scrap Recycling Market Size Forecast by Region
11.2.4 South America Printed Circuit Board (PCB) E-scrap Recycling Market Size Forecast by Country
11.2.5 Middle East and Africa Forecasted Consumption of Printed Circuit Board (PCB) E-scrap Recycling by Country
12 Forecast Market by Type and by Application (2025-2032)
12.1 Global Printed Circuit Board (PCB) E-scrap Recycling Market Forecast by Type (2025-2032)
12.1.1 Global Forecasted Sales of Printed Circuit Board (PCB) E-scrap Recycling by Type (2025-2032)
12.1.2 Global Printed Circuit Board (PCB) E-scrap Recycling Market Size Forecast by Type (2025-2032)
12.1.3 Global Forecasted Price of Printed Circuit Board (PCB) E-scrap Recycling by Type (2025-2032)
12.2 Global Printed Circuit Board (PCB) E-scrap Recycling Market Forecast by Application (2025-2032)
12.2.1 Global Printed Circuit Board (PCB) E-scrap Recycling Sales (K Units) Forecast by Application
12.2.2 Global Printed Circuit Board (PCB) E-scrap Recycling Market Size (M USD) Forecast by Application (2025-2032)
13 Conclusion and Key FindingsList of Tables
Table 1. Introduction of the Type
Table 2. Introduction of the Application
Table 3. Market Size (M USD) Segment Executive Summary
Table 4. Printed Circuit Board (PCB) E-scrap Recycling Market Size Comparison by Region (M USD)
Table 5. Global Printed Circuit Board (PCB) E-scrap Recycling Sales (K Units) by Manufacturers (2019-2025)
Table 6. Global Printed Circuit Board (PCB) E-scrap Recycling Sales Market Share by Manufacturers (2019-2025)
Table 7. Global Printed Circuit Board (PCB) E-scrap Recycling Revenue (M USD) by Manufacturers (2019-2025)
Table 8. Global Printed Circuit Board (PCB) E-scrap Recycling Revenue Share by Manufacturers (2019-2025)
Table 9. Company Type (Tier 1, Tier 2, and Tier 3) & (based on the Revenue in Printed Circuit Board (PCB) E-scrap Recycling as of 2022)
Table 10. Global Market Printed Circuit Board (PCB) E-scrap Recycling Average Price (USD/Unit) of Key Manufacturers (2019-2025)
Table 11. Manufacturers Printed Circuit Board (PCB) E-scrap Recycling Sales Sites and Area Served
Table 12. Manufacturers Printed Circuit Board (PCB) E-scrap Recycling Product Type
Table 13. Global Printed Circuit Board (PCB) E-scrap Recycling Manufacturers Market Concentration Ratio (CR5 and HHI)
Table 14. Mergers & Acquisitions, Expansion Plans
Table 15. Industry Chain Map of Printed Circuit Board (PCB) E-scrap Recycling
Table 16. Market Overview of Key Raw Materials
Table 17. Midstream Market Analysis
Table 18. Downstream Customer Analysis
Table 19. Key Development Trends
Table 20. Driving Factors
Table 21. Printed Circuit Board (PCB) E-scrap Recycling Market Challenges
Table 22. Global Printed Circuit Board (PCB) E-scrap Recycling Sales by Type (K Units)
Table 23. Global Printed Circuit Board (PCB) E-scrap Recycling Market Size by Type (M USD)
Table 24. Global Printed Circuit Board (PCB) E-scrap Recycling Sales (K Units) by Type (2019-2025)
Table 25. Global Printed Circuit Board (PCB) E-scrap Recycling Sales Market Share by Type (2019-2025)
Table 26. Global Printed Circuit Board (PCB) E-scrap Recycling Market Size (M USD) by Type (2019-2025)
Table 27. Global Printed Circuit Board (PCB) E-scrap Recycling Market Size Share by Type (2019-2025)
Table 28. Global Printed Circuit Board (PCB) E-scrap Recycling Price (USD/Unit) by Type (2019-2025)
Table 29. Global Printed Circuit Board (PCB) E-scrap Recycling Sales (K Units) by Application
Table 30. Global Printed Circuit Board (PCB) E-scrap Recycling Market Size by Application
Table 31. Global Printed Circuit Board (PCB) E-scrap Recycling Sales by Application (2019-2025) & (K Units)
Table 32. Global Printed Circuit Board (PCB) E-scrap Recycling Sales Market Share by Application (2019-2025)
Table 33. Global Printed Circuit Board (PCB) E-scrap Recycling Sales by Application (2019-2025) & (M USD)
Table 34. Global Printed Circuit Board (PCB) E-scrap Recycling Market Share by Application (2019-2025)
Table 35. Global Printed Circuit Board (PCB) E-scrap Recycling Sales Growth Rate by Application (2019-2025)
Table 36. Global Printed Circuit Board (PCB) E-scrap Recycling Sales by Region (2019-2025) & (K Units)
Table 37. Global Printed Circuit Board (PCB) E-scrap Recycling Sales Market Share by Region (2019-2025)
Table 38. North America Printed Circuit Board (PCB) E-scrap Recycling Sales by Country (2019-2025) & (K Units)
Table 39. Europe Printed Circuit Board (PCB) E-scrap Recycling Sales by Country (2019-2025) & (K Units)
Table 40. Asia Pacific Printed Circuit Board (PCB) E-scrap Recycling Sales by Region (2019-2025) & (K Units)
Table 41. South America Printed Circuit Board (PCB) E-scrap Recycling Sales by Country (2019-2025) & (K Units)
Table 42. Middle East and Africa Printed Circuit Board (PCB) E-scrap Recycling Sales by Region (2019-2025) & (K Units)
Table 43. Global Printed Circuit Board (PCB) E-scrap Recycling Production (K Units) by Region (2019-2025)
Table 44. Global Printed Circuit Board (PCB) E-scrap Recycling Revenue (US$ Million) by Region (2019-2025)
Table 45. Global Printed Circuit Board (PCB) E-scrap Recycling Revenue Market Share by Region (2019-2025)
Table 46. Global Printed Circuit Board (PCB) E-scrap Recycling Production (K Units), Revenue (US$ Million), Price (USD/Unit) and Gross Margin (2019-2025)
Table 47. North America Printed Circuit Board (PCB) E-scrap Recycling Production (K Units), Revenue (US$ Million), Price (USD/Unit) and Gross Margin (2019-2025)
Table 48. Europe Printed Circuit Board (PCB) E-scrap Recycling Production (K Units), Revenue (US$ Million), Price (USD/Unit) and Gross Margin (2019-2025)
Table 49. Japan Printed Circuit Board (PCB) E-scrap Recycling Production (K Units), Revenue (US$ Million), Price (USD/Unit) and Gross Margin (2019-2025)
Table 50. China Printed Circuit Board (PCB) E-scrap Recycling Production (K Units), Revenue (US$ Million), Price (USD/Unit) and Gross Margin (2019-2025)
Table 51. Boliden Printed Circuit Board (PCB) E-scrap Recycling Basic Information
Table 52. Boliden Printed Circuit Board (PCB) E-scrap Recycling Product Overview
Table 53. Boliden Printed Circuit Board (PCB) E-scrap Recycling Sales (K Units), Revenue (M USD), Price (USD/Unit) and Gross Margin (2019-2025)
Table 54. Boliden Business Overview
Table 55. Boliden Printed Circuit Board (PCB) E-scrap Recycling SWOT Analysis
Table 56. Boliden Recent Developments
Table 57. Umicore Printed Circuit Board (PCB) E-scrap Recycling Basic Information
Table 58. Umicore Printed Circuit Board (PCB) E-scrap Recycling Product Overview
Table 59. Umicore Printed Circuit Board (PCB) E-scrap Recycling Sales (K Units), Revenue (M USD), Price (USD/Unit) and Gross Margin (2019-2025)
Table 60. Umicore Business Overview
Table 61. Umicore Printed Circuit Board (PCB) E-scrap Recycling SWOT Analysis
Table 62. Umicore Recent Developments
Table 63. Aurubis Printed Circuit Board (PCB) E-scrap Recycling Basic Information
Table 64. Aurubis Printed Circuit Board (PCB) E-scrap Recycling Product Overview
Table 65. Aurubis Printed Circuit Board (PCB) E-scrap Recycling Sales (K Units), Revenue (M USD), Price (USD/Unit) and Gross Margin (2019-2025)
Table 66. Aurubis Printed Circuit Board (PCB) E-scrap Recycling SWOT Analysis
Table 67. Aurubis Business Overview
Table 68. Aurubis Recent Developments
Table 69. Mitsubishi Materials Corporation Printed Circuit Board (PCB) E-scrap Recycling Basic Information
Table 70. Mitsubishi Materials Corporation Printed Circuit Board (PCB) E-scrap Recycling Product Overview
Table 71. Mitsubishi Materials Corporation Printed Circuit Board (PCB) E-scrap Recycling Sales (K Units), Revenue (M USD), Price (USD/Unit) and Gross Margin (2019-2025)
Table 72. Mitsubishi Materials Corporation Business Overview
Table 73. Mitsubishi Materials Corporation Recent Developments
Table 74. Glencore(Canada) Printed Circuit Board (PCB) E-scrap Recycling Basic Information
Table 75. Glencore(Canada) Printed Circuit Board (PCB) E-scrap Recycling Product Overview
Table 76. Glencore(Canada) Printed Circuit Board (PCB) E-scrap Recycling Sales (K Units), Revenue (M USD), Price (USD/Unit) and Gross Margin (2019-2025)
Table 77. Glencore(Canada) Business Overview
Table 78. Glencore(Canada) Recent Developments
Table 79. LS-Nikko Copper Printed Circuit Board (PCB) E-scrap Recycling Basic Information
Table 80. LS-Nikko Copper Printed Circuit Board (PCB) E-scrap Recycling Product Overview
Table 81. LS-Nikko Copper Printed Circuit Board (PCB) E-scrap Recycling Sales (K Units), Revenue (M USD), Price (USD/Unit) and Gross Margin (2019-2025)
Table 82. LS-Nikko Copper Business Overview
Table 83. LS-Nikko Copper Recent Developments
Table 84. Dowa Holdings Printed Circuit Board (PCB) E-scrap Recycling Basic Information
Table 85. Dowa Holdings Printed Circuit Board (PCB) E-scrap Recycling Product Overview
Table 86. Dowa Holdings Printed Circuit Board (PCB) E-scrap Recycling Sales (K Units), Revenue (M USD), Price (USD/Unit) and Gross Margin (2019-2025)
Table 87. Dowa Holdings Business Overview
Table 88. Dowa Holdings Recent Developments
Table 89. JX Nippon Mining and Metals Printed Circuit Board (PCB) E-scrap Recycling Basic Information
Table 90. JX Nippon Mining and Metals Printed Circuit Board (PCB) E-scrap Recycling Product Overview
Table 91. JX Nippon Mining and Metals Printed Circuit Board (PCB) E-scrap Recycling Sales (K Units), Revenue (M USD), Price (USD/Unit) and Gross Margin (2019-2025)
Table 92. JX Nippon Mining and Metals Business Overview
Table 93. JX Nippon Mining and Metals Recent Developments
Table 94. Korea Zinc Printed Circuit Board (PCB) E-scrap Recycling Basic Information
Table 95. Korea Zinc Printed Circuit Board (PCB) E-scrap Recycling Product Overview
Table 96. Korea Zinc Printed Circuit Board (PCB) E-scrap Recycling Sales (K Units), Revenue (M USD), Price (USD/Unit) and Gross Margin (2019-2025)
Table 97. Korea Zinc Business Overview
Table 98. Korea Zinc Recent Developments
Table 99. Asahi Holdings Printed Circuit Board (PCB) E-scrap Recycling Basic Information
Table 100. Asahi Holdings Printed Circuit Board (PCB) E-scrap Recycling Product Overview
Table 101. Asahi Holdings Printed Circuit Board (PCB) E-scrap Recycling Sales (K Units), Revenue (M USD), Price (USD/Unit) and Gross Margin (2019-2025)
Table 102. Asahi Holdings Business Overview
Table 103. Asahi Holdings Recent Developments
Table 104. Mitsui Mining and Smelting Printed Circuit Board (PCB) E-scrap Recycling Basic Information
Table 105. Mitsui Mining and Smelting Printed Circuit Board (PCB) E-scrap Recycling Product Overview
Table 106. Mitsui Mining and Smelting Printed Circuit Board (PCB) E-scrap Recycling Sales (K Units), Revenue (M USD), Price (USD/Unit) and Gross Margin (2019-2025)
Table 107. Mitsui Mining and Smelting Business Overview
Table 108. Mitsui Mining and Smelting Recent Developments
Table 109. UWin Nanotech. Co. Ltd. Printed Circuit Board (PCB) E-scrap Recycling Basic Information
Table 110. UWin Nanotech. Co. Ltd. Printed Circuit Board (PCB) E-scrap Recycling Product Overview
Table 111. UWin Nanotech. Co. Ltd. Printed Circuit Board (PCB) E-scrap Recycling Sales (K Units), Revenue (M USD), Price (USD/Unit) and Gross Margin (2019-2025)
Table 112. UWin Nanotech. Co. Ltd. Business Overview
Table 113. UWin Nanotech. Co. Ltd. Recent Developments
Table 114. SingWay Technology Co.,Ltd. Printed Circuit Board (PCB) E-scrap Recycling Basic Information
Table 115. SingWay Technology Co.,Ltd. Printed Circuit Board (PCB) E-scrap Recycling Product Overview
Table 116. SingWay Technology Co.,Ltd. Printed Circuit Board (PCB) E-scrap Recycling Sales (K Units), Revenue (M USD), Price (USD/Unit) and Gross Margin (2019-2025)
Table 117. SingWay Technology Co.,Ltd. Business Overview
Table 118. SingWay Technology Co.,Ltd. Recent Developments
Table 119. Solar Applied Materials Printed Circuit Board (PCB) E-scrap Recycling Basic Information
Table 120. Solar Applied Materials Printed Circuit Board (PCB) E-scrap Recycling Product Overview
Table 121. Solar Applied Materials Printed Circuit Board (PCB) E-scrap Recycling Sales (K Units), Revenue (M USD), Price (USD/Unit) and Gross Margin (2019-2025)
Table 122. Solar Applied Materials Business Overview
Table 123. Solar Applied Materials Recent Developments
Table 124. Jiin Yeeh Ding Printed Circuit Board (PCB) E-scrap Recycling Basic Information
Table 125. Jiin Yeeh Ding Printed Circuit Board (PCB) E-scrap Recycling Product Overview
Table 126. Jiin Yeeh Ding Printed Circuit Board (PCB) E-scrap Recycling Sales (K Units), Revenue (M USD), Price (USD/Unit) and Gross Margin (2019-2025)
Table 127. Jiin Yeeh Ding Business Overview
Table 128. Jiin Yeeh Ding Recent Developments
Table 129. WASTE Recovery Technology Printed Circuit Board (PCB) E-scrap Recycling Basic Information
Table 130. WASTE Recovery Technology Printed Circuit Board (PCB) E-scrap Recycling Product Overview
Table 131. WASTE Recovery Technology Printed Circuit Board (PCB) E-scrap Recycling Sales (K Units), Revenue (M USD), Price (USD/Unit) and Gross Margin (2019-2025)
Table 132. WASTE Recovery Technology Business Overview
Table 133. WASTE Recovery Technology Recent Developments
Table 134. Global Printed Circuit Board (PCB) E-scrap Recycling Sales Forecast by Region (2025-2032) & (K Units)
Table 135. Global Printed Circuit Board (PCB) E-scrap Recycling Market Size Forecast by Region (2025-2032) & (M USD)
Table 136. North America Printed Circuit Board (PCB) E-scrap Recycling Sales Forecast by Country (2025-2032) & (K Units)
Table 137. North America Printed Circuit Board (PCB) E-scrap Recycling Market Size Forecast by Country (2025-2032) & (M USD)
Table 138. Europe Printed Circuit Board (PCB) E-scrap Recycling Sales Forecast by Country (2025-2032) & (K Units)
Table 139. Europe Printed Circuit Board (PCB) E-scrap Recycling Market Size Forecast by Country (2025-2032) & (M USD)
Table 140. Asia Pacific Printed Circuit Board (PCB) E-scrap Recycling Sales Forecast by Region (2025-2032) & (K Units)
Table 141. Asia Pacific Printed Circuit Board (PCB) E-scrap Recycling Market Size Forecast by Region (2025-2032) & (M USD)
Table 142. South America Printed Circuit Board (PCB) E-scrap Recycling Sales Forecast by Country (2025-2032) & (K Units)
Table 143. South America Printed Circuit Board (PCB) E-scrap Recycling Market Size Forecast by Country (2025-2032) & (M USD)
Table 144. Middle East and Africa Printed Circuit Board (PCB) E-scrap Recycling Consumption Forecast by Country (2025-2032) & (Units)
Table 145. Middle East and Africa Printed Circuit Board (PCB) E-scrap Recycling Market Size Forecast by Country (2025-2032) & (M USD)
Table 146. Global Printed Circuit Board (PCB) E-scrap Recycling Sales Forecast by Type (2025-2032) & (K Units)
Table 147. Global Printed Circuit Board (PCB) E-scrap Recycling Market Size Forecast by Type (2025-2032) & (M USD)
Table 148. Global Printed Circuit Board (PCB) E-scrap Recycling Price Forecast by Type (2025-2032) & (USD/Unit)
Table 149. Global Printed Circuit Board (PCB) E-scrap Recycling Sales (K Units) Forecast by Application (2025-2032)
Table 150. Global Printed Circuit Board (PCB) E-scrap Recycling Market Size Forecast by Application (2025-2032) & (M USD)
List of Figures
Figure 1. Product Picture of Printed Circuit Board (PCB) E-scrap Recycling
Figure 2. Data Triangulation
Figure 3. Key Caveats
Figure 4. Global Printed Circuit Board (PCB) E-scrap Recycling Market Size (M USD), 2019-2032
Figure 5. Global Printed Circuit Board (PCB) E-scrap Recycling Market Size (M USD) (2019-2032)
Figure 6. Global Printed Circuit Board (PCB) E-scrap Recycling Sales (K Units) & (2019-2032)
Figure 7. Evaluation Matrix of Segment Market Development Potential (Type)
Figure 8. Evaluation Matrix of Segment Market Development Potential (Application)
Figure 9. Evaluation Matrix of Regional Market Development Potential
Figure 10. Printed Circuit Board (PCB) E-scrap Recycling Market Size by Country (M USD)
Figure 11. Printed Circuit Board (PCB) E-scrap Recycling Sales Share by Manufacturers in 2023
Figure 12. Global Printed Circuit Board (PCB) E-scrap Recycling Revenue Share by Manufacturers in 2023
Figure 13. Printed Circuit Board (PCB) E-scrap Recycling Market Share by Company Type (Tier 1, Tier 2 and Tier 3): 2023
Figure 14. Global Market Printed Circuit Board (PCB) E-scrap Recycling Average Price (USD/Unit) of Key Manufacturers in 2023
Figure 15. The Global 5 and 10 Largest Players: Market Share by Printed Circuit Board (PCB) E-scrap Recycling Revenue in 2023
Figure 16. Evaluation Matrix of Segment Market Development Potential (Type)
Figure 17. Global Printed Circuit Board (PCB) E-scrap Recycling Market Share by Type
Figure 18. Sales Market Share of Printed Circuit Board (PCB) E-scrap Recycling by Type (2019-2025)
Figure 19. Sales Market Share of Printed Circuit Board (PCB) E-scrap Recycling by Type in 2023
Figure 20. Market Size Share of Printed Circuit Board (PCB) E-scrap Recycling by Type (2019-2025)
Figure 21. Market Size Market Share of Printed Circuit Board (PCB) E-scrap Recycling by Type in 2023
Figure 22. Evaluation Matrix of Segment Market Development Potential (Application)
Figure 23. Global Printed Circuit Board (PCB) E-scrap Recycling Market Share by Application
Figure 24. Global Printed Circuit Board (PCB) E-scrap Recycling Sales Market Share by Application (2019-2025)
Figure 25. Global Printed Circuit Board (PCB) E-scrap Recycling Sales Market Share by Application in 2023
Figure 26. Global Printed Circuit Board (PCB) E-scrap Recycling Market Share by Application (2019-2025)
Figure 27. Global Printed Circuit Board (PCB) E-scrap Recycling Market Share by Application in 2023
Figure 28. Global Printed Circuit Board (PCB) E-scrap Recycling Sales Growth Rate by Application (2019-2025)
Figure 29. Global Printed Circuit Board (PCB) E-scrap Recycling Sales Market Share by Region (2019-2025)
Figure 30. North America Printed Circuit Board (PCB) E-scrap Recycling Sales and Growth Rate (2019-2025) & (K Units)
Figure 31. North America Printed Circuit Board (PCB) E-scrap Recycling Sales Market Share by Country in 2023
Figure 32. U.S. Printed Circuit Board (PCB) E-scrap Recycling Sales and Growth Rate (2019-2025) & (K Units)
Figure 33. Canada Printed Circuit Board (PCB) E-scrap Recycling Sales (K Units) and Growth Rate (2019-2025)
Figure 34. Mexico Printed Circuit Board (PCB) E-scrap Recycling Sales (Units) and Growth Rate (2019-2025)
Figure 35. Europe Printed Circuit Board (PCB) E-scrap Recycling Sales and Growth Rate (2019-2025) & (K Units)
Figure 36. Europe Printed Circuit Board (PCB) E-scrap Recycling Sales Market Share by Country in 2023
Figure 37. Germany Printed Circuit Board (PCB) E-scrap Recycling Sales and Growth Rate (2019-2025) & (K Units)
Figure 38. France Printed Circuit Board (PCB) E-scrap Recycling Sales and Growth Rate (2019-2025) & (K Units)
Figure 39. U.K. Printed Circuit Board (PCB) E-scrap Recycling Sales and Growth Rate (2019-2025) & (K Units)
Figure 40. Italy Printed Circuit Board (PCB) E-scrap Recycling Sales and Growth Rate (2019-2025) & (K Units)
Figure 41. Russia Printed Circuit Board (PCB) E-scrap Recycling Sales and Growth Rate (2019-2025) & (K Units)
Figure 42. Asia Pacific Printed Circuit Board (PCB) E-scrap Recycling Sales and Growth Rate (K Units)
Figure 43. Asia Pacific Printed Circuit Board (PCB) E-scrap Recycling Sales Market Share by Region in 2023
Figure 44. China Printed Circuit Board (PCB) E-scrap Recycling Sales and Growth Rate (2019-2025) & (K Units)
Figure 45. Japan Printed Circuit Board (PCB) E-scrap Recycling Sales and Growth Rate (2019-2025) & (K Units)
Figure 46. South Korea Printed Circuit Board (PCB) E-scrap Recycling Sales and Growth Rate (2019-2025) & (K Units)
Figure 47. India Printed Circuit Board (PCB) E-scrap Recycling Sales and Growth Rate (2019-2025) & (K Units)
Figure 48. Southeast Asia Printed Circuit Board (PCB) E-scrap Recycling Sales and Growth Rate (2019-2025) & (K Units)
Figure 49. South America Printed Circuit Board (PCB) E-scrap Recycling Sales and Growth Rate (K Units)
Figure 50. South America Printed Circuit Board (PCB) E-scrap Recycling Sales Market Share by Country in 2023
Figure 51. Brazil Printed Circuit Board (PCB) E-scrap Recycling Sales and Growth Rate (2019-2025) & (K Units)
Figure 52. Argentina Printed Circuit Board (PCB) E-scrap Recycling Sales and Growth Rate (2019-2025) & (K Units)
Figure 53. Columbia Printed Circuit Board (PCB) E-scrap Recycling Sales and Growth Rate (2019-2025) & (K Units)
Figure 54. Middle East and Africa Printed Circuit Board (PCB) E-scrap Recycling Sales and Growth Rate (K Units)
Figure 55. Middle East and Africa Printed Circuit Board (PCB) E-scrap Recycling Sales Market Share by Region in 2023
Figure 56. Saudi Arabia Printed Circuit Board (PCB) E-scrap Recycling Sales and Growth Rate (2019-2025) & (K Units)
Figure 57. UAE Printed Circuit Board (PCB) E-scrap Recycling Sales and Growth Rate (2019-2025) & (K Units)
Figure 58. Egypt Printed Circuit Board (PCB) E-scrap Recycling Sales and Growth Rate (2019-2025) & (K Units)
Figure 59. Nigeria Printed Circuit Board (PCB) E-scrap Recycling Sales and Growth Rate (2019-2025) & (K Units)
Figure 60. South Africa Printed Circuit Board (PCB) E-scrap Recycling Sales and Growth Rate (2019-2025) & (K Units)
Figure 61. Global Printed Circuit Board (PCB) E-scrap Recycling Production Market Share by Region (2019-2025)
Figure 62. North America Printed Circuit Board (PCB) E-scrap Recycling Production (K Units) Growth Rate (2019-2025)
Figure 63. Europe Printed Circuit Board (PCB) E-scrap Recycling Production (K Units) Growth Rate (2019-2025)
Figure 64. Japan Printed Circuit Board (PCB) E-scrap Recycling Production (K Units) Growth Rate (2019-2025)
Figure 65. China Printed Circuit Board (PCB) E-scrap Recycling Production (K Units) Growth Rate (2019-2025)
Figure 66. Global Printed Circuit Board (PCB) E-scrap Recycling Sales Forecast by Volume (2019-2032) & (K Units)
Figure 67. Global Printed Circuit Board (PCB) E-scrap Recycling Market Size Forecast by Value (2019-2032) & (M USD)
Figure 68. Global Printed Circuit Board (PCB) E-scrap Recycling Sales Market Share Forecast by Type (2025-2032)
Figure 69. Global Printed Circuit Board (PCB) E-scrap Recycling Market Share Forecast by Type (2025-2032)
Figure 70. Global Printed Circuit Board (PCB) E-scrap Recycling Sales Forecast by Application (2025-2032)
Figure 71. Global Printed Circuit Board (PCB) E-scrap Recycling Market Share Forecast by Application (2025-2032)