MARKET INSIGHTS
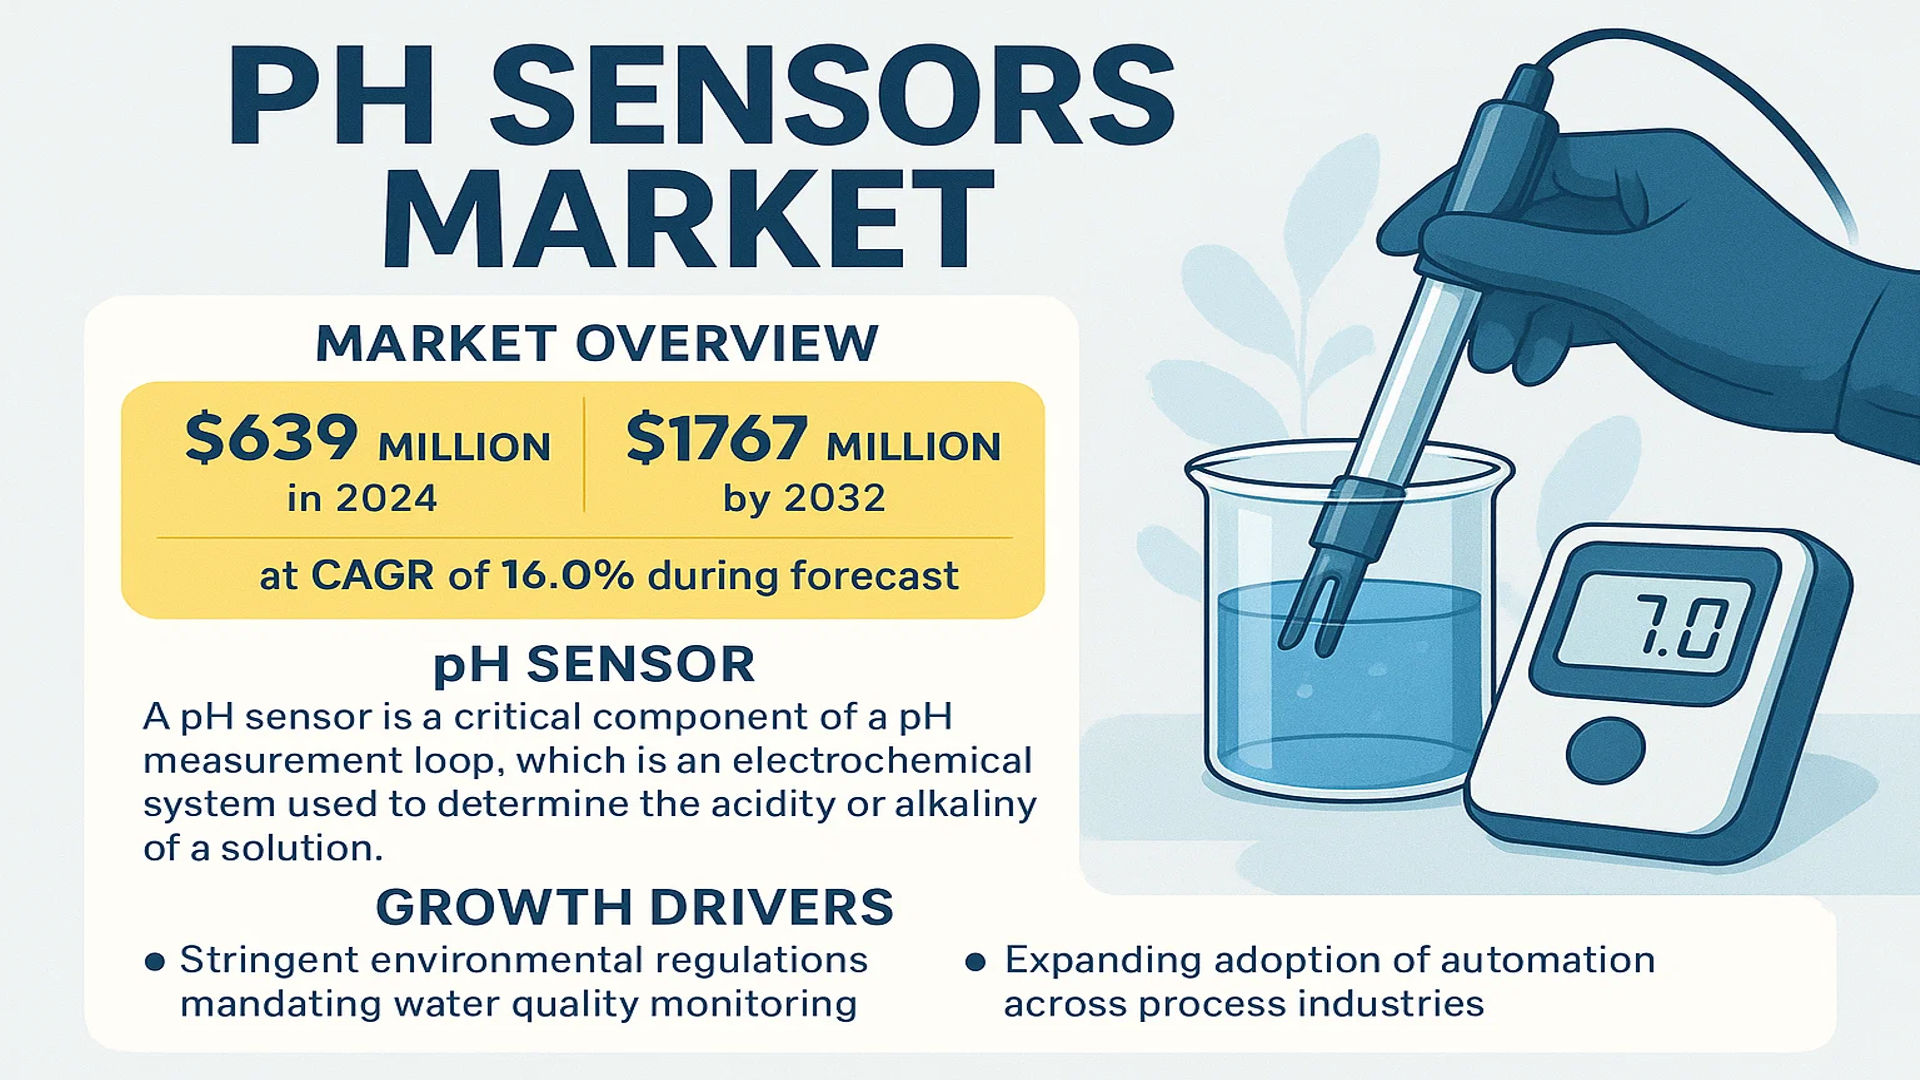
The global PH Sensors market was valued at 639 million in 2024 and is projected to reach US$ 1767 million by 2032, at a CAGR of 16.0% during the forecast period.
A pH sensor is a critical component of a pH measurement loop, which is an electrochemical system used to determine the acidity or alkalinity of a solution. The sensor itself typically consists of a measuring electrode, sensitive to the hydrogen ion, and a reference electrode that provides a stable potential. This setup essentially functions as a battery, generating a millivolt signal that is directly proportional to the hydrogen ion concentration in the solution, thereby providing an accurate pH reading.
The market’s robust growth is primarily driven by stringent environmental regulations mandating water quality monitoring and the expanding adoption of automation across process industries. Furthermore, the increasing demand from the pharmaceutical and food & beverage sectors, where pH is a critical parameter for quality control, is significantly contributing to market expansion. The United States holds the largest market share at approximately 40%, while the glass type sensor segment dominates product offerings with an 80% share due to its high accuracy and established use.
MARKET DYNAMICS
MARKET DRIVERS
Stringent Environmental Regulations and Water Quality Monitoring Requirements to Drive Market Growth
The global push for environmental sustainability and water safety is significantly driving the pH sensors market. Regulatory bodies worldwide are implementing stricter water quality standards, particularly for industrial wastewater discharge and drinking water treatment. Industries are mandated to continuously monitor pH levels to ensure compliance, as pH is a critical parameter affecting chemical reactions, biological processes, and overall environmental health. The water and wastewater treatment sector accounts for approximately 35% of the total pH sensor demand globally. Furthermore, increasing industrial activities in emerging economies are subject to environmental compliance, necessitating robust monitoring systems. This regulatory pressure creates a consistent and growing demand for accurate and reliable pH sensing technologies across multiple sectors.
Expansion of Pharmaceutical and Biotechnology Industries to Boost Market Growth
The pharmaceutical and biotechnology sectors represent one of the fastest-growing application areas for pH sensors, with an estimated annual growth rate of over 18%. pH monitoring is critical throughout drug manufacturing processes, including fermentation, cell culture, purification, and quality control. Even slight deviations in pH can compromise product quality, safety, and efficacy. The global pharmaceutical industry’s expansion, particularly in biologics and biosimilars production, requires precise pH control at various stages. Additionally, the growing biopharmaceutical market, valued at over 400 billion dollars, relies heavily on pH-sensitive processes. The increasing adoption of continuous manufacturing and process analytical technology in pharma further amplifies the need for advanced pH monitoring solutions.
Technological Advancements in Sensor Design and Connectivity to Fuel Market Expansion
Recent technological innovations are significantly enhancing pH sensor capabilities and driving market growth. The development of intelligent sensors with digital communication protocols, such as IO-Link and WirelessHART, enables real-time monitoring and predictive maintenance. Modern pH sensors now feature improved electrode materials, reduced maintenance requirements, and enhanced calibration stability. The integration of Industry 4.0 technologies allows for remote monitoring and data analytics, reducing downtime and improving process efficiency. Additionally, the emergence of ISFET (Ion-Sensitive Field-Effect Transistor) sensors provides advantages in harsh chemical environments where traditional glass electrodes might fail. These technological improvements address longstanding industry challenges and create new application possibilities across various sectors.
MARKET RESTRAINTS
High Maintenance and Calibration Requirements to Deter Market Growth
Despite technological advancements, pH sensors require regular maintenance and calibration to ensure accuracy, which presents a significant restraint to market growth. Traditional glass electrode sensors need frequent calibration—typically every 1-2 weeks in industrial applications—and are sensitive to fouling, coating, and chemical attack. The maintenance costs can represent up to 60% of the total cost of ownership over the sensor’s lifespan. In harsh industrial environments, sensors may require even more frequent attention, increasing operational expenses and downtime. This maintenance burden often leads operators to extend calibration intervals beyond recommended periods, potentially compromising measurement accuracy and process control. The need for skilled technicians to perform proper maintenance further adds to operational costs and complexity.
Limited Sensor Lifespan and Replacement Costs to Hinder Market Adoption
The relatively short operational lifespan of pH sensors, particularly in aggressive process conditions, represents another significant market restraint. Glass electrode sensors typically last 6-18 months in demanding applications, while even more robust ISFET sensors have limited longevity in certain environments. The frequent replacement requirement creates substantial ongoing costs for end-users, with sensor replacement accounting for approximately 40% of the total pH measurement system costs over a five-year period. In applications with extreme pH levels, high temperatures, or abrasive media, sensor degradation accelerates, further shortening operational life. This constant need for replacement not only increases direct costs but also contributes to production downtime during sensor changeouts and recalibration.
Technical Limitations in Extreme Process Conditions to Restrict Application Scope
pH sensors face inherent technical limitations when deployed in extreme process conditions, restricting their application across certain industries. Traditional glass electrodes struggle in applications with high temperatures exceeding 100°C, extreme pH values below 2 or above 12, or solutions containing hydrofluoric acid. Additionally, sensors encounter challenges in non-aqueous solutions, viscous media, or applications with high solids content where fouling and coating occur rapidly. These limitations force industries to implement alternative measurement techniques or complex sample conditioning systems, adding complexity and cost to monitoring solutions. The technical constraints particularly affect chemical processing, pharmaceutical manufacturing, and food production applications where process conditions often push beyond conventional sensor capabilities.
MARKET OPPORTUNITIES
Emerging Applications in Food Safety and Quality Control to Provide Growth Opportunities
The expanding food and beverage industry presents substantial growth opportunities for pH sensor manufacturers. pH monitoring is critical in various food processing applications, including dairy production, beverage manufacturing, meat processing, and canned food production. Regulatory requirements for food safety continue to tighten globally, mandating stricter process control and documentation. The global food safety testing market is growing at approximately 8% annually, driving demand for reliable monitoring equipment. Additionally, the trend toward automated quality control systems in food processing creates opportunities for integrated pH monitoring solutions. The development of specialized sensors for food applications that meet hygiene standards and withstand cleaning-in-place processes further expands market potential in this sector.
Development of Smart Factory and Industrial IoT Integration to Create New Market Space
The ongoing transition toward smart manufacturing and Industrial Internet of Things (IIoT) implementations creates significant opportunities for advanced pH monitoring solutions. Modern pH sensors with digital outputs and self-diagnostic capabilities enable integration with plant-wide control systems and cloud-based analytics platforms. The industrial automation market is projected to grow at over 9% annually, driving demand for intelligent field instruments. Smart pH sensors can provide predictive maintenance alerts, automatic calibration reminders, and trend analysis, reducing unplanned downtime and improving process efficiency. The ability to remotely monitor pH levels across multiple points from a centralized location offers operational advantages particularly valuable for large-scale facilities and distributed operations.
Expansion in Emerging Markets and Infrastructure Development to Drive Future Growth
Rapid industrialization and infrastructure development in emerging economies present substantial growth opportunities for the pH sensors market. Countries across Asia, Latin America, and the Middle East are investing heavily in water treatment infrastructure, industrial capacity, and environmental protection systems. The Asia-Pacific region already accounts for over 40% of the global pH sensor market and continues to show strong growth potential. Government initiatives for clean water access, industrial pollution control, and food safety regulations in these regions drive demand for process instrumentation. Additionally, the transfer of pharmaceutical and chemical manufacturing capacity to emerging markets creates new application areas for pH monitoring equipment, supported by both local production and international quality standards.
MARKET CHALLENGES
Technical Complexity and Measurement Accuracy Issues to Challenge Market Penetration
Despite being a mature technology, pH measurement faces ongoing challenges related to measurement accuracy and technical complexity. pH measurements are affected by multiple factors including temperature, ionic strength, junction potential, and reference electrode stability. Achieving laboratory-level accuracy in industrial environments remains challenging, with typical industrial pH sensors offering accuracy of ±0.1 pH units compared to laboratory instruments capable of ±0.01 pH units. The logarithmic nature of pH measurement means small absolute errors represent significant relative changes in hydrogen ion concentration. This measurement challenge is particularly critical in applications where precise pH control directly affects product quality, such as pharmaceutical manufacturing or specialty chemical production.
Other Challenges
Competition from Alternative Technologies
The pH sensor market faces increasing competition from alternative measurement technologies that offer different advantages. spectroscopic methods, titration techniques, and other analytical approaches sometimes provide complementary or alternative solutions to traditional pH measurement. While these technologies often involve higher initial costs and greater complexity, they can offer advantages in specific applications where pH sensors face limitations. The development of multi-parameter probes that combine pH measurement with other analytical capabilities also creates competitive pressure on standalone pH sensors.
Price Sensitivity in Mature Applications
Established application areas for pH sensors demonstrate significant price sensitivity, particularly in cost-conscious markets and industries with thin profit margins. The water treatment sector, which represents a substantial portion of the pH sensor market, is highly focused on lifecycle costs and often prioritizes initial purchase price over long-term performance. This price pressure challenges manufacturers to develop cost-effective solutions without compromising quality and reliability. Additionally, the presence of low-cost alternatives from emerging manufacturing regions intensifies price competition across various market segments.
PH SENSORS MARKET TRENDS
Advancements in Digitalization and IoT Integration Reshape Market Dynamics
The global pH sensor market is undergoing a significant transformation driven by the rapid integration of Industrial Internet of Things (IIoT) technologies and digitalization initiatives. Modern pH sensors are increasingly equipped with smart features such as wireless connectivity, self-diagnostics, and cloud-based data logging, enabling real-time monitoring and predictive maintenance. This shift is particularly pronounced in the water treatment and chemical sectors, where continuous, remote monitoring of pH levels is critical for process optimization and regulatory compliance. The adoption of Industry 4.0 standards has accelerated the demand for these intelligent sensors, with estimates suggesting that smart sensor adoption in industrial applications has grown by over 18% annually in the past three years. Furthermore, the integration of artificial intelligence and machine learning algorithms with sensor data is enhancing the predictive capabilities of these systems, allowing for more accurate trend analysis and fault detection, thereby reducing downtime and maintenance costs.
Other Trends
Stringent Environmental Regulations and Water Quality Management
Heightened global focus on environmental protection and water quality is creating substantial demand for pH monitoring solutions across various applications. Regulatory bodies worldwide are implementing stricter norms for wastewater discharge and potable water standards, compelling industries and municipalities to invest in reliable pH monitoring infrastructure. The water treatment segment alone accounts for approximately 25% of the global pH sensor market, with this share expected to grow as developing regions improve their water management infrastructure. Municipal water treatment plants are increasingly adopting automated pH monitoring systems to ensure compliance with water safety standards, while industrial facilities are implementing comprehensive effluent treatment systems to meet environmental regulations. This regulatory-driven demand is particularly strong in regions with emerging environmental frameworks, where investments in water infrastructure are growing at rates exceeding 7% annually.
Expansion in Life Sciences and Biotechnology Applications
The pharmaceutical and biotechnology sectors are emerging as significant growth drivers for precision pH sensors, particularly in research, development, and manufacturing processes. pH monitoring is critical in biopharmaceutical production, fermentation processes, and various laboratory applications where exact pH control is essential for product quality and yield. The global biopharmaceutical market’s expansion, projected to maintain a growth rate of over 8% annually, directly correlates with increased demand for high-precision pH sensors. Additionally, the growing adoption of single-use technologies in bioprocessing has created opportunities for specialized, disposable pH sensors that maintain sterility while providing accurate measurements. Research institutions and pharmaceutical companies are increasingly investing in advanced sensor technologies that offer improved accuracy, faster response times, and compatibility with automated systems, driving innovation and specialization within the pH sensor market.
COMPETITIVE LANDSCAPE
Key Industry Players
Technological Innovation and Strategic Expansion Drive Market Leadership
The global pH sensors market exhibits a semi-consolidated structure, characterized by the presence of several established multinational corporations alongside numerous specialized and regional manufacturers. This dynamic creates a competitive environment where technological prowess, product reliability, and extensive service networks are paramount. The top five manufacturers collectively command over 40% of the global market share, underscoring the significant influence of leading players. Market leadership is further reinforced by strong geographical presence, particularly in North America and Europe, which are the largest and most mature markets.
Endress+Hauser and Emerson Electric Co. are recognized as dominant forces, largely due to their comprehensive portfolios that cater to critical industries like chemical processing and water treatment. Their leadership is sustained through continuous investment in research and development, resulting in advanced sensor technologies that offer enhanced accuracy, durability, and digital connectivity for Industry 4.0 applications. Furthermore, their extensive global sales and support infrastructure provides a significant competitive advantage in serving multinational clients.
Meanwhile, other major participants like Honeywell International Inc., ABB Ltd., and Yokogawa Electric Corporation maintain strong market positions through their integration of pH sensors into broader automation and control solutions. These companies leverage their brand reputation and long-standing relationships in sectors such as pharmaceuticals and food & beverages to cross-sell sensing technologies. Their growth strategies often include targeted acquisitions and partnerships to fill portfolio gaps and access emerging technologies, such as solid-state ISFET sensors, which are gaining traction for their robustness in harsh environments.
The competitive intensity is further amplified by specialized players like Mettler Toledo and Hach (a Danaher company), who focus on high-precision analytical and laboratory applications. These companies compete on the basis of product specificity, application expertise, and superior customer service. The overall market competition is expected to intensify over the forecast period, driven by increasing demand for smart sensors and the critical need for precise pH monitoring in environmental applications and quality control processes worldwide.
List of Key pH Sensor Companies Profiled
- Endress+Hauser AG (Switzerland)
- Emerson Electric Co. (U.S.)
- Honeywell International Inc. (U.S.)
- ABB Ltd. (Switzerland)
- Yokogawa Electric Corporation (Japan)
- Mettler-Toledo International Inc. (U.S.)
- Vernier Software & Technology (U.S.)
- Barben Analyzer (Ametek, Inc.) (U.S.)
- Hach (Danaher Corporation) (U.S.)
- Knick GmbH (Germany)
- OMEGA Engineering (U.S.)
- REFEX Sensors Ltd. (U.K.)
- PreSens Precision Sensing GmbH (Germany)
- Sensorex (U.S.)
- Hamilton Company (U.S.)
Segment Analysis:
By Type
Glass Type Sensor Segment Dominates the Market Due to Superior Accuracy and Wide Industrial Adoption
The market is segmented based on type into:
- Glass Type Sensor
- Subtypes: Combination electrodes, refillable electrodes, and others
- ISFET Sensor
- Others
- Subtypes: Metal oxide sensors, optical pH sensors, and others
By Application
Chemical Industry Segment Leads Due to Critical Process Control and Quality Assurance Requirements
The market is segmented based on application into:
- Chemical Industry
- Water Treatment
- Pharmaceutical Industry
- Food and Beverages
- Other
By End User
Industrial Manufacturing Segment Holds Prominence Due to Extensive Process Monitoring Needs
The market is segmented based on end user into:
- Industrial Manufacturing
- Municipal Water Treatment Facilities
- Research and Academic Institutions
- Environmental Monitoring Agencies
By Technology
Electrochemical Sensors Lead the Market Owing to High Reliability and Cost-Effectiveness
The market is segmented based on technology into:
- Electrochemical Sensors
- Optical Sensors
- Solid-State Sensors
Regional Analysis: PH Sensors Market
North America
North America, particularly the United States, is the largest regional market for pH sensors, accounting for approximately 40% of the global market share. This dominance is driven by stringent environmental regulations from agencies like the U.S. Environmental Protection Agency (EPA) and the Food and Drug Administration (FDA), which mandate precise pH monitoring in water treatment, pharmaceutical manufacturing, and food & beverage production. The region’s mature chemical industry and significant investments in industrial automation further propel demand. Leading global manufacturers, including Emerson, Honeywell, and Endress+Hauser, have a strong operational presence here, fostering a competitive landscape focused on technological innovation and high-accuracy, durable sensor solutions.
Europe
Europe represents a major and technologically advanced market for pH sensors, characterized by strict regulatory frameworks such as the EU Water Framework Directive and REACH regulations. These mandates enforce high standards for water purity and industrial effluent, creating sustained demand for reliable pH monitoring in municipal water treatment and various industrial processes. The region’s strong pharmaceutical and specialty chemical sectors, particularly in Germany, France, and the UK, are significant end-users. A key market trend is the rapid adoption of smart sensors and Industry 4.0 integration, with companies like ABB and Endress+Hauser leading the development of connected, digital pH sensors that offer predictive maintenance and data analytics capabilities.
Asia-Pacific
The Asia-Pacific region is the fastest-growing market for pH sensors, projected to exhibit the highest CAGR globally. This growth is fueled by massive industrialization, rapid urbanization, and increasing government investments in water and wastewater treatment infrastructure, especially in China and India. While the market is currently volume-driven with significant consumption of cost-effective glass-type sensors, there is a growing shift towards advanced ISFET and digital sensors as environmental concerns and manufacturing standards rise. The expansive chemical manufacturing base and burgeoning food & beverage industry present substantial opportunities. However, the market is also highly price-sensitive and fragmented, with intense competition from local manufacturers alongside global players.
South America
The pH sensor market in South America is developing, with growth primarily driven by the mining, water treatment, and agricultural sectors. Countries like Brazil and Chile are key markets, where pH monitoring is critical for mineral processing and ensuring water quality. Economic volatility and inconsistent regulatory enforcement, however, can hinder large-scale investments in advanced sensor technologies. Many end-users currently rely on more basic, cost-effective sensor solutions. Despite these challenges, gradual modernization of industrial infrastructure and increasing environmental awareness are expected to drive steady, long-term demand for more sophisticated pH measurement solutions.
Middle East & Africa
The Middle East & Africa region presents an emerging market for pH sensors. Demand is primarily concentrated in the Gulf Cooperation Council (GCC) countries, driven by extensive desalination projects, oil & gas refining, and power generation activities, all of which require rigorous pH control. In Africa, the market is more nascent, with growth potential linked to development in the water treatment and mining sectors. The overall market progression is often constrained by budgetary limitations and a focus on essential infrastructure over advanced instrumentation. Nonetheless, the critical need for water management in arid climates and ongoing industrial development offers a clear path for future market expansion.
Report Scope
This market research report provides a comprehensive analysis of the global and regional pH Sensors markets, covering the forecast period 2025–2032. It offers detailed insights into market dynamics, technological advancements, competitive landscape, and key trends shaping the industry.
Key focus areas of the report include:
- Market Size & Forecast: Historical data and future projections for revenue, unit shipments, and market value across major regions and segments.
- Segmentation Analysis: Detailed breakdown by product type, technology, application, and end-user industry to identify high-growth segments and investment opportunities.
- Regional Outlook: Insights into market performance across North America, Europe, Asia-Pacific, Latin America, and the Middle East & Africa, including country-level analysis where relevant.
- Competitive Landscape: Profiles of leading market participants, including their product offerings, R&D focus, manufacturing capacity, pricing strategies, and recent developments such as mergers, acquisitions, and partnerships.
- Technology Trends & Innovation: Assessment of emerging technologies, integration of AI/IoT, semiconductor design trends, fabrication techniques, and evolving industry standards.
- Market Drivers & Restraints: Evaluation of factors driving market growth along with challenges, supply chain constraints, regulatory issues, and market-entry barriers.
- Stakeholder Analysis: Insights for component suppliers, OEMs, system integrators, investors, and policymakers regarding the evolving ecosystem and strategic opportunities.
Primary and secondary research methods are employed, including interviews with industry experts, data from verified sources, and real-time market intelligence to ensure the accuracy and reliability of the insights presented.
FREQUENTLY ASKED QUESTIONS:
What is the current market size of Global pH Sensors Market?
-> PH Sensors market was valued at 639 million in 2024 and is projected to reach US$ 1767 million by 2032, at a CAGR of 16.0% during the forecast period.
Which key companies operate in Global pH Sensors Market?
-> Key players include Endress+Hauser, Emerson Electric, Honeywell International, ABB Ltd., and Yokogawa Electric Corporation, among others.
What are the key growth drivers?
-> Key growth drivers include stringent environmental regulations, increasing demand from water & wastewater treatment, and expansion of the pharmaceutical and food & beverages industries.
Which region dominates the market?
-> North America is the largest market, holding a share of about 40%, followed by Europe and Asia-Pacific.
What are the emerging trends?
-> Emerging trends include development of smart pH sensors with IoT connectivity, miniaturization of devices, and increased adoption of ISFET technology.

Get Sample Report PDF for Exclusive Insights
Report Sample Includes
- Table of Contents
- List of Tables & Figures
- Charts, Research Methodology, and more...


