Personal Electronic Die Cutting Market, Global Business Strategies 2026-2033

Personal Electronic Die Cutting Market was valued at USD 1.21 billion in 2025 and is projected to grow from USD 1.35 billion in 2026 to USD 2.62 billion by 2033, exhibiting a CAGR of 12.0% during the forecast period.

PDF Icon Download Sample Report PDF
  • Quick Dispatch

    All Orders

  • Secure Payment

    100% Secure Payment

Price range: $1,500.00 through $4,250.00

Clear

Market Insights

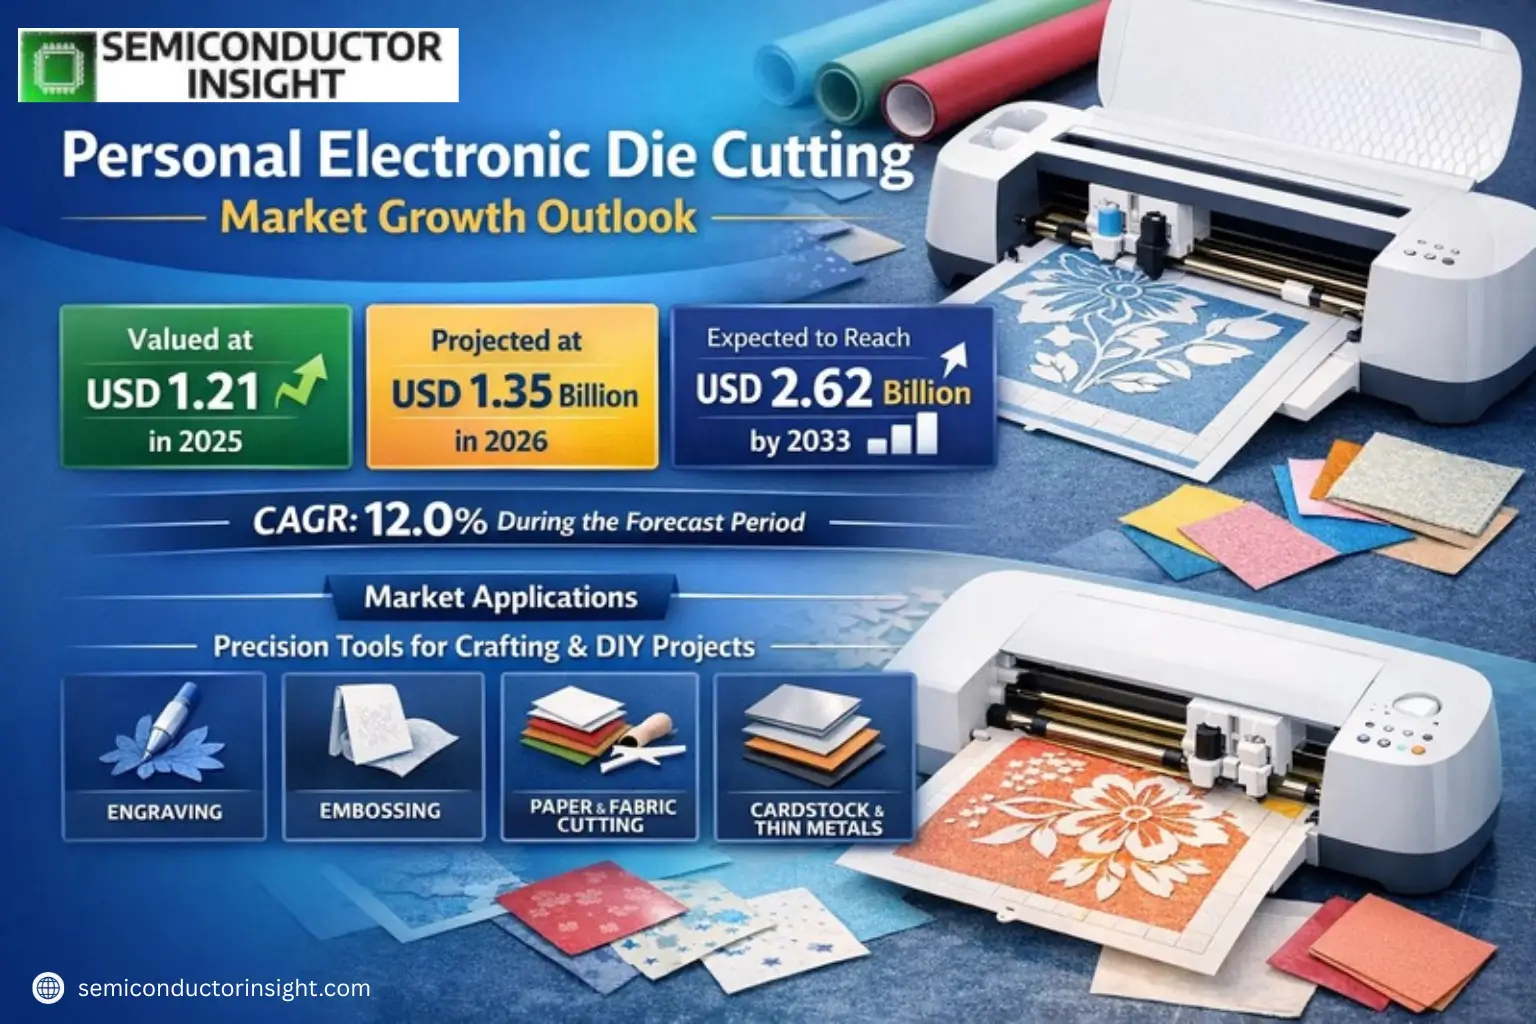
Global Personal Electronic Die Cutting Market was valued at USD 1.21 billion in 2025 and is projected to grow from USD 1.35 billion in 2026 to USD 2.62 billion by 2033, exhibiting a CAGR of 12.0% during the forecast period.

Personal Electronic Die Cutting machines are precision tools used for crafting applications such as engraving, embossing, and cutting materials like paper, fabric, cardstock, and thin metals. These devices operate via electric power and are controlled through computer software or specialized cartridges, eliminating the need for traditional steel dies by utilizing an internal blade mechanism.

The market growth is driven by rising DIY culture and increasing demand for customized crafts, supported by technological advancements in machine precision and multifunctionality. Key players like Cricut dominate the industry with over 60% market share, while North America leads regional adoption with a 70% share due to strong consumer engagement in hobbyist activities.

Xyz market size & forecast

MARKET DRIVERS

Growing DIY Crafting Trend Boosts Demand

Personal Electronic Die Cutting Market is experiencing significant growth due to the rising popularity of DIY crafting and scrapbooking. As more consumers engage in home-based creative projects, demand for efficient cutting tools like electronic die cutters has increased by approximately 18% annually. These devices offer precision-cutting capabilities for materials ranging from paper to vinyl, appealing to both hobbyists and small businesses.

Technological Advancements Drive Innovation

Manufacturers are introducing smart features such as Bluetooth connectivity, mobile app integration, and AI-assisted design templates in Personal Electronic Die Cutting machines. The integration of touchscreen interfaces and cloud storage for designs has contributed to a 25% increase in premium product sales over the last three years.

Additionally, the shift toward compact, space-saving designs has made these machines more accessible to urban crafters with limited workspace, further expanding the market.

MARKET CHALLENGES

High Initial Investment Limits Adoption

Premium Personal Electronic Die Cutting machines can cost between USD 200-USD 600, creating a barrier for casual crafters. Approximately 35% of potential buyers hesitate due to the upfront cost, despite long-term savings on material waste and manual labor. The learning curve associated with advanced software features also deters some traditional crafters.

Other Challenges

Material Compatibility Issues
Some machines struggle with cutting thicker materials like leather or chipboard, limiting their versatility compared to industrial counterparts. Ongoing R&D efforts focus on expanding material options while maintaining safety for home use.

MARKET RESTRAINTS

Competition from Traditional Crafting Tools

Despite technological advancements, manual die-cutting systems still hold approximately 28% market share due to lower costs and simpler operation. Many small-scale crafters continue using basic tools like scissors, punches, and manual die presses for simple projects, particularly in developing markets where electronic versions remain cost-prohibitive.

MARKET OPPORTUNITIES

Expansion into Educational and Small Business Segments

Schools and small businesses represent a growing market segment for personal electronic die cutters, accounting for nearly 15% of current sales. Educational institutions are incorporating these tools into STEM/STEAM programs, while small businesses use them for creating custom packaging, invitations, and signage. Manufacturers developing educational bundles with curriculum-aligned designs could capture more of this growing segment.


Personal Electronic Die Cutting Market Trends

Market Growth and Projections

Global Personal Electronic Die Cutting Market reached USD 1,207 million in 2025 and is projected to grow to USD 2,620 million by 2033, expanding at a CAGR of 12.0%. North America dominates the market with over 70% share, driven by strong adoption among hobbyists and small businesses. Machines without LCD displays currently hold an 80% market share due to their affordability, while home use accounts for 50% of total demand.

Other Trends

Technology Integration and Smart Features

Leading manufacturers are focusing on integrating scanning, printing, and engraving capabilities into single devices. Cloud-based design platforms and mobile app controls are emerging as key differentiators. Cricut, holding 60% market share, has pioneered wireless operation and material sensors for automated blade adjustments.

Sustainability and Miniaturization

Environmental considerations are driving demand for recyclable machine components and energy-efficient operation. Portable models under 5 lbs are gaining traction, with battery-powered units growing at 18% annually. The market sees increasing preference for compact designs that maintain cutting precision while reducing workspace requirements.

E-commerce Expansion and Market Education

Online channels now account for 65% of personal die cutter sales globally. Video tutorials and platform-integrated design marketplaces have lowered the barrier to entry for new users. However, awareness remains below 40% in emerging markets, presenting significant growth opportunities.

Challenges and Constraints

Price sensitivity affects adoption in price-conscious markets, with 68% of consumers considering machines above USD 300 as premium purchases. Standardization issues persist across software platforms, while safety certifications add 15-20% to production costs. Manufacturers are addressing these through installment payment options and universal file format support.

COMPETITIVE LANDSCAPE

Key Industry Players

Dominance of Cricut and Strategic Positioning of Niche Players

Cricut dominates the Personal Electronic Die Cutting Market with over 60% global share, leveraging its strong brand recognition, extensive product portfolio, and integrated software ecosystem. The company’s machines are widely adopted in North America, which accounts for 70% of the global market. Competitors like Brother and Silhouette America hold smaller but significant shares, competing through technological innovations and specialized applications.

Niche players such as Sizzix and Crafter’s Companion focus on specific market segments Sizzix excels in craft-focused machines with proprietary dies, while Crafter’s Companion targets professional crafters with high-precision models. Emerging brands like Pazzles and Craftwell emphasize affordability and compatibility with third-party materials, appealing to budget-conscious hobbyists.

List of Key Personal Electronic Die Cutting Companies Profiled

Segment Analysis:

Segment Category Sub-Segments Key Insights
By Type
  • With LCD Display
  • Without LCD Display
Without LCD Display dominates due to:

  • Lower production costs enabling competitive pricing for mainstream consumers
  • Established user familiarity with computer/tablet-based design interfaces
  • Longer product lifecycle as LCD components are prone to obsolescence
By Application
  • Home Use
  • School & Professional Use
  • Small Business Use
  • Others
Home Use leads application segments because:

  • Rapid growth of hobbyist communities and DIY culture globally
  • Expanding demand for personalized home decor and craft projects
  • Educational benefits for children’s creative development driving parental purchases
By End User
  • Hobbyists
  • Educators
  • Professional Crafters
Hobbyists represent the core user base as:

  • Crafting communities actively share project ideas and machine techniques online
  • Social media platforms enable viral spread of creative applications
  • Manufacturers target this group with accessible tutorials and starter kits
By Technology Level
  • Basic Die Cutters
  • Smart Connected Machines
  • Multi-functional Systems
Basic Die Cutters maintain strongest adoption due to:

  • Simplicity of use appealing to first-time buyers and occasional users
  • Reliable performance for fundamental cutting/embossing tasks
  • Lower maintenance requirements compared to advanced systems
By Sales Channel
  • E-commerce Platforms
  • Craft Specialty Stores
  • Direct Manufacturer Sales
E-commerce Platforms are transforming distribution through:

  • Convenient access to detailed product comparisons and customer reviews
  • Bundled offerings with materials and accessories enhancing value perception
  • Regular promotions and financing options reducing purchase barriers

Regional Analysis: Global Personal Electronic Die Cutting Market

North America

North America dominates the Personal Electronic Die Cutting Market with strong consumer adoption and technological leadership. The region benefits from high craft culture penetration, widespread e-commerce platforms specializing in craft supplies, and continuous product innovation from domestic manufacturers. Key markets like the United States and Canada show particularly strong demand for premium electronic die cutting machines with smart connectivity features. Manufacturer initiatives focusing on user-friendly interfaces and compatibility with diverse crafting materials have propelled market growth. The presence of major craft retailers providing dedicated sections for Personal Electronic Die Cutting systems further accelerates market penetration across both hobbyist and professional segments.

Technology Adoption
North American consumers show rapid adoption of advanced features like Bluetooth connectivity, touchscreen interfaces, and cloud-based design libraries, making the region the testing ground for next-gen Personal Electronic Die Cutting technologies.
Distribution Channels
Specialty craft stores maintain strong physical presence while online platforms see explosive growth, with marketplaces offering comprehensive tutorials and design bundles alongside machine sales to drive adoption.
Competitive Landscape
The market features intense competition between established craft brands and tech-focused startups, with frequent product refreshes and aggressive marketing campaigns during peak crafting seasons.
Consumer Trends
Growing popularity of DIY home decor and personalized gifting fuels demand, with consumers showing willingness to invest in mid-range electronic die cutting systems with versatile capabilities.

Europe
Europe represents a mature yet steadily growing market for Personal Electronic Die Cutting Machines, characterized by strong craft traditions and environmental consciousness. Germany and UK lead regional adoption, with consumers favoring energy-efficient models and sustainable material compatibility. The market sees increasing integration with traditional crafting techniques, blending digital precision with artisanal approaches. European manufacturers emphasize compact designs suitable for smaller living spaces, while strict product safety regulations ensure high build quality standards across all price points.

Asia-Pacific
The Asia-Pacific region demonstrates the fastest growth in Personal Electronic Die Cutting adoption, driven by expanding middle-class populations and digital crafting trends. Japan and South Korea show strong preference for space-saving multi-functional devices, while emerging markets like India exhibit growing interest in entry-level models. Local manufacturers compete intensely on price while gradually improving technical specifications, creating a vibrant market with diverse product offerings catering to various consumer segments.

South America
South America’s Personal Electronic Die Cutting Market remains in growth phase, with Brazil and Argentina showing promising adoption rates. Economic factors influence purchasing decisions, making affordable models with basic functionality popular. The market sees increasing availability through specialist importers and growing awareness through social media crafting communities, though infrastructure challenges affect after-sales service networks in some areas.

Middle East & Africa
The Middle Eastern market focuses on premium Personal Electronic Die Cutting Machines, particularly in GCC countries where crafting has gained popularity as a leisure activity. South Africa shows gradual market development, with adoption concentrated in urban centers. Across the region, electronic die cutting systems are increasingly positioned as creative tools for small businesses alongside hobbyist use, though import dependencies affect pricing and availability.

Report Scope

This market research report provides a comprehensive analysis of the Personal Electronic Die Cutting Market, covering the forecast period 2025–2033. It offers detailed insights into market dynamics, technological advancements, competitive landscape, and key trends shaping the industry.

Key focus areas of the report include:

  • Market Overview: The report begins with an overview outlining its current market scenario, key growth indicators, and industry transformation drivers. It discusses macroeconomic factors, demand–supply balance, regulatory landscape, and the strategic role of Personal Electronic Die Cutting machines in supporting creative industries such as crafting, home decor, fashion accessories, and educational projects.
  • Market Size & Forecast: Historical data and future projections for revenue, unit shipments, and market value across major regions and segments.
  • Segmentation Analysis: Detailed breakdown by product type, technology, application, and end-user industry to identify high-growth segments and investment opportunities.
  • Regional Insights: Insights into market performance across North America, Europe, Asia-Pacific, Latin America, and the Middle East & Africa, including country-level analysis where relevant.
  • Competitive Landscape: Profiles of leading market participants, including their product offerings, R&D focus, manufacturing capacity, pricing strategies, and recent developments such as mergers, acquisitions, and partnerships.
  • Technology Trends & Innovation: Assessment of emerging technologies, integration of smart features, design software advancements, and evolving industry standards.
  • Market Drivers & Restraints: Evaluation of factors driving market growth along with challenges, supply chain constraints, regulatory issues, and market-entry barriers.
  • Stakeholder Insights: Insights for manufacturers, distributors, retailers, investors, and policymakers regarding the evolving ecosystem and strategic opportunities.

Primary and secondary research methods are employed, including interviews with industry experts, data from verified sources, and real-time market intelligence to ensure the accuracy and reliability of the insights presented.

FREQUENTLY ASKED QUESTIONS:

What is the current market size of Personal Electronic Die Cutting Market?

-> Personal Electronic Die Cutting Market was valued at USD 1.21 billion in 2025 and is projected to grow from USD 1.35 billion in 2026 to USD 2.62 billion by 2033, exhibiting a CAGR of 12.0% during the forecast period.

Which key companies operate in Personal Electronic Die Cutting Market?

-> Key players include Cricut (60% market share), Brother, Silhouette America, Sizzix, Crafter’s Companion, Pazzles, Silver Bullet Cutters, and Craftwell.

What are the key growth drivers?

-> Key growth drivers include rising popularity of DIY culture, technological advancements in cutting machines, increasing e-commerce penetration, and growing demand for customized products.

Which region dominates the market?

-> North America is the largest market with over 70% share, followed by Europe. The Asia-Pacific region is expected to show significant growth in coming years.

What are the emerging trends?

-> Emerging trends include integration of smart features, eco-friendly materials, miniaturization of devices, and cloud-based design capabilities.

Personal Electronic Die Cutting Market, Global Business Strategies 2026-2033

Get Sample Report PDF for Exclusive Insights

Report Sample Includes

  • Table of Contents
  • List of Tables & Figures
  • Charts, Research Methodology, and more...
PDF Icon Download Sample Report PDF
License Type

Corporate License, Excel License, PDF and Excel Databook License

Download Sample Report

Table of Content

1 Introduction to Research & Analysis Reports
1.1 Personal Electronic Die Cutting Market Definition
1.2 Market Segments
1.2.1 Segment by Type
1.2.2 Segment by Application
1.3 Global Personal Electronic Die Cutting Market Overview
1.4 Features & Benefits of This Report
1.5 Methodology & Sources of Information
1.5.1 Research Methodology
1.5.2 Research Process
1.5.3 Base Year
1.5.4 Report Assumptions & Caveats
2 Global Personal Electronic Die Cutting Overall Market Size
2.1 Global Personal Electronic Die Cutting Market Size: 2024 VS 2032
2.2 Global Personal Electronic Die Cutting Market Size, Prospects & Forecasts: 2020-2032
2.3 Global Personal Electronic Die Cutting Sales: 2020-2032
3 Company Landscape
3.1 Top Personal Electronic Die Cutting Players in Global Market
3.2 Top Global Personal Electronic Die Cutting Companies Ranked by Revenue
3.3 Global Personal Electronic Die Cutting Revenue by Companies
3.4 Global Personal Electronic Die Cutting Sales by Companies
3.5 Global Personal Electronic Die Cutting Price by Manufacturer (2020-2025)
3.6 Top 3 and Top 5 Personal Electronic Die Cutting Companies in Global Market, by Revenue in 2024
3.7 Global Manufacturers Personal Electronic Die Cutting Product Type
3.8 Tier 1, Tier 2, and Tier 3 Personal Electronic Die Cutting Players in Global Market
3.8.1 List of Global Tier 1 Personal Electronic Die Cutting Companies
3.8.2 List of Global Tier 2 and Tier 3 Personal Electronic Die Cutting Companies
4 Sights by Product
4.1 Overview
4.1.1 Segment by Type – Global Personal Electronic Die Cutting Market Size Markets, 2024 & 2032
4.1.2 with LCD Display
4.1.3 without LCD Display
4.2 Segment by Type – Global Personal Electronic Die Cutting Revenue & Forecasts
4.2.1 Segment by Type – Global Personal Electronic Die Cutting Revenue, 2020-2025
4.2.2 Segment by Type – Global Personal Electronic Die Cutting Revenue, 2026-2032
4.2.3 Segment by Type – Global Personal Electronic Die Cutting Revenue Market Share, 2020-2032
4.3 Segment by Type – Global Personal Electronic Die Cutting Sales & Forecasts
4.3.1 Segment by Type – Global Personal Electronic Die Cutting Sales, 2020-2025
4.3.2 Segment by Type – Global Personal Electronic Die Cutting Sales, 2026-2032
4.3.3 Segment by Type – Global Personal Electronic Die Cutting Sales Market Share, 2020-2032
4.4 Segment by Type – Global Personal Electronic Die Cutting Price (Manufacturers Selling Prices), 2020-2032
5 Sights by Application
5.1 Overview
5.1.1 Segment by Application – Global Personal Electronic Die Cutting Market Size, 2024 & 2032
5.1.2 Home Use
5.1.3 School & Professional Use
5.2 Segment by Application – Global Personal Electronic Die Cutting Revenue & Forecasts
5.2.1 Segment by Application – Global Personal Electronic Die Cutting Revenue, 2020-2025
5.2.2 Segment by Application – Global Personal Electronic Die Cutting Revenue, 2026-2032
5.2.3 Segment by Application – Global Personal Electronic Die Cutting Revenue Market Share, 2020-2032
5.3 Segment by Application – Global Personal Electronic Die Cutting Sales & Forecasts
5.3.1 Segment by Application – Global Personal Electronic Die Cutting Sales, 2020-2025
5.3.2 Segment by Application – Global Personal Electronic Die Cutting Sales, 2026-2032
5.3.3 Segment by Application – Global Personal Electronic Die Cutting Sales Market Share, 2020-2032
5.4 Segment by Application – Global Personal Electronic Die Cutting Price (Manufacturers Selling Prices), 2020-2032
6 Sights by Region
6.1 By Region – Global Personal Electronic Die Cutting Market Size, 2024 & 2032
6.2 By Region – Global Personal Electronic Die Cutting Revenue & Forecasts
6.2.1 By Region – Global Personal Electronic Die Cutting Revenue, 2020-2025
6.2.2 By Region – Global Personal Electronic Die Cutting Revenue, 2026-2032
6.2.3 By Region – Global Personal Electronic Die Cutting Revenue Market Share, 2020-2032
6.3 By Region – Global Personal Electronic Die Cutting Sales & Forecasts
6.3.1 By Region – Global Personal Electronic Die Cutting Sales, 2020-2025
6.3.2 By Region – Global Personal Electronic Die Cutting Sales, 2026-2032
6.3.3 By Region – Global Personal Electronic Die Cutting Sales Market Share, 2020-2032
6.4 North America
6.4.1 By Country – North America Personal Electronic Die Cutting Revenue, 2020-2032
6.4.2 By Country – North America Personal Electronic Die Cutting Sales, 2020-2032
6.4.3 United States Personal Electronic Die Cutting Market Size, 2020-2032
6.4.4 Canada Personal Electronic Die Cutting Market Size, 2020-2032
6.4.5 Mexico Personal Electronic Die Cutting Market Size, 2020-2032
6.5 Europe
6.5.1 By Country – Europe Personal Electronic Die Cutting Revenue, 2020-2032
6.5.2 By Country – Europe Personal Electronic Die Cutting Sales, 2020-2032
6.5.3 Germany Personal Electronic Die Cutting Market Size, 2020-2032
6.5.4 France Personal Electronic Die Cutting Market Size, 2020-2032
6.5.5 U.K. Personal Electronic Die Cutting Market Size, 2020-2032
6.5.6 Italy Personal Electronic Die Cutting Market Size, 2020-2032
6.5.7 Russia Personal Electronic Die Cutting Market Size, 2020-2032
6.5.8 Nordic Countries Personal Electronic Die Cutting Market Size, 2020-2032
6.5.9 Benelux Personal Electronic Die Cutting Market Size, 2020-2032
6.6 Asia
6.6.1 By Region – Asia Personal Electronic Die Cutting Revenue, 2020-2032
6.6.2 By Region – Asia Personal Electronic Die Cutting Sales, 2020-2032
6.6.3 China Personal Electronic Die Cutting Market Size, 2020-2032
6.6.4 Japan Personal Electronic Die Cutting Market Size, 2020-2032
6.6.5 South Korea Personal Electronic Die Cutting Market Size, 2020-2032
6.6.6 Southeast Asia Personal Electronic Die Cutting Market Size, 2020-2032
6.6.7 India Personal Electronic Die Cutting Market Size, 2020-2032
6.7 South America
6.7.1 By Country – South America Personal Electronic Die Cutting Revenue, 2020-2032
6.7.2 By Country – South America Personal Electronic Die Cutting Sales, 2020-2032
6.7.3 Brazil Personal Electronic Die Cutting Market Size, 2020-2032
6.7.4 Argentina Personal Electronic Die Cutting Market Size, 2020-2032
6.8 Middle East & Africa
6.8.1 By Country – Middle East & Africa Personal Electronic Die Cutting Revenue, 2020-2032
6.8.2 By Country – Middle East & Africa Personal Electronic Die Cutting Sales, 2020-2032
6.8.3 Turkey Personal Electronic Die Cutting Market Size, 2020-2032
6.8.4 Israel Personal Electronic Die Cutting Market Size, 2020-2032
6.8.5 Saudi Arabia Personal Electronic Die Cutting Market Size, 2020-2032
6.8.6 UAE Personal Electronic Die Cutting Market Size, 2020-2032
7 Manufacturers & Brands Profiles
7.1 Cricut
7.1.1 Cricut Company Summary
7.1.2 Cricut Business Overview
7.1.3 Cricut Personal Electronic Die Cutting Major Product Offerings
7.1.4 Cricut Personal Electronic Die Cutting Sales and Revenue in Global (2020-2025)
7.1.5 Cricut Key News & Latest Developments
7.2 Brother
7.2.1 Brother Company Summary
7.2.2 Brother Business Overview
7.2.3 Brother Personal Electronic Die Cutting Major Product Offerings
7.2.4 Brother Personal Electronic Die Cutting Sales and Revenue in Global (2020-2025)
7.2.5 Brother Key News & Latest Developments
7.3 Silhouette America
7.3.1 Silhouette America Company Summary
7.3.2 Silhouette America Business Overview
7.3.3 Silhouette America Personal Electronic Die Cutting Major Product Offerings
7.3.4 Silhouette America Personal Electronic Die Cutting Sales and Revenue in Global (2020-2025)
7.3.5 Silhouette America Key News & Latest Developments
7.4 Sizzix
7.4.1 Sizzix Company Summary
7.4.2 Sizzix Business Overview
7.4.3 Sizzix Personal Electronic Die Cutting Major Product Offerings
7.4.4 Sizzix Personal Electronic Die Cutting Sales and Revenue in Global (2020-2025)
7.4.5 Sizzix Key News & Latest Developments
7.5 Crafter’s Companion
7.5.1 Crafter’s Companion Company Summary
7.5.2 Crafter’s Companion Business Overview
7.5.3 Crafter’s Companion Personal Electronic Die Cutting Major Product Offerings
7.5.4 Crafter’s Companion Personal Electronic Die Cutting Sales and Revenue in Global (2020-2025)
7.5.5 Crafter’s Companion Key News & Latest Developments
7.6 Pazzles
7.6.1 Pazzles Company Summary
7.6.2 Pazzles Business Overview
7.6.3 Pazzles Personal Electronic Die Cutting Major Product Offerings
7.6.4 Pazzles Personal Electronic Die Cutting Sales and Revenue in Global (2020-2025)
7.6.5 Pazzles Key News & Latest Developments
7.7 Silver Bullet Cutters
7.7.1 Silver Bullet Cutters Company Summary
7.7.2 Silver Bullet Cutters Business Overview
7.7.3 Silver Bullet Cutters Personal Electronic Die Cutting Major Product Offerings
7.7.4 Silver Bullet Cutters Personal Electronic Die Cutting Sales and Revenue in Global (2020-2025)
7.7.5 Silver Bullet Cutters Key News & Latest Developments
7.8 Craftwell
7.8.1 Craftwell Company Summary
7.8.2 Craftwell Business Overview
7.8.3 Craftwell Personal Electronic Die Cutting Major Product Offerings
7.8.4 Craftwell Personal Electronic Die Cutting Sales and Revenue in Global (2020-2025)
7.8.5 Craftwell Key News & Latest Developments
8 Global Personal Electronic Die Cutting Production Capacity, Analysis
8.1 Global Personal Electronic Die Cutting Production Capacity, 2020-2032
8.2 Personal Electronic Die Cutting Production Capacity of Key Manufacturers in Global Market
8.3 Global Personal Electronic Die Cutting Production by Region
9 Key Market Trends, Opportunity, Drivers and Restraints
9.1 Market Opportunities & Trends
9.2 Market Drivers
9.3 Market Restraints
10 Personal Electronic Die Cutting Supply Chain Analysis
10.1 Personal Electronic Die Cutting Industry Value Chain
10.2 Personal Electronic Die Cutting Upstream Market
10.3 Personal Electronic Die Cutting Downstream and Clients
10.4 Marketing Channels Analysis
10.4.1 Marketing Channels
10.4.2 Personal Electronic Die Cutting Distributors and Sales Agents in Global
11 Conclusion
12 Appendix
12.1 Note
12.2 Examples of Clients
12.3 DisclaimerList of Tables
Table 1. Key Players of Personal Electronic Die Cutting in Global Market
Table 2. Top Personal Electronic Die Cutting Players in Global Market, Ranking by Revenue (2024)
Table 3. Global Personal Electronic Die Cutting Revenue by Companies, (US$, Mn), 2020-2025
Table 4. Global Personal Electronic Die Cutting Revenue Share by Companies, 2020-2025
Table 5. Global Personal Electronic Die Cutting Sales by Companies, (K Units), 2020-2025
Table 6. Global Personal Electronic Die Cutting Sales Share by Companies, 2020-2025
Table 7. Key Manufacturers Personal Electronic Die Cutting Price (2020-2025) & (USD/Unit)
Table 8. Global Manufacturers Personal Electronic Die Cutting Product Type
Table 9. List of Global Tier 1 Personal Electronic Die Cutting Companies, Revenue (US$, Mn) in 2024 and Market Share
Table 10. List of Global Tier 2 and Tier 3 Personal Electronic Die Cutting Companies, Revenue (US$, Mn) in 2024 and Market Share
Table 11. Segment by Type – Global Personal Electronic Die Cutting Revenue, (US$, Mn), 2024 & 2032
Table 12. Segment by Type – Global Personal Electronic Die Cutting Revenue (US$, Mn), 2020-2025
Table 13. Segment by Type – Global Personal Electronic Die Cutting Revenue (US$, Mn), 2026-2032
Table 14. Segment by Type – Global Personal Electronic Die Cutting Sales (K Units), 2020-2025
Table 15. Segment by Type – Global Personal Electronic Die Cutting Sales (K Units), 2026-2032
Table 16. Segment by Application – Global Personal Electronic Die Cutting Revenue, (US$, Mn), 2024 & 2032
Table 17. Segment by Application – Global Personal Electronic Die Cutting Revenue, (US$, Mn), 2020-2025
Table 18. Segment by Application – Global Personal Electronic Die Cutting Revenue, (US$, Mn), 2026-2032
Table 19. Segment by Application – Global Personal Electronic Die Cutting Sales, (K Units), 2020-2025
Table 20. Segment by Application – Global Personal Electronic Die Cutting Sales, (K Units), 2026-2032
Table 21. By Region – Global Personal Electronic Die Cutting Revenue, (US$, Mn), 2025-2032
Table 22. By Region – Global Personal Electronic Die Cutting Revenue, (US$, Mn), 2020-2025
Table 23. By Region – Global Personal Electronic Die Cutting Revenue, (US$, Mn), 2026-2032
Table 24. By Region – Global Personal Electronic Die Cutting Sales, (K Units), 2020-2025
Table 25. By Region – Global Personal Electronic Die Cutting Sales, (K Units), 2026-2032
Table 26. By Country – North America Personal Electronic Die Cutting Revenue, (US$, Mn), 2020-2025
Table 27. By Country – North America Personal Electronic Die Cutting Revenue, (US$, Mn), 2026-2032
Table 28. By Country – North America Personal Electronic Die Cutting Sales, (K Units), 2020-2025
Table 29. By Country – North America Personal Electronic Die Cutting Sales, (K Units), 2026-2032
Table 30. By Country – Europe Personal Electronic Die Cutting Revenue, (US$, Mn), 2020-2025
Table 31. By Country – Europe Personal Electronic Die Cutting Revenue, (US$, Mn), 2026-2032
Table 32. By Country – Europe Personal Electronic Die Cutting Sales, (K Units), 2020-2025
Table 33. By Country – Europe Personal Electronic Die Cutting Sales, (K Units), 2026-2032
Table 34. By Region – Asia Personal Electronic Die Cutting Revenue, (US$, Mn), 2020-2025
Table 35. By Region – Asia Personal Electronic Die Cutting Revenue, (US$, Mn), 2026-2032
Table 36. By Region – Asia Personal Electronic Die Cutting Sales, (K Units), 2020-2025
Table 37. By Region – Asia Personal Electronic Die Cutting Sales, (K Units), 2026-2032
Table 38. By Country – South America Personal Electronic Die Cutting Revenue, (US$, Mn), 2020-2025
Table 39. By Country – South America Personal Electronic Die Cutting Revenue, (US$, Mn), 2026-2032
Table 40. By Country – South America Personal Electronic Die Cutting Sales, (K Units), 2020-2025
Table 41. By Country – South America Personal Electronic Die Cutting Sales, (K Units), 2026-2032
Table 42. By Country – Middle East & Africa Personal Electronic Die Cutting Revenue, (US$, Mn), 2020-2025
Table 43. By Country – Middle East & Africa Personal Electronic Die Cutting Revenue, (US$, Mn), 2026-2032
Table 44. By Country – Middle East & Africa Personal Electronic Die Cutting Sales, (K Units), 2020-2025
Table 45. By Country – Middle East & Africa Personal Electronic Die Cutting Sales, (K Units), 2026-2032
Table 46. Cricut Company Summary
Table 47. Cricut Personal Electronic Die Cutting Product Offerings
Table 48. Cricut Personal Electronic Die Cutting Sales (K Units), Revenue (US$, Mn) and Average Price (USD/Unit) & (2020-2025)
Table 49. Cricut Key News & Latest Developments
Table 50. Brother Company Summary
Table 51. Brother Personal Electronic Die Cutting Product Offerings
Table 52. Brother Personal Electronic Die Cutting Sales (K Units), Revenue (US$, Mn) and Average Price (USD/Unit) & (2020-2025)
Table 53. Brother Key News & Latest Developments
Table 54. Silhouette America Company Summary
Table 55. Silhouette America Personal Electronic Die Cutting Product Offerings
Table 56. Silhouette America Personal Electronic Die Cutting Sales (K Units), Revenue (US$, Mn) and Average Price (USD/Unit) & (2020-2025)
Table 57. Silhouette America Key News & Latest Developments
Table 58. Sizzix Company Summary
Table 59. Sizzix Personal Electronic Die Cutting Product Offerings
Table 60. Sizzix Personal Electronic Die Cutting Sales (K Units), Revenue (US$, Mn) and Average Price (USD/Unit) & (2020-2025)
Table 61. Sizzix Key News & Latest Developments
Table 62. Crafter’s Companion Company Summary
Table 63. Crafter’s Companion Personal Electronic Die Cutting Product Offerings
Table 64. Crafter’s Companion Personal Electronic Die Cutting Sales (K Units), Revenue (US$, Mn) and Average Price (USD/Unit) & (2020-2025)
Table 65. Crafter’s Companion Key News & Latest Developments
Table 66. Pazzles Company Summary
Table 67. Pazzles Personal Electronic Die Cutting Product Offerings
Table 68. Pazzles Personal Electronic Die Cutting Sales (K Units), Revenue (US$, Mn) and Average Price (USD/Unit) & (2020-2025)
Table 69. Pazzles Key News & Latest Developments
Table 70. Silver Bullet Cutters Company Summary
Table 71. Silver Bullet Cutters Personal Electronic Die Cutting Product Offerings
Table 72. Silver Bullet Cutters Personal Electronic Die Cutting Sales (K Units), Revenue (US$, Mn) and Average Price (USD/Unit) & (2020-2025)
Table 73. Silver Bullet Cutters Key News & Latest Developments
Table 74. Craftwell Company Summary
Table 75. Craftwell Personal Electronic Die Cutting Product Offerings
Table 76. Craftwell Personal Electronic Die Cutting Sales (K Units), Revenue (US$, Mn) and Average Price (USD/Unit) & (2020-2025)
Table 77. Craftwell Key News & Latest Developments
Table 78. Personal Electronic Die Cutting Capacity of Key Manufacturers in Global Market, 2023-2025 (K Units)
Table 79. Global Personal Electronic Die Cutting Capacity Market Share of Key Manufacturers, 2023-2025
Table 80. Global Personal Electronic Die Cutting Production by Region, 2020-2025 (K Units)
Table 81. Global Personal Electronic Die Cutting Production by Region, 2026-2032 (K Units)
Table 82. Personal Electronic Die Cutting Market Opportunities & Trends in Global Market
Table 83. Personal Electronic Die Cutting Market Drivers in Global Market
Table 84. Personal Electronic Die Cutting Market Restraints in Global Market
Table 85. Personal Electronic Die Cutting Raw Materials
Table 86. Personal Electronic Die Cutting Raw Materials Suppliers in Global Market
Table 87. Typical Personal Electronic Die Cutting Downstream
Table 88. Personal Electronic Die Cutting Downstream Clients in Global Market
Table 89. Personal Electronic Die Cutting Distributors and Sales Agents in Global Market

List of Figures
Figure 1. Personal Electronic Die Cutting Product Picture
Figure 2. Personal Electronic Die Cutting Segment by Type in 2024
Figure 3. Personal Electronic Die Cutting Segment by Application in 2024
Figure 4. Global Personal Electronic Die Cutting Market Overview: 2024
Figure 5. Key Caveats
Figure 6. Global Personal Electronic Die Cutting Market Size: 2024 VS 2032 (US$, Mn)
Figure 7. Global Personal Electronic Die Cutting Revenue: 2020-2032 (US$, Mn)
Figure 8. Personal Electronic Die Cutting Sales in Global Market: 2020-2032 (K Units)
Figure 9. The Top 3 and 5 Players Market Share by Personal Electronic Die Cutting Revenue in 2024
Figure 10. Segment by Type – Global Personal Electronic Die Cutting Revenue, (US$, Mn), 2024 & 2032
Figure 11. Segment by Type – Global Personal Electronic Die Cutting Revenue Market Share, 2020-2032
Figure 12. Segment by Type – Global Personal Electronic Die Cutting Sales Market Share, 2020-2032
Figure 13. Segment by Type – Global Personal Electronic Die Cutting Price (USD/Unit), 2020-2032
Figure 14. Segment by Application – Global Personal Electronic Die Cutting Revenue, (US$, Mn), 2024 & 2032
Figure 15. Segment by Application – Global Personal Electronic Die Cutting Revenue Market Share, 2020-2032
Figure 16. Segment by Application – Global Personal Electronic Die Cutting Sales Market Share, 2020-2032
Figure 17. Segment by Application -Global Personal Electronic Die Cutting Price (USD/Unit), 2020-2032
Figure 18. By Region – Global Personal Electronic Die Cutting Revenue, (US$, Mn), 2025 & 2032
Figure 19. By Region – Global Personal Electronic Die Cutting Revenue Market Share, 2020 VS 2024 VS 2032
Figure 20. By Region – Global Personal Electronic Die Cutting Revenue Market Share, 2020-2032
Figure 21. By Region – Global Personal Electronic Die Cutting Sales Market Share, 2020-2032
Figure 22. By Country – North America Personal Electronic Die Cutting Revenue Market Share, 2020-2032
Figure 23. By Country – North America Personal Electronic Die Cutting Sales Market Share, 2020-2032
Figure 24. United States Personal Electronic Die Cutting Revenue, (US$, Mn), 2020-2032
Figure 25. Canada Personal Electronic Die Cutting Revenue, (US$, Mn), 2020-2032
Figure 26. Mexico Personal Electronic Die Cutting Revenue, (US$, Mn), 2020-2032
Figure 27. By Country – Europe Personal Electronic Die Cutting Revenue Market Share, 2020-2032
Figure 28. By Country – Europe Personal Electronic Die Cutting Sales Market Share, 2020-2032
Figure 29. Germany Personal Electronic Die Cutting Revenue, (US$, Mn), 2020-2032
Figure 30. France Personal Electronic Die Cutting Revenue, (US$, Mn), 2020-2032
Figure 31. U.K. Personal Electronic Die Cutting Revenue, (US$, Mn), 2020-2032
Figure 32. Italy Personal Electronic Die Cutting Revenue, (US$, Mn), 2020-2032
Figure 33. Russia Personal Electronic Die Cutting Revenue, (US$, Mn), 2020-2032
Figure 34. Nordic Countries Personal Electronic Die Cutting Revenue, (US$, Mn), 2020-2032
Figure 35. Benelux Personal Electronic Die Cutting Revenue, (US$, Mn), 2020-2032
Figure 36. By Region – Asia Personal Electronic Die Cutting Revenue Market Share, 2020-2032
Figure 37. By Region – Asia Personal Electronic Die Cutting Sales Market Share, 2020-2032
Figure 38. China Personal Electronic Die Cutting Revenue, (US$, Mn), 2020-2032
Figure 39. Japan Personal Electronic Die Cutting Revenue, (US$, Mn), 2020-2032
Figure 40. South Korea Personal Electronic Die Cutting Revenue, (US$, Mn), 2020-2032
Figure 41. Southeast Asia Personal Electronic Die Cutting Revenue, (US$, Mn), 2020-2032
Figure 42. India Personal Electronic Die Cutting Revenue, (US$, Mn), 2020-2032
Figure 43. By Country – South America Personal Electronic Die Cutting Revenue Market Share, 2020-2032
Figure 44. By Country – South America Personal Electronic Die Cutting Sales, Market Share, 2020-2032
Figure 45. Brazil Personal Electronic Die Cutting Revenue, (US$, Mn), 2020-2032
Figure 46. Argentina Personal Electronic Die Cutting Revenue, (US$, Mn), 2020-2032
Figure 47. By Country – Middle East & Africa Personal Electronic Die Cutting Revenue, Market Share, 2020-2032
Figure 48. By Country – Middle East & Africa Personal Electronic Die Cutting Sales, Market Share, 2020-2032
Figure 49. Turkey Personal Electronic Die Cutting Revenue, (US$, Mn), 2020-2032
Figure 50. Israel Personal Electronic Die Cutting Revenue, (US$, Mn), 2020-2032
Figure 51. Saudi Arabia Personal Electronic Die Cutting Revenue, (US$, Mn), 2020-2032
Figure 52. UAE Personal Electronic Die Cutting Revenue, (US$, Mn), 2020-2032
Figure 53. Global Personal Electronic Die Cutting Production Capacity (K Units), 2020-2032
Figure 54. The Percentage of Production Personal Electronic Die Cutting by Region, 2024 VS 2032
Figure 55. Personal Electronic Die Cutting Industry Value Chain
Figure 56. Marketing Channels