Optical-Based Turbidity Sensor Market, Trends, Business Strategies 2026-2034

Global Optical-Based Turbidity Sensor market was valued at USD 651 million in 2025 and is expected to reach USD 882 million by 2034, at a CAGR of 4.5% during the forecast period

PDF Icon Download Sample Report PDF
  • Quick Dispatch

    All Orders

  • Secure Payment

    100% Secure Payment

Price range: $1,500.00 through $4,250.00

Clear

Optical-Based Turbidity Sensor Market Insights

Global Optical-Based Turbidity Sensor market size was valued at USD 651 million in 2025. The market is projected to reach USD 882 million by 2034, exhibiting a CAGR of 4.5% during the forecast period.

An Optical-Based Turbidity Sensor is a device that uses optical principles to measure the turbidity, or degree of cloudiness or haziness, of a liquid. Turbidity is typically caused by the presence of suspended particles, such as dirt, clay, algae, or other substances, in the liquid. The sensor works by emitting a light beam into the liquid and then measuring the amount of light that is scattered or absorbed by the particles present. The more particles there are in the liquid, the more light will be scattered, resulting in a higher turbidity reading.

The market is experiencing steady growth due to several factors, including strict environmental regulations, rising demand for real-time water quality monitoring, and expanding applications in wastewater treatment and industrial processes. Furthermore, advancements in sensor accuracy and integration with IoT systems are driving adoption across sectors like beverages and pharmaceuticals. Initiatives by key players are fueling further expansion. The global key manufacturers of Optical-Based Turbidity Sensor include Aanderaa, Endress+Hauser, Process Instruments (PI), KROHNE Group, Willow Technologies, Mettler Toledo, OTT HydroMet, Optek, Campbell Scientific, and PASCO.
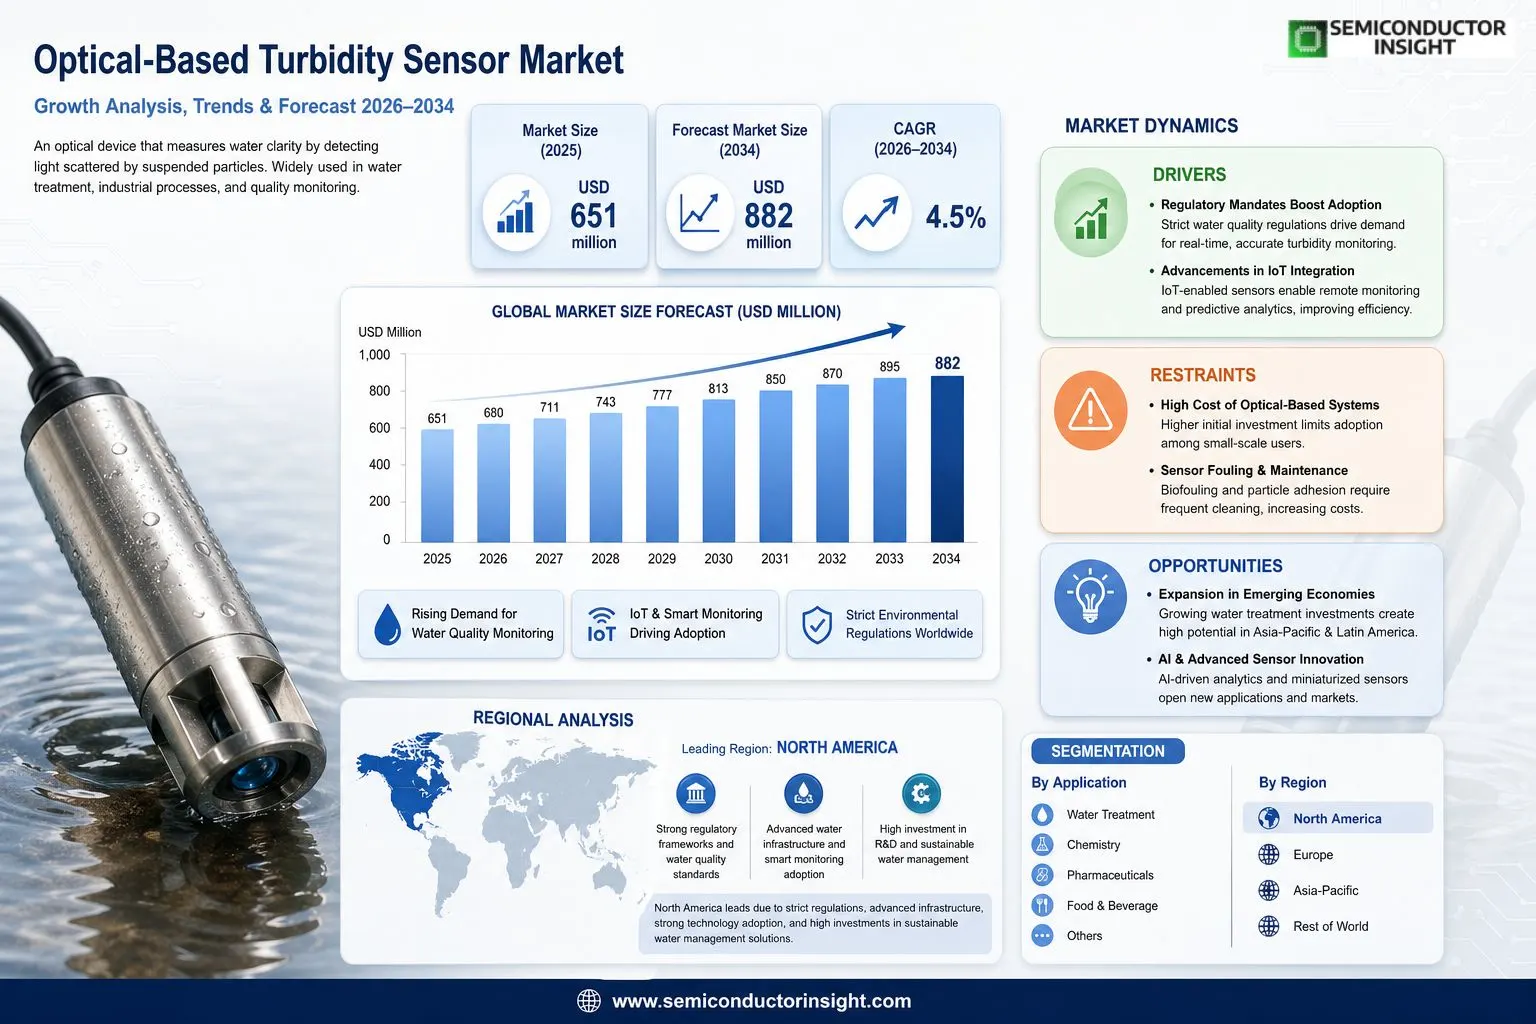
MARKET DRIVERS

Regulatory Mandates Boost Adoption

Stricter global regulations on water quality, such as those from the EPA and EU Water Framework Directive, are propelling demand in the Optical-Based Turbidity Sensor Market. These sensors provide precise, real-time measurements of suspended particles in water, essential for compliance in drinking water treatment and industrial discharges. With over 70% of municipalities now required to monitor turbidity levels continuously, adoption rates have surged by 12% annually in developed regions.

Advancements in IoT Integration

The integration of optical-based sensors with IoT platforms enables remote monitoring and predictive analytics, driving efficiency in wastewater management. In sectors like aquaculture and pharmaceuticals, where water clarity directly impacts operations, these technologies reduce manual interventions by up to 40%. Market growth is further supported by a projected CAGR of 7.5% through 2028, fueled by smart water networks.

Rising urbanization increases the need for scalable optical turbidity solutions in municipal water systems

Environmental awareness and corporate sustainability goals are accelerating investments, positioning the Optical-Based Turbidity Sensor Market for sustained expansion amid global water scarcity challenges.

MARKET CHALLENGES

Sensor Fouling and Maintenance

Optical-based turbidity sensors face significant hurdles from biofouling and particle adhesion, which can distort light scattering readings and require frequent cleaning. In harsh environments like rivers or industrial effluents, maintenance costs can escalate by 25%, deterring widespread deployment in the Optical-Based Turbidity Sensor Market despite their accuracy.

Other Challenges

High Calibration Demands

Regular calibration is essential due to variations in water composition, complicating operations in remote or resource-limited settings. This leads to downtime and skilled labor shortages, with studies indicating up to 15% of sensors needing recalibration monthly.Competition from electrochemical alternatives adds pressure, as they offer lower power needs, though lacking the non-contact precision of optical methods. Supply chain disruptions for LED components have also raised production costs by 10-15% post-pandemic.

MARKET RESTRAINTS

Cost Barriers for Small-Scale Users

Premium pricing of optical-based systems, often 2-3 times higher than ultrasonic counterparts, restrains penetration in cost-sensitive markets like agriculture and small municipalities. Initial investments exceed $5,000 per unit, limiting the Optical-Based Turbidity Sensor Market to large enterprises with budgets for advanced analytics.Technical limitations in extreme conditions, such as high turbidity levels above 1,000 NTU, cause signal saturation, reducing reliability. Regulatory approvals vary globally, delaying market entry in emerging economies where standards are evolving.Dependency on stable power and optics quality further hampers growth, with vulnerability to electromagnetic interference noted in 20% of field deployments, underscoring persistent restraints on broader adoption.

MARKET OPPORTUNITIES

Expansion in Emerging Economies

Rapid industrialization in Asia-Pacific and Latin America presents untapped potential, with water treatment investments projected to reach $200 billion by 2030. Optical-based sensors’ precision aligns with needs for river monitoring and urban supply, poised to capture 25% market share growth in these regions.Miniaturization and portable designs open doors for field testing in environmental research and disaster response, integrating with drones for real-time data. The Optical-Based Turbidity Sensor Market benefits from AI enhancements that automate fouling detection, improving uptime by 30%.Sustainable initiatives like UN SDG 6 for clean water drive partnerships with governments, fostering innovation in low-power, solar-compatible units for remote applications.

Optical-Based Turbidity Sensor Market Trends

Advancements in Digital Turbidity Sensors

In the Optical-Based Turbidity Sensor Market, a prominent trend is the accelerating shift toward digital turbidity sensors. These sensors offer enhanced data accuracy, real-time processing capabilities, and seamless integration with IoT-enabled monitoring systems. Manufacturers such as Endress+Hauser and Mettler Toledo are leading this transition by developing sensors that utilize advanced optical principles to detect light scattering from suspended particles more precisely than traditional analog models. This evolution supports industries requiring stringent compliance with water quality standards, enabling automated adjustments in processes to maintain optimal clarity levels in liquids.

Other Trends

Growing Demand in Water Treatment Applications

The water treatment sector continues to drive significant adoption of Optical-Based Turbidity Sensor Market solutions, as facilities prioritize efficient removal of suspended solids like dirt, clay, and algae. Sensors from key players including OTT HydroMet and KROHNE Group provide reliable measurements essential for coagulation, flocculation, and filtration processes. This trend reflects heightened regulatory pressures worldwide, pushing operators toward continuous turbidity monitoring to prevent contamination and ensure safe discharge.

Expansion in Pharmaceutical and Food & Beverage Segments

Beyond water treatment, the Optical-Based Turbidity Sensor Market sees robust growth in pharmaceuticals and food & beverage applications. In pharmaceuticals, precise turbidity control is vital for sterile liquid formulations, while in food & beverage production, it ensures product clarity and safety from particulate matter. Companies like Optek and Campbell Scientific are innovating with compact, hygienic designs tailored for these cleanroom environments, facilitating inline quality checks that minimize waste and downtime.

Regional Market Dynamics and Key Player Strategies

Regionally, the Optical-Based Turbidity Sensor Market exhibits strong momentum in North America and Asia, with North America benefiting from established infrastructure in the U.S. and Canada, and Asia propelled by rapid industrialization in China and India. Leading manufacturers,Aanderaa, Process Instruments (PI), Willow Technologies, and PASCO,are focusing on mergers, acquisitions, and product enhancements to capture larger shares. Industry surveys highlight ongoing developments in sensor durability for harsh environments, alongside challenges like calibration needs and competitive pricing pressures, shaping strategic investments for sustained growth.

COMPETITIVE LANDSCAPE

Key Industry Players

Dominant Manufacturers in the Optical-Based Turbidity Sensor Market

The Optical-Based Turbidity Sensor market features a competitive landscape led by established global instrumentation leaders such as Endress+Hauser and Mettler Toledo, which leverage advanced optical technologies for precise light scattering measurements in liquids. These top players command a significant revenue share, with the global top five manufacturers collectively holding a substantial portion of the market in 2025. The structure is moderately concentrated, characterized by innovation in digital and analog sensors tailored for water treatment, pharmaceuticals, and food & beverage applications, supported by robust R&D and integrated process automation solutions.

Beyond the frontrunners, niche and specialized firms like Aanderaa, OTT HydroMet, and KROHNE Group target environmental monitoring, hydrography, and industrial process control segments with rugged, high-reliability sensors. Players such as Process Instruments (PI), Optek, and Willow Technologies offer cost-competitive alternatives, focusing on customization and integration for chemistry and other niche uses. Educational and research-oriented companies including Campbell Scientific and PASCO contribute to market diversity, while ongoing mergers and technological advancements intensify competition across regions like North America and Europe.

List of Key Optical-Based Turbidity Sensor Companies Profiled

Segment Analysis:

Segment Category Sub-Segments Key Insights
By Type
  • Analog Turbidity Sensor
  • Digital Turbidity Sensor
Digital Turbidity Sensor

  • Excels in integration with contemporary automation systems, enabling seamless data exchange and advanced analytics capabilities.
  • Delivers enhanced signal stability and precision, crucial for environments with electromagnetic interference.
  • Supports remote configuration and diagnostics, reducing operational downtime and maintenance efforts.
  • Drives preference in new installations due to compatibility with Industry 4.0 standards and IoT ecosystems.
By Application
  • Water Treatment
  • Chemistry
  • Pharmaceuticals
  • Food & Beverage
  • Others
Water Treatment

  • Fundamental for process optimization in clarification stages, allowing precise control over coagulant dosing.
  • Ensures adherence to global water quality standards by providing continuous clarity assessments.
  • Facilitates rapid response to variations in influent quality, enhancing overall plant efficiency.
  • Empowers operators with actionable insights for backwash cycles and filter performance monitoring.
By End User
  • Municipal Water Utilities
  • Industrial Manufacturing Plants
  • Laboratory & Research Institutions
Municipal Water Utilities

  • Leads adoption through extensive networks requiring reliable, round-the-clock turbidity surveillance.
  • Prioritizes sensors with robust construction for deployment in diverse water sources from reservoirs to distribution systems.
  • Benefits from standardized integration with utility management software for regulatory reporting.
  • Fuels advancements in sensor longevity and anti-biofouling technologies for sustained accuracy.
By Installation Type
  • Submersible Sensors
  • Flow-Through Sensors
  • Portable/Handheld Sensors
Submersible Sensors

  • Ideal for immersive applications in rivers, lakes, and treatment basins where direct contact is necessary.
  • Features corrosion-resistant materials and self-cleaning mechanisms to combat biological growth.
  • Enables uninterrupted profiling of water columns for comprehensive environmental insights.
  • Gaining traction in aquaculture and stormwater management for its adaptability and durability.
By Optical Method
  • Nephelometric
  • Backscatter
  • Forward Scatter
Nephelometric

  • Serves as the benchmark for regulatory compliance in drinking water and effluent analysis worldwide.
  • Optimally measures light scattered at 90 degrees, excelling in low turbidity ranges with minimal interference.
  • Aligns with established standards like ISO 7027, ensuring consistent and comparable results.
  • Preferred in quality-sensitive sectors for its proven correlation to suspended solids content.

Regional Analysis: Optical-Based Turbidity Sensor Market

North America

North America dominates the Optical-Based Turbidity Sensor Market, driven by rigorous environmental regulations and sophisticated water management infrastructure. Agencies like the EPA enforce strict standards for turbidity levels in drinking water and wastewater, compelling utilities and industries to adopt advanced optical sensors for precise, non-contact measurements. The region’s mature technological ecosystem supports seamless integration of these sensors with IoT platforms and SCADA systems, enabling real-time monitoring and predictive maintenance. Key sectors such as municipal water treatment, food and beverage processing, and environmental agencies fuel demand through widespread deployment. Innovation hubs in the United States and Canada accelerate developments in compact, low-maintenance designs tailored for harsh conditions. Collaborative efforts between sensor manufacturers, research institutions, and government bodies foster customized solutions for stormwater runoff and aquaculture applications. This leadership position is reinforced by high consumer awareness of water quality and proactive investments in sustainable practices, positioning North America as the benchmark for market maturity and growth potential in optical-based turbidity technologies.

Regulatory Compliance Drive
Stringent EPA guidelines mandate continuous turbidity monitoring, spurring adoption of optical-based sensors across water utilities and industrial facilities for accurate compliance reporting.
Technological Integration
Advanced IoT and AI synergies enhance sensor performance, allowing for automated alerts and data analytics in smart water networks prevalent in urban centers.
Industrial Sector Demand
Food processing, pharmaceuticals, and power generation sectors prioritize reliable optical sensors to maintain process efficiency and product quality standards.
Innovation Ecosystem
Strong R&D collaborations yield next-generation features like self-cleaning optics and wireless connectivity, solidifying regional market leadership.

Europe
Europe exhibits a strong presence in the Optical-Based Turbidity Sensor Market, underpinned by the EU Water Framework Directive that emphasizes comprehensive river basin management and pollution control. Countries like Germany and France lead with widespread sensor installations in wastewater treatment plants and surface water monitoring networks. The focus on circular economy principles drives adoption in industrial recycling processes, where optical sensors provide essential data for optimizing clarification stages. Regional strengths include a dense cluster of sensor specialists and environmental consultancies, promoting hybrid systems combining turbidity with other parameters. Challenges such as aging infrastructure are addressed through retrofit solutions, enhancing municipal capabilities. Sustainability initiatives further propel demand in agriculture for irrigation quality checks and coastal monitoring. Europe’s collaborative regulatory environment ensures harmonized standards, facilitating cross-border technology transfers and market expansion.

Asia-Pacific
The Asia-Pacific region emerges as a high-growth area in the Optical-Based Turbidity Sensor Market amid rapid urbanization and industrial expansion in China, India, and Southeast Asia. Escalating water pollution from manufacturing and agriculture necessitates robust monitoring solutions, with optical sensors gaining traction for their reliability in turbid environments. Government-led smart city projects integrate these devices into urban water grids, supporting real-time quality assessments. Local manufacturers innovate cost-effective models suited to diverse climates, while multinational players establish production bases to meet surging demand. River restoration efforts and coastal protection programs boost deployments, particularly in flood-prone zones. Despite infrastructure variances, rising environmental awareness and policy shifts toward sustainable development position Asia-Pacific for accelerated market penetration.

South America
South America shows promising dynamics in the Optical-Based Turbidity Sensor Market, particularly in Brazil and Chile, where water scarcity and mining activities heighten the need for precise monitoring. Optical sensors are increasingly vital in reservoirs and treatment facilities to combat sedimentation issues exacerbated by deforestation. Regional emphasis on biodiversity conservation drives their use in Amazon basin surveillance and aquaculture farms. Emerging regulations align with international standards, encouraging adoption among utilities and agribusinesses. Partnerships with global firms introduce advanced analytics, bridging technology gaps. Economic diversification efforts further embed sensors in oil and gas wastewater management, fostering gradual market maturation.

Middle East & Africa
In the Middle East & Africa, the Optical-Based Turbidity Sensor Market gains momentum through desalination plants and oilfield operations, where water purity is paramount. Gulf nations invest in sensor technologies to optimize reverse osmosis processes, reducing operational costs. Africa’s focus on rural electrification and sanitation projects incorporates portable optical units for groundwater assessment. Harsh desert conditions spur ruggedized designs, with regional hubs in South Africa leading local adaptations. International aid and public-private partnerships accelerate deployments in contaminated river systems, addressing public health concerns. Progressive water security strategies enhance prospects for sustained growth.

Report Scope

This market research report provides a comprehensive analysis of the Optical-Based Turbidity Sensor Market, covering the forecast period 2026–2034. It offers detailed insights into market dynamics, technological advancements, competitive landscape, and key trends shaping the industry.

Key focus areas of the report include:

  • Market Overview: The report begins with an overview outlining its current market scenario, key growth indicators, and industry transformation drivers. It discusses macroeconomic factors, demand–supply balance, regulatory landscape, and the strategic role of optical-based turbidity sensors in powering advancements across industries such as water treatment, chemistry, pharmaceuticals, food & beverage, and others.
  • Market Size & Forecast: Historical data and future projections for revenue, unit shipments, and market value across major regions and segments.
  • Segmentation Analysis: Detailed breakdown by product type, technology, application, and end-user industry to identify high-growth segments and investment opportunities.
  • Regional Insights: Insights into market performance across North America, Europe, Asia, South America, and the Middle East & Africa, including country-level analysis where relevant.
  • Competitive Landscape: Profiles of leading market participants, including their product offerings, R&D focus, manufacturing capacity, pricing strategies, and recent developments such as mergers, acquisitions, and partnerships.
  • Technology Trends & Innovation: Assessment of emerging technologies, integration of AI/IoT, sensor design trends, fabrication techniques, and evolving industry standards.
  • Market Drivers & Restraints: Evaluation of factors driving market growth along with challenges, supply chain constraints, regulatory issues, and market-entry barriers.
  • Stakeholder Insights: Insights for component suppliers, OEMs, system integrators, investors, and policymakers regarding the evolving ecosystem and strategic opportunities.

Primary and secondary research methods are employed, including interviews with industry experts, data from verified sources, and real-time market intelligence to ensure the accuracy and reliability of the insights presented.

FREQUENTLY ASKED QUESTIONS:

What is the current market size of Optical-Based Turbidity Sensor Market?

-> Global Optical-Based Turbidity Sensor market was valued at USD 651 million in 2025 and is expected to reach USD 882 million by 2034, at a CAGR of 4.5% during the forecast period.

Which key companies operate in Optical-Based Turbidity Sensor Market?

-> Key players include Aanderaa, Endress+Hauser, Process Instruments (PI), KROHNE Group, Willow Technologies, Mettler Toledo, OTT HydroMet, Optek, Campbell Scientific, and PASCO, among others.

What are the key growth drivers?

-> Key growth drivers include increasing demand for water quality monitoring in water treatment, stringent environmental regulations, and expansion in pharmaceuticals and food & beverage sectors.

Which region dominates the market?

-> North America holds a significant share with the U.S. market highlighted, while Asia led by China is poised for rapid growth.

What are the emerging trends?

-> Emerging trends include shift to digital turbidity sensors, IoT integration for real-time monitoring, and advanced applications in water treatment and process industries.

Optical-Based Turbidity Sensor Market, Trends, Business Strategies 2026-2034

Get Sample Report PDF for Exclusive Insights

Report Sample Includes

  • Table of Contents
  • List of Tables & Figures
  • Charts, Research Methodology, and more...

PDF Icon Download Sample Report PDF
SKU: c39463be590f
Category:
License Type

Corporate License, Excel License, PDF and Excel Databook License

Download Sample Report

Table of Content

1 Introduction to Research & Analysis Reports
1.1 Optical-Based Turbidity Sensor Market Definition
1.2 Market Segments
1.2.1 Segment by Type
1.2.2 Segment by Application
1.3 Global Optical-Based Turbidity Sensor Market Overview
1.4 Features & Benefits of This Report
1.5 Methodology & Sources of Information
1.5.1 Research Methodology
1.5.2 Research Process
1.5.3 Base Year
1.5.4 Report Assumptions & Caveats
2 Global Optical-Based Turbidity Sensor Overall Market Size
2.1 Global Optical-Based Turbidity Sensor Market Size: 2025 VS 2034
2.2 Global Optical-Based Turbidity Sensor Market Size, Prospects & Forecasts: 2021-2034
2.3 Global Optical-Based Turbidity Sensor Sales: 2021-2034
3 Company Landscape
3.1 Top Optical-Based Turbidity Sensor Players in Global Market
3.2 Top Global Optical-Based Turbidity Sensor Companies Ranked by Revenue
3.3 Global Optical-Based Turbidity Sensor Revenue by Companies
3.4 Global Optical-Based Turbidity Sensor Sales by Companies
3.5 Global Optical-Based Turbidity Sensor Price by Manufacturer (2021-2026)
3.6 Top 3 and Top 5 Optical-Based Turbidity Sensor Companies in Global Market, by Revenue in 2025
3.7 Global Manufacturers Optical-Based Turbidity Sensor Product Type
3.8 Tier 1, Tier 2, and Tier 3 Optical-Based Turbidity Sensor Players in Global Market
3.8.1 List of Global Tier 1 Optical-Based Turbidity Sensor Companies
3.8.2 List of Global Tier 2 and Tier 3 Optical-Based Turbidity Sensor Companies
4 Sights by Type
4.1 Overview
4.1.1 Segment by Type – Global Optical-Based Turbidity Sensor Market Size Markets, 2025 & 2034
4.1.2 Analog Turbidity Sensor
4.1.3 Digital Turbidity Sensor
4.2 Segment by Type – Global Optical-Based Turbidity Sensor Revenue & Forecasts
4.2.1 Segment by Type – Global Optical-Based Turbidity Sensor Revenue, 2021-2026
4.2.2 Segment by Type – Global Optical-Based Turbidity Sensor Revenue, 2027-2034
4.2.3 Segment by Type – Global Optical-Based Turbidity Sensor Revenue Market Share, 2021-2034
4.3 Segment by Type – Global Optical-Based Turbidity Sensor Sales & Forecasts
4.3.1 Segment by Type – Global Optical-Based Turbidity Sensor Sales, 2021-2026
4.3.2 Segment by Type – Global Optical-Based Turbidity Sensor Sales, 2027-2034
4.3.3 Segment by Type – Global Optical-Based Turbidity Sensor Sales Market Share, 2021-2034
4.4 Segment by Type – Global Optical-Based Turbidity Sensor Price (Manufacturers Selling Prices), 2021-2034
5 Sights by Application
5.1 Overview
5.1.1 Segment by Application – Global Optical-Based Turbidity Sensor Market Size, 2025 & 2034
5.1.2 Water Treatment
5.1.3 Chemistry
5.1.4 Pharmaceuticals
5.1.5 Food & Beverage
5.1.6 Others
5.2 Segment by Application – Global Optical-Based Turbidity Sensor Revenue & Forecasts
5.2.1 Segment by Application – Global Optical-Based Turbidity Sensor Revenue, 2021-2026
5.2.2 Segment by Application – Global Optical-Based Turbidity Sensor Revenue, 2027-2034
5.2.3 Segment by Application – Global Optical-Based Turbidity Sensor Revenue Market Share, 2021-2034
5.3 Segment by Application – Global Optical-Based Turbidity Sensor Sales & Forecasts
5.3.1 Segment by Application – Global Optical-Based Turbidity Sensor Sales, 2021-2026
5.3.2 Segment by Application – Global Optical-Based Turbidity Sensor Sales, 2027-2034
5.3.3 Segment by Application – Global Optical-Based Turbidity Sensor Sales Market Share, 2021-2034
5.4 Segment by Application – Global Optical-Based Turbidity Sensor Price (Manufacturers Selling Prices), 2021-2034
6 Sights Region
6.1 By Region – Global Optical-Based Turbidity Sensor Market Size, 2025 & 2034
6.2 By Region – Global Optical-Based Turbidity Sensor Revenue & Forecasts
6.2.1 By Region – Global Optical-Based Turbidity Sensor Revenue, 2021-2026
6.2.2 By Region – Global Optical-Based Turbidity Sensor Revenue, 2027-2034
6.2.3 By Region – Global Optical-Based Turbidity Sensor Revenue Market Share, 2021-2034
6.3 By Region – Global Optical-Based Turbidity Sensor Sales & Forecasts
6.3.1 By Region – Global Optical-Based Turbidity Sensor Sales, 2021-2026
6.3.2 By Region – Global Optical-Based Turbidity Sensor Sales, 2027-2034
6.3.3 By Region – Global Optical-Based Turbidity Sensor Sales Market Share, 2021-2034
6.4 North America
6.4.1 By Country – North America Optical-Based Turbidity Sensor Revenue, 2021-2034
6.4.2 By Country – North America Optical-Based Turbidity Sensor Sales, 2021-2034
6.4.3 United States Optical-Based Turbidity Sensor Market Size, 2021-2034
6.4.4 Canada Optical-Based Turbidity Sensor Market Size, 2021-2034
6.4.5 Mexico Optical-Based Turbidity Sensor Market Size, 2021-2034
6.5 Europe
6.5.1 By Country – Europe Optical-Based Turbidity Sensor Revenue, 2021-2034
6.5.2 By Country – Europe Optical-Based Turbidity Sensor Sales, 2021-2034
6.5.3 Germany Optical-Based Turbidity Sensor Market Size, 2021-2034
6.5.4 France Optical-Based Turbidity Sensor Market Size, 2021-2034
6.5.5 U.K. Optical-Based Turbidity Sensor Market Size, 2021-2034
6.5.6 Italy Optical-Based Turbidity Sensor Market Size, 2021-2034
6.5.7 Russia Optical-Based Turbidity Sensor Market Size, 2021-2034
6.5.8 Nordic Countries Optical-Based Turbidity Sensor Market Size, 2021-2034
6.5.9 Benelux Optical-Based Turbidity Sensor Market Size, 2021-2034
6.6 Asia
6.6.1 By Region – Asia Optical-Based Turbidity Sensor Revenue, 2021-2034
6.6.2 By Region – Asia Optical-Based Turbidity Sensor Sales, 2021-2034
6.6.3 China Optical-Based Turbidity Sensor Market Size, 2021-2034
6.6.4 Japan Optical-Based Turbidity Sensor Market Size, 2021-2034
6.6.5 South Korea Optical-Based Turbidity Sensor Market Size, 2021-2034
6.6.6 Southeast Asia Optical-Based Turbidity Sensor Market Size, 2021-2034
6.6.7 India Optical-Based Turbidity Sensor Market Size, 2021-2034
6.7 South America
6.7.1 By Country – South America Optical-Based Turbidity Sensor Revenue, 2021-2034
6.7.2 By Country – South America Optical-Based Turbidity Sensor Sales, 2021-2034
6.7.3 Brazil Optical-Based Turbidity Sensor Market Size, 2021-2034
6.7.4 Argentina Optical-Based Turbidity Sensor Market Size, 2021-2034
6.8 Middle East & Africa
6.8.1 By Country – Middle East & Africa Optical-Based Turbidity Sensor Revenue, 2021-2034
6.8.2 By Country – Middle East & Africa Optical-Based Turbidity Sensor Sales, 2021-2034
6.8.3 Turkey Optical-Based Turbidity Sensor Market Size, 2021-2034
6.8.4 Israel Optical-Based Turbidity Sensor Market Size, 2021-2034
6.8.5 Saudi Arabia Optical-Based Turbidity Sensor Market Size, 2021-2034
6.8.6 UAE Optical-Based Turbidity Sensor Market Size, 2021-2034
7 Manufacturers & Brands Profiles
7.1 Aanderaa
7.1.1 Aanderaa Company Summary
7.1.2 Aanderaa Business Overview
7.1.3 Aanderaa Optical-Based Turbidity Sensor Major Product Offerings
7.1.4 Aanderaa Optical-Based Turbidity Sensor Sales and Revenue in Global (2021-2026)
7.1.5 Aanderaa Key News & Latest Developments
7.2 Endress+Hauser
7.2.1 Endress+Hauser Company Summary
7.2.2 Endress+Hauser Business Overview
7.2.3 Endress+Hauser Optical-Based Turbidity Sensor Major Product Offerings
7.2.4 Endress+Hauser Optical-Based Turbidity Sensor Sales and Revenue in Global (2021-2026)
7.2.5 Endress+Hauser Key News & Latest Developments
7.3 Process Instruments (PI)
7.3.1 Process Instruments (PI) Company Summary
7.3.2 Process Instruments (PI) Business Overview
7.3.3 Process Instruments (PI) Optical-Based Turbidity Sensor Major Product Offerings
7.3.4 Process Instruments (PI) Optical-Based Turbidity Sensor Sales and Revenue in Global (2021-2026)
7.3.5 Process Instruments (PI) Key News & Latest Developments
7.4 ?KROHNE Group
7.4.1 ?KROHNE Group Company Summary
7.4.2 ?KROHNE Group Business Overview
7.4.3 ?KROHNE Group Optical-Based Turbidity Sensor Major Product Offerings
7.4.4 ?KROHNE Group Optical-Based Turbidity Sensor Sales and Revenue in Global (2021-2026)
7.4.5 ?KROHNE Group Key News & Latest Developments
7.5 Willow Technologies
7.5.1 Willow Technologies Company Summary
7.5.2 Willow Technologies Business Overview
7.5.3 Willow Technologies Optical-Based Turbidity Sensor Major Product Offerings
7.5.4 Willow Technologies Optical-Based Turbidity Sensor Sales and Revenue in Global (2021-2026)
7.5.5 Willow Technologies Key News & Latest Developments
7.6 Mettler Toledo
7.6.1 Mettler Toledo Company Summary
7.6.2 Mettler Toledo Business Overview
7.6.3 Mettler Toledo Optical-Based Turbidity Sensor Major Product Offerings
7.6.4 Mettler Toledo Optical-Based Turbidity Sensor Sales and Revenue in Global (2021-2026)
7.6.5 Mettler Toledo Key News & Latest Developments
7.7 OTT HydroMet
7.7.1 OTT HydroMet Company Summary
7.7.2 OTT HydroMet Business Overview
7.7.3 OTT HydroMet Optical-Based Turbidity Sensor Major Product Offerings
7.7.4 OTT HydroMet Optical-Based Turbidity Sensor Sales and Revenue in Global (2021-2026)
7.7.5 OTT HydroMet Key News & Latest Developments
7.8 Optek
7.8.1 Optek Company Summary
7.8.2 Optek Business Overview
7.8.3 Optek Optical-Based Turbidity Sensor Major Product Offerings
7.8.4 Optek Optical-Based Turbidity Sensor Sales and Revenue in Global (2021-2026)
7.8.5 Optek Key News & Latest Developments
7.9 Campbell Scientific
7.9.1 Campbell Scientific Company Summary
7.9.2 Campbell Scientific Business Overview
7.9.3 Campbell Scientific Optical-Based Turbidity Sensor Major Product Offerings
7.9.4 Campbell Scientific Optical-Based Turbidity Sensor Sales and Revenue in Global (2021-2026)
7.9.5 Campbell Scientific Key News & Latest Developments
7.10 PASCO
7.10.1 PASCO Company Summary
7.10.2 PASCO Business Overview
7.10.3 PASCO Optical-Based Turbidity Sensor Major Product Offerings
7.10.4 PASCO Optical-Based Turbidity Sensor Sales and Revenue in Global (2021-2026)
7.10.5 PASCO Key News & Latest Developments
8 Global Optical-Based Turbidity Sensor Production Capacity, Analysis
8.1 Global Optical-Based Turbidity Sensor Production Capacity, 2021-2034
8.2 Optical-Based Turbidity Sensor Production Capacity of Key Manufacturers in Global Market
8.3 Global Optical-Based Turbidity Sensor Production by Region
9 Key Market Trends, Opportunity, Drivers and Restraints
9.1 Market Opportunities & Trends
9.2 Market Drivers
9.3 Market Restraints
10 Optical-Based Turbidity Sensor Supply Chain Analysis
10.1 Optical-Based Turbidity Sensor Industry Value Chain
10.2 Optical-Based Turbidity Sensor Upstream Market
10.3 Optical-Based Turbidity Sensor Downstream and Clients
10.4 Marketing Channels Analysis
10.4.1 Marketing Channels
10.4.2 Optical-Based Turbidity Sensor Distributors and Sales Agents in Global
11 Conclusion
12 Appendix
12.1 Note
12.2 Examples of Clients
12.3 DisclaimerList of Tables
Table 1. Key Players of Optical-Based Turbidity Sensor in Global Market
Table 2. Top Optical-Based Turbidity Sensor Players in Global Market, Ranking by Revenue (2025)
Table 3. Global Optical-Based Turbidity Sensor Revenue by Companies, (US$, Mn), 2021-2026
Table 4. Global Optical-Based Turbidity Sensor Revenue Share by Companies, 2021-2026
Table 5. Global Optical-Based Turbidity Sensor Sales by Companies, (K Units), 2021-2026
Table 6. Global Optical-Based Turbidity Sensor Sales Share by Companies, 2021-2026
Table 7. Key Manufacturers Optical-Based Turbidity Sensor Price (2021-2026) & (US$/Unit)
Table 8. Global Manufacturers Optical-Based Turbidity Sensor Product Type
Table 9. List of Global Tier 1 Optical-Based Turbidity Sensor Companies, Revenue (US$, Mn) in 2025 and Market Share
Table 10. List of Global Tier 2 and Tier 3 Optical-Based Turbidity Sensor Companies, Revenue (US$, Mn) in 2025 and Market Share
Table 11. Segment by Type – Global Optical-Based Turbidity Sensor Revenue, (US$, Mn), 2025 & 2034
Table 12. Segment by Type – Global Optical-Based Turbidity Sensor Revenue (US$, Mn), 2021-2026
Table 13. Segment by Type – Global Optical-Based Turbidity Sensor Revenue (US$, Mn), 2027-2034
Table 14. Segment by Type – Global Optical-Based Turbidity Sensor Sales (K Units), 2021-2026
Table 15. Segment by Type – Global Optical-Based Turbidity Sensor Sales (K Units), 2027-2034
Table 16. Segment by Application – Global Optical-Based Turbidity Sensor Revenue, (US$, Mn), 2025 & 2034
Table 17. Segment by Application – Global Optical-Based Turbidity Sensor Revenue, (US$, Mn), 2021-2026
Table 18. Segment by Application – Global Optical-Based Turbidity Sensor Revenue, (US$, Mn), 2027-2034
Table 19. Segment by Application – Global Optical-Based Turbidity Sensor Sales, (K Units), 2021-2026
Table 20. Segment by Application – Global Optical-Based Turbidity Sensor Sales, (K Units), 2027-2034
Table 21. By Region – Global Optical-Based Turbidity Sensor Revenue, (US$, Mn), 2025 & 2034
Table 22. By Region – Global Optical-Based Turbidity Sensor Revenue, (US$, Mn), 2021-2026
Table 23. By Region – Global Optical-Based Turbidity Sensor Revenue, (US$, Mn), 2027-2034
Table 24. By Region – Global Optical-Based Turbidity Sensor Sales, (K Units), 2021-2026
Table 25. By Region – Global Optical-Based Turbidity Sensor Sales, (K Units), 2027-2034
Table 26. By Country – North America Optical-Based Turbidity Sensor Revenue, (US$, Mn), 2021-2026
Table 27. By Country – North America Optical-Based Turbidity Sensor Revenue, (US$, Mn), 2027-2034
Table 28. By Country – North America Optical-Based Turbidity Sensor Sales, (K Units), 2021-2026
Table 29. By Country – North America Optical-Based Turbidity Sensor Sales, (K Units), 2027-2034
Table 30. By Country – Europe Optical-Based Turbidity Sensor Revenue, (US$, Mn), 2021-2026
Table 31. By Country – Europe Optical-Based Turbidity Sensor Revenue, (US$, Mn), 2027-2034
Table 32. By Country – Europe Optical-Based Turbidity Sensor Sales, (K Units), 2021-2026
Table 33. By Country – Europe Optical-Based Turbidity Sensor Sales, (K Units), 2027-2034
Table 34. By Region – Asia Optical-Based Turbidity Sensor Revenue, (US$, Mn), 2021-2026
Table 35. By Region – Asia Optical-Based Turbidity Sensor Revenue, (US$, Mn), 2027-2034
Table 36. By Region – Asia Optical-Based Turbidity Sensor Sales, (K Units), 2021-2026
Table 37. By Region – Asia Optical-Based Turbidity Sensor Sales, (K Units), 2027-2034
Table 38. By Country – South America Optical-Based Turbidity Sensor Revenue, (US$, Mn), 2021-2026
Table 39. By Country – South America Optical-Based Turbidity Sensor Revenue, (US$, Mn), 2027-2034
Table 40. By Country – South America Optical-Based Turbidity Sensor Sales, (K Units), 2021-2026
Table 41. By Country – South America Optical-Based Turbidity Sensor Sales, (K Units), 2027-2034
Table 42. By Country – Middle East & Africa Optical-Based Turbidity Sensor Revenue, (US$, Mn), 2021-2026
Table 43. By Country – Middle East & Africa Optical-Based Turbidity Sensor Revenue, (US$, Mn), 2027-2034
Table 44. By Country – Middle East & Africa Optical-Based Turbidity Sensor Sales, (K Units), 2021-2026
Table 45. By Country – Middle East & Africa Optical-Based Turbidity Sensor Sales, (K Units), 2027-2034
Table 46. Aanderaa Company Summary
Table 47. Aanderaa Optical-Based Turbidity Sensor Product Offerings
Table 48. Aanderaa Optical-Based Turbidity Sensor Sales (K Units), Revenue (US$, Mn) and Average Price (US$/Unit) & (2021-2026)
Table 49. Aanderaa Key News & Latest Developments
Table 50. Endress+Hauser Company Summary
Table 51. Endress+Hauser Optical-Based Turbidity Sensor Product Offerings
Table 52. Endress+Hauser Optical-Based Turbidity Sensor Sales (K Units), Revenue (US$, Mn) and Average Price (US$/Unit) & (2021-2026)
Table 53. Endress+Hauser Key News & Latest Developments
Table 54. Process Instruments (PI) Company Summary
Table 55. Process Instruments (PI) Optical-Based Turbidity Sensor Product Offerings
Table 56. Process Instruments (PI) Optical-Based Turbidity Sensor Sales (K Units), Revenue (US$, Mn) and Average Price (US$/Unit) & (2021-2026)
Table 57. Process Instruments (PI) Key News & Latest Developments
Table 58. ?KROHNE Group Company Summary
Table 59. ?KROHNE Group Optical-Based Turbidity Sensor Product Offerings
Table 60. ?KROHNE Group Optical-Based Turbidity Sensor Sales (K Units), Revenue (US$, Mn) and Average Price (US$/Unit) & (2021-2026)
Table 61. ?KROHNE Group Key News & Latest Developments
Table 62. Willow Technologies Company Summary
Table 63. Willow Technologies Optical-Based Turbidity Sensor Product Offerings
Table 64. Willow Technologies Optical-Based Turbidity Sensor Sales (K Units), Revenue (US$, Mn) and Average Price (US$/Unit) & (2021-2026)
Table 65. Willow Technologies Key News & Latest Developments
Table 66. Mettler Toledo Company Summary
Table 67. Mettler Toledo Optical-Based Turbidity Sensor Product Offerings
Table 68. Mettler Toledo Optical-Based Turbidity Sensor Sales (K Units), Revenue (US$, Mn) and Average Price (US$/Unit) & (2021-2026)
Table 69. Mettler Toledo Key News & Latest Developments
Table 70. OTT HydroMet Company Summary
Table 71. OTT HydroMet Optical-Based Turbidity Sensor Product Offerings
Table 72. OTT HydroMet Optical-Based Turbidity Sensor Sales (K Units), Revenue (US$, Mn) and Average Price (US$/Unit) & (2021-2026)
Table 73. OTT HydroMet Key News & Latest Developments
Table 74. Optek Company Summary
Table 75. Optek Optical-Based Turbidity Sensor Product Offerings
Table 76. Optek Optical-Based Turbidity Sensor Sales (K Units), Revenue (US$, Mn) and Average Price (US$/Unit) & (2021-2026)
Table 77. Optek Key News & Latest Developments
Table 78. Campbell Scientific Company Summary
Table 79. Campbell Scientific Optical-Based Turbidity Sensor Product Offerings
Table 80. Campbell Scientific Optical-Based Turbidity Sensor Sales (K Units), Revenue (US$, Mn) and Average Price (US$/Unit) & (2021-2026)
Table 81. Campbell Scientific Key News & Latest Developments
Table 82. PASCO Company Summary
Table 83. PASCO Optical-Based Turbidity Sensor Product Offerings
Table 84. PASCO Optical-Based Turbidity Sensor Sales (K Units), Revenue (US$, Mn) and Average Price (US$/Unit) & (2021-2026)
Table 85. PASCO Key News & Latest Developments
Table 86. Optical-Based Turbidity Sensor Capacity of Key Manufacturers in Global Market, 2024-2026 (K Units)
Table 87. Global Optical-Based Turbidity Sensor Capacity Market Share of Key Manufacturers, 2024-2026
Table 88. Global Optical-Based Turbidity Sensor Production by Region, 2021-2026 (K Units)
Table 89. Global Optical-Based Turbidity Sensor Production by Region, 2027-2034 (K Units)
Table 90. Optical-Based Turbidity Sensor Market Opportunities & Trends in Global Market
Table 91. Optical-Based Turbidity Sensor Market Drivers in Global Market
Table 92. Optical-Based Turbidity Sensor Market Restraints in Global Market
Table 93. Optical-Based Turbidity Sensor Raw Materials
Table 94. Optical-Based Turbidity Sensor Raw Materials Suppliers in Global Market
Table 95. Typical Optical-Based Turbidity Sensor Downstream
Table 96. Optical-Based Turbidity Sensor Downstream Clients in Global Market
Table 97. Optical-Based Turbidity Sensor Distributors and Sales Agents in Global Market

List of Figures
Figure 1. Optical-Based Turbidity Sensor Product Picture
Figure 2. Optical-Based Turbidity Sensor Segment by Type in 2025
Figure 3. Optical-Based Turbidity Sensor Segment by Application in 2025
Figure 4. Global Optical-Based Turbidity Sensor Market Overview: 2025
Figure 5. Key Caveats
Figure 6. Global Optical-Based Turbidity Sensor Market Size: 2025 VS 2034 (US$, Mn)
Figure 7. Global Optical-Based Turbidity Sensor Revenue: 2021-2034 (US$, Mn)
Figure 8. Optical-Based Turbidity Sensor Sales in Global Market: 2021-2034 (K Units)
Figure 9. The Top 3 and 5 Players Market Share by Optical-Based Turbidity Sensor Revenue in 2025
Figure 10. Segment by Type – Global Optical-Based Turbidity Sensor Revenue, (US$, Mn), 2025 & 2034
Figure 11. Segment by Type – Global Optical-Based Turbidity Sensor Revenue Market Share, 2021-2034
Figure 12. Segment by Type – Global Optical-Based Turbidity Sensor Sales Market Share, 2021-2034
Figure 13. Segment by Type – Global Optical-Based Turbidity Sensor Price (US$/Unit), 2021-2034
Figure 14. Segment by Application – Global Optical-Based Turbidity Sensor Revenue, (US$, Mn), 2025 & 2034
Figure 15. Segment by Application – Global Optical-Based Turbidity Sensor Revenue Market Share, 2021-2034
Figure 16. Segment by Application – Global Optical-Based Turbidity Sensor Sales Market Share, 2021-2034
Figure 17. Segment by Application -Global Optical-Based Turbidity Sensor Price (US$/Unit), 2021-2034
Figure 18. By Region – Global Optical-Based Turbidity Sensor Revenue, (US$, Mn), 2025 & 2034
Figure 19. By Region – Global Optical-Based Turbidity Sensor Revenue Market Share, 2021 VS 2025 VS 2034
Figure 20. By Region – Global Optical-Based Turbidity Sensor Revenue Market Share, 2021-2034
Figure 21. By Region – Global Optical-Based Turbidity Sensor Sales Market Share, 2021-2034
Figure 22. By Country – North America Optical-Based Turbidity Sensor Revenue Market Share, 2021-2034
Figure 23. By Country – North America Optical-Based Turbidity Sensor Sales Market Share, 2021-2034
Figure 24. United States Optical-Based Turbidity Sensor Revenue, (US$, Mn), 2021-2034
Figure 25. Canada Optical-Based Turbidity Sensor Revenue, (US$, Mn), 2021-2034
Figure 26. Mexico Optical-Based Turbidity Sensor Revenue, (US$, Mn), 2021-2034
Figure 27. By Country – Europe Optical-Based Turbidity Sensor Revenue Market Share, 2021-2034
Figure 28. By Country – Europe Optical-Based Turbidity Sensor Sales Market Share, 2021-2034
Figure 29. Germany Optical-Based Turbidity Sensor Revenue, (US$, Mn), 2021-2034
Figure 30. France Optical-Based Turbidity Sensor Revenue, (US$, Mn), 2021-2034
Figure 31. U.K. Optical-Based Turbidity Sensor Revenue, (US$, Mn), 2021-2034
Figure 32. Italy Optical-Based Turbidity Sensor Revenue, (US$, Mn), 2021-2034
Figure 33. Russia Optical-Based Turbidity Sensor Revenue, (US$, Mn), 2021-2034
Figure 34. Nordic Countries Optical-Based Turbidity Sensor Revenue, (US$, Mn), 2021-2034
Figure 35. Benelux Optical-Based Turbidity Sensor Revenue, (US$, Mn), 2021-2034
Figure 36. By Region – Asia Optical-Based Turbidity Sensor Revenue Market Share, 2021-2034
Figure 37. By Region – Asia Optical-Based Turbidity Sensor Sales Market Share, 2021-2034
Figure 38. China Optical-Based Turbidity Sensor Revenue, (US$, Mn), 2021-2034
Figure 39. Japan Optical-Based Turbidity Sensor Revenue, (US$, Mn), 2021-2034
Figure 40. South Korea Optical-Based Turbidity Sensor Revenue, (US$, Mn), 2021-2034
Figure 41. Southeast Asia Optical-Based Turbidity Sensor Revenue, (US$, Mn), 2021-2034
Figure 42. India Optical-Based Turbidity Sensor Revenue, (US$, Mn), 2021-2034
Figure 43. By Country – South America Optical-Based Turbidity Sensor Revenue Market Share, 2021-2034
Figure 44. By Country – South America Optical-Based Turbidity Sensor Sales, Market Share, 2021-2034
Figure 45. Brazil Optical-Based Turbidity Sensor Revenue, (US$, Mn), 2021-2034
Figure 46. Argentina Optical-Based Turbidity Sensor Revenue, (US$, Mn), 2021-2034
Figure 47. By Country – Middle East & Africa Optical-Based Turbidity Sensor Revenue, Market Share, 2021-2034
Figure 48. By Country – Middle East & Africa Optical-Based Turbidity Sensor Sales, Market Share, 2021-2034
Figure 49. Turkey Optical-Based Turbidity Sensor Revenue, (US$, Mn), 2021-2034
Figure 50. Israel Optical-Based Turbidity Sensor Revenue, (US$, Mn), 2021-2034
Figure 51. Saudi Arabia Optical-Based Turbidity Sensor Revenue, (US$, Mn), 2021-2034
Figure 52. UAE Optical-Based Turbidity Sensor Revenue, (US$, Mn), 2021-2034
Figure 53. Global Optical-Based Turbidity Sensor Production Capacity (K Units), 2021-2034
Figure 54. The Percentage of Production Optical-Based Turbidity Sensor by Region, 2025 VS 2034
Figure 55. Optical-Based Turbidity Sensor Industry Value Chain
Figure 56. Marketing Channels