MARKET INSIGHTS
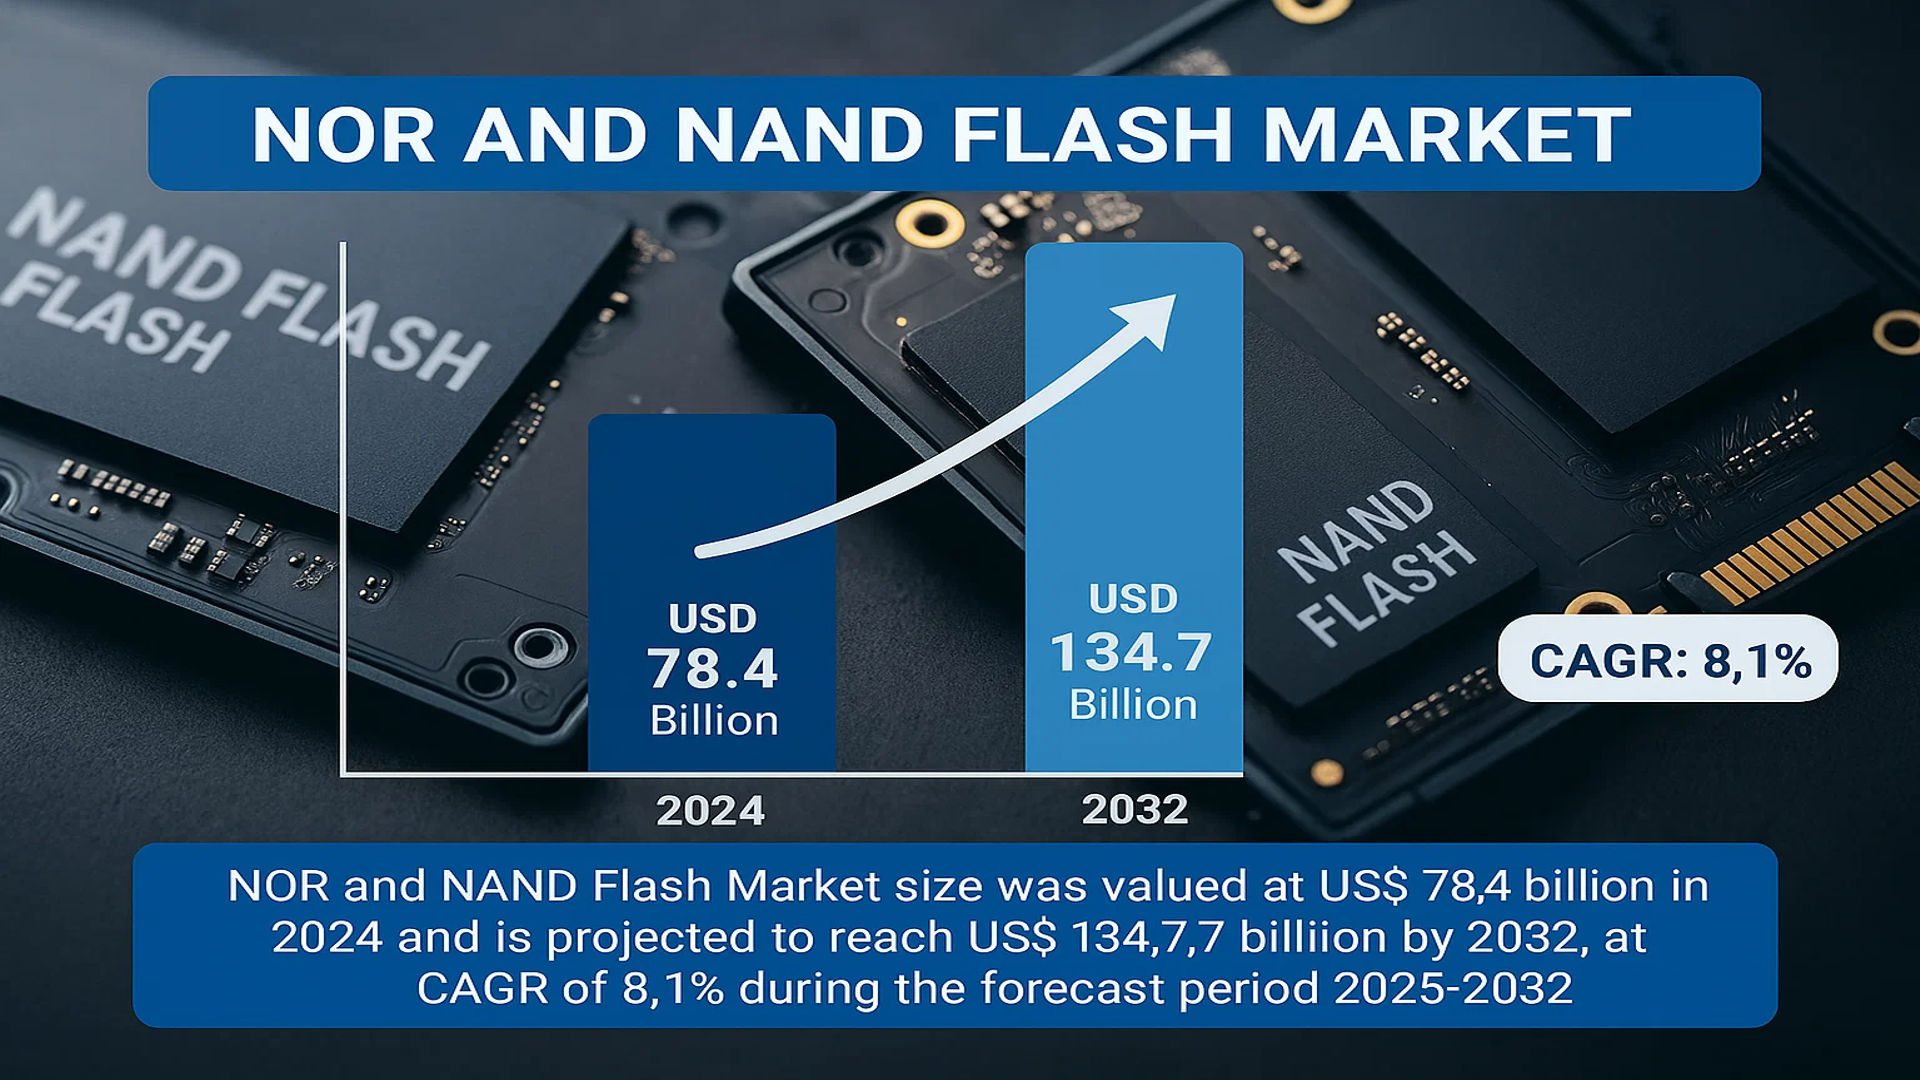
The global NOR and NAND Flash Market size was valued at US$ 78.4 billion in 2024 and is projected to reach US$ 134.7 billion by 2032, at a CAGR of 8.1% during the forecast period 2025-2032. The U.S. market accounts for 28% of global revenue, while China is expected to grow at a faster pace, reaching USD 15.2 billion by 2032.
NOR Flash and NAND Flash are non-volatile memory technologies that store data without power. NOR Flash offers faster read speeds and random access capabilities, making it ideal for code storage in devices like smartphones and automotive systems. NAND Flash provides higher density and lower cost per bit, dominating data storage applications in SSDs, USB drives, and memory cards. The market is segmented by type (NOR/NAND) and application (telecommunications, consumer electronics, automotive, and others).
Growth is driven by rising demand for high-speed data storage in 5G networks, IoT devices, and autonomous vehicles. While NAND Flash leads in volume due to cloud storage needs, NOR Flash maintains steady demand in embedded systems. Key players like Samsung, Micron, and Kioxia are investing in 3D NAND technology to increase density and reduce costs. The industry faces challenges from supply chain disruptions and price volatility, but innovations in quad-level cell (QLC) and 3D stacking technologies present new opportunities.
NOR AND NAND FLASH MARKET DYNAMICS
MARKET DRIVERS
Proliferation of IoT and Edge Computing to Drive NOR and NAND Flash Demand
The Internet of Things (IoT) revolution continues to accelerate across industries, requiring reliable and low-power memory solutions. NOR flash, with its fast read speeds and code execution capabilities, has become essential for IoT edge devices needing instant-on functionality. Similarly, NAND flash storage is experiencing exponential growth in IoT data logging applications. The global installed base of IoT devices is projected to surpass 29 billion units by 2030, creating significant demand for both memory types. NOR flash adoption is particularly strong in industrial IoT applications where reliability and longevity are paramount, while NAND flash benefits from the data storage requirements of smart city infrastructure and connected automotive systems.
Automotive Electronics Boom Creating New Memory Demand
Modern vehicles now incorporate hundreds of NOR and NAND flash chips across advanced driver assistance systems (ADAS), infotainment, and telematics units. The transition toward autonomous vehicles requires increasing memory densities – with some high-end vehicles now using over 100GB of NAND flash storage. NOR flash remains critical for safety-critical systems requiring fail-safe operation. The automotive memory market is expected to grow at double-digit rates through 2030 as vehicle electrification and autonomy continue. Leading manufacturers are developing specialized automotive-grade flash memory with extended temperature ranges and enhanced endurance to meet stringent automotive qualifications.
5G Network Expansion Accelerates Memory Requirements
The global rollout of 5G infrastructure is driving substantial demand for both NOR and NAND flash in base stations and networking equipment. NOR flash is essential for storing boot code and firmware in 5G radios, while NAND flash handles payload data buffering and logging. With over 2 million 5G base stations expected to be deployed by 2025, the communications sector represents one of the fastest growing segments for flash memory. Equipment manufacturers are shifting toward higher density NOR solutions (512Mb+) to accommodate more complex firmware, creating premium pricing opportunities in this segment.
MARKET RESTRAINTS
Memory Price Volatility Creates Supply Chain Challenges
The flash memory market has historically been characterized by cyclical price swings, creating planning challenges for both suppliers and OEM customers. NAND flash prices experienced nearly 30% quarterly declines during market downturns, while NOR flash has shown more stability due to specialized manufacturing requirements. These fluctuations make it difficult for manufacturers to maintain consistent profitability and for OEMs to forecast component costs. The industry continues working toward more balanced supply-demand dynamics through capacity discipline and long-term supply agreements, but inherent market cyclicality remains a significant restraint.
Technical Limitations in Scaling Challenges Innovation
As flash memory technologies approach physical scaling limits, manufacturers face increasing technical challenges in delivering annual cost reductions. NOR flash manufacturing has largely stabilized at 45-65nm nodes due to performance requirements, limiting density improvements. While 3D NAND continues scaling vertically, each generation requires substantially higher capital investment. The transition to new architectures like Charge Trap Flash and emerging memory technologies adds complexity and R&D costs. These technical hurdles may constrain the industry’s ability to maintain historical cost reduction trajectories, potentially impacting end-market adoption rates.
Geopolitical Factors Disrupting Supply Chains
Recent geopolitical tensions and trade restrictions have created uncertainty in memory supply chains. Over 60% of global NAND production capacity is concentrated in just two countries, creating potential vulnerability. Export controls on advanced semiconductor manufacturing equipment could delay technology transitions, while regional subsidies are distorting competitive dynamics. These factors are prompting memory users to diversify supply sources and consider alternative architectures, creating headwinds for conventional flash memory growth in certain applications.
MARKET OPPORTUNITIES
AI and Machine Learning Driving New Memory Architectures
The explosive growth of AI applications is creating opportunities for innovative flash memory solutions. While traditional NAND struggles with AI workloads, new approaches like computational storage that combine flash with processing elements are gaining traction. Edge AI devices increasingly utilize specialized NOR flash configurations for neural network storage. The AI memory market could represent over 15% of total flash demand by 2030 as these applications proliferate. Leading manufacturers are developing flash-optimized AI solutions through partnerships with chipset vendors and algorithm developers.
Enterprise Storage Transition to QLC and PLC NAND
The shift toward higher-density quad-level cell (QLC) and emerging penta-level cell (PLC) NAND technologies in data centers represents a significant growth opportunity. While these technologies sacrifice some endurance, their cost-per-bit advantages make them ideal for read-intensive cloud workloads. Enterprise adoption of QLC SSDs is accelerating as controller technology improves, with some hyperscale data centers now testing PLC solutions. This transition allows NAND manufacturers to extract more value from each wafer, helping offset declining margins on conventional products.
Industrial Automation Creating Demand for Rugged Solutions
The rapid automation of manufacturing and industrial processes requires memory solutions that can withstand harsh environments. Industrial-grade NOR and NAND flash with extended temperature ranges (-40°C to 105°C), radiation hardening, and enhanced reliability commands significant price premiums. As smart factories and Industry 4.0 initiatives expand, demand for these specialized memory products is growing at nearly twice the rate of the overall flash market. This represents a high-value opportunity for manufacturers with strong industrial qualifications and long-term product lifecycle management capabilities.
MARKET CHALLENGES
Intense Competition from Emerging Memory Technologies
Traditional flash memory faces increasing competition from advanced alternatives like MRAM, ReRAM, and PCM. While these technologies currently serve niche applications, they are making inroads into markets traditionally served by NOR flash. The superior endurance and performance of MRAM is challenging NOR in automotive and industrial applications, while storage-class memory alternatives threaten portions of the NAND market. Flash manufacturers must continue advancing their technologies while carefully managing R&D investments across multiple memory architectures.
Complexity of 3D NAND Manufacturing Impacts Yields
As 3D NAND architectures scale to 200+ layers, manufacturing complexity increases exponentially. Layer-to-layer alignment requirements and new materials introduce yield challenges that can constrain supply. The transition to new architectures like string stacking requires extensive process recalibration. These factors contribute to production fluctuations that can impact lead times and pricing stability. Manufacturers are investing heavily in process control and equipment innovations to maintain acceptable yields as architectures become more complex.
Environmental Regulations Impacting Materials and Processes
Increasing environmental regulations are affecting flash memory manufacturing and materials selection. Restrictions on certain chemicals used in semiconductor fabrication require costly substitutions and process modifications. Energy consumption during 3D NAND production is drawing scrutiny as manufacturers face pressure to reduce carbon footprints. Compliance with evolving regulations in multiple jurisdictions adds complexity to global operations. These challenges require substantial capital investment while potentially impacting manufacturing efficiency and cost structures.
NOR AND NAND FLASH MARKET TRENDS
Increasing Demand for High-Density Storage Solutions Drives Market Expansion
The global NOR and NAND Flash market is witnessing robust growth, with rising demand for high-density storage in consumer electronics, automotive, and telecommunications sectors. NOR Flash, known for its fast read speeds and reliability, remains critical in embedded systems, while NAND Flash dominates large-capacity storage applications. The market is projected to grow at a steady CAGR of around 5-7% through 2032, driven by advancements in 3D NAND technology, which enables higher storage capacities while reducing costs per gigabyte. As IoT and 5G deployments accelerate, the need for low-latency, energy-efficient memory solutions is further boosting adoption.
Other Trends
Automotive Applications Gaining Momentum
The automotive sector is emerging as a key growth area for NOR and NAND Flash due to increasing adoption of advanced driver-assistance systems (ADAS) and in-vehicle infotainment (IVI) systems. Autonomous vehicles, in particular, require high-performance memory for real-time data processing, which has led to a surge in demand for high-reliability NOR Flash for firmware storage and NAND Flash for handling large datasets. By 2030, automotive memory applications are expected to account for over 20% of the total NOR and NAND Flash revenues.
Transition to Higher-End 3D NAND Technology
Manufacturers are increasingly shifting from traditional 2D NAND to 3D NAND architectures to accommodate growing storage needs without sacrificing physical space. This shift has allowed for flash storage capacities exceeding 1TB in single devices, catering to data centers, enterprise SSDs, and high-end smartphones. While 3D NAND currently holds over 60% of the NAND market share, further advancements in layer stacking (beyond 200 layers) are expected to enhance cost efficiency and performance. Meanwhile, NOR Flash is benefiting from embedded applications in AI-powered edge devices, ensuring sustained demand despite being outpaced by NAND in storage scale.
Supply Chain Diversification & Regional Growth
Geopolitical factors are prompting companies to diversify supply chains, with semiconductor manufacturers expanding production in regions like Southeast Asia and North America. China remains a key player, contributing nearly 35% of global NAND production, while the U.S. and South Korea continue to lead in cutting-edge R&D. The market is also seeing increased investment in specialty NOR Flash for industrial automation and medical devices, broadening the technology’s application scope beyond traditional consumer electronics.
COMPETITIVE LANDSCAPE
Key Industry Players
Leading Manufacturers Expand Production Capacity to Meet Rising Demand
The global NOR and NAND Flash market features a highly competitive landscape, dominated by established semiconductor giants and specialized memory manufacturers. Samsung Electronics maintains its leadership position, controlling approximately 35% of the NAND flash market share in 2024, thanks to its vertically integrated supply chain and continuous technology advancements in 3D NAND architectures. The South Korean giant recently announced a $20 billion investment to expand its NAND production capacity in Pyeongtaek, further solidifying its market dominance.
Micron Technology and Kioxia (formerly Toshiba Memory) follow closely, collectively accounting for nearly 40% of the global NAND flash output. Micron’s breakthrough in 232-layer NAND technology and its strategic partnerships with automakers for embedded solutions have significantly strengthened its market position in high-growth segments. Meanwhile, Kioxia’s joint venture with Western Digital allows both companies to maintain cost competitiveness in the price-sensitive consumer electronics segment.
The NOR flash market presents a different competitive dynamic, where Winbond and Macronix lead with specialized solutions for industrial and automotive applications. Winbond’s recent expansion of its 25nm NOR flash production capacity positions it strongly to capitalize on the growing demand from IoT device manufacturers. Macronix’s focus on high-reliability NOR solutions has made it the preferred supplier for automotive MCU applications, especially in advanced driver-assistance systems (ADAS).
Emerging Chinese players like GigaDevice are challenging incumbents through aggressive pricing strategies and government-backed capacity expansions. GigaDevice reported 25% year-over-year revenue growth in NOR flash for Q1 2024, signaling its growing influence in the mid-range market segment.
List of Key NOR and NAND Flash Manufacturers
- Samsung Electronics (South Korea)
- Micron Technology (U.S.)
- Kioxia Holdings (Japan)
- Infineon (Cypress) (Germany)
- Winbond Electronics (Taiwan)
- Macronix International (Taiwan)
- ISSI Integrated Silicon Solution Inc. (U.S.)
- Microchip Technology (U.S.)
- GigaDevice Semiconductor (China)
- Eon Technology (China)
Segment Analysis:
By Type
NAND Flash Segment Leads Due to High Adoption in High-Capacity Storage Applications
The market is segmented based on type into:
- NOR Flash
- Subtypes: Serial NOR, Parallel NOR, and others
- NAND Flash
- Subtypes: SLC NAND, MLC NAND, TLC NAND, QLC NAND, and others
By Application
Consumer Electronics Segment Dominates with Increasing Demand for Smart Devices
The market is segmented based on application into:
- Telecommunication
- Consumer Electronics
- Automotive
- Industrial
- Others
By Density
High-Density Flash Memory Gains Traction for Data-Intensive Applications
The market is segmented based on density into:
- Low-Density (Below 512Mb)
- Medium-Density (512Mb-8Gb)
- High-Density (Above 8Gb)
By Interface
Serial Interface Segment Shows Strong Growth for Compact Designs
The market is segmented based on interface into:
- Parallel Interface
- Serial Interface
- Others
Regional Analysis: NOR and NAND Flash Market
North America
The NOR and NAND Flash market in North America remains a key growth region, driven by robust demand from the automotive, telecommunications, and consumer electronics sectors. The U.S., in particular, accounts for the largest share of the regional market due to its advanced technological infrastructure and high adoption of storage-intensive applications, such as IoT and 5G devices. Major manufacturers like Micron and Cypress Semiconductor continue to dominate due to their strong R&D capabilities in high-performance NOR and NAND solutions. While NOR Flash is preferred for its reliability in embedded systems, NAND Flash sees higher demand in data storage applications. However, supply chain disruptions and geopolitical trade tensions present challenges for sourcing raw materials and components.
Europe
Europe maintains steady growth in the NOR and NAND Flash market, with Germany, France, and the U.K. leading the way. The region benefits from stringent data security regulations and a strong automotive industry that relies on NOR Flash for in-vehicle infotainment and ADAS systems. European manufacturers like STMicroelectronics are investing in next-generation storage technologies to meet the demands of AI and edge computing applications. Although the market faces pricing pressure due to global oversupply, sustainability initiatives and energy-efficient memory solutions are expected to drive long-term demand. Additionally, collaborations between semiconductor firms and automotive OEMs further strengthen market positioning.
Asia-Pacific
Asia-Pacific dominates the global NOR and NAND Flash market in both production and consumption, with China, Japan, and South Korea being the key contributors. China’s aggressive expansion in semiconductor manufacturing and consumer electronics fuels demand for high-capacity NAND Flash. Meanwhile, South Korea’s Samsung and SK Hynix lead in 3D NAND innovation, commanding a significant share of global production. India’s growing smartphone market and push for local electronics manufacturing also contribute to regional expansion. Despite its stronghold, the market grapples with price volatility and trade restrictions, which could impact short-term growth. Nevertheless, increasing investments in data centers and AI infrastructure ensure sustained momentum.
South America
The South American market for NOR and NAND Flash remains nascent but shows gradual progress, primarily driven by Brazil and Argentina. Consumer electronics and industrial automation sectors are the primary adopters, though demand is constrained by economic instability and currency fluctuations. Many regional players rely on imports from Asia and North America, making pricing a critical factor in procurement decisions. The lack of local semiconductor manufacturing further limits market expansion, but increasing digital transformation initiatives present opportunities for future growth. NOR Flash adoption is particularly visible in automotive and IoT applications, though high costs remain a deterrent for widespread use.
Middle East & Africa
The Middle East & Africa region is emerging as a potential growth area for NOR and NAND Flash, supported by technological adoption in the UAE, Saudi Arabia, and Israel. Investments in smart city projects and telecommunications infrastructure are increasing demand for advanced memory solutions. While NAND Flash dominates due to storage-heavy applications, NOR Flash sees niche adoption in defense and aerospace sectors. Economic diversification policies in the Gulf Cooperation Council (GCC) countries are expected to boost local demand, though high import dependency and limited semiconductor expertise remain barriers. Nevertheless, long-term prospects are promising with rising data-centric applications and digital infrastructure development.
Report Scope
This market research report provides a comprehensive analysis of the global and regional NOR and NAND Flash markets, covering the forecast period 2025–2032. It offers detailed insights into market dynamics, technological advancements, competitive landscape, and key trends shaping the industry.
Key focus areas of the report include:
- Market Size & Forecast: Historical data and future projections for revenue, unit shipments, and market value across major regions and segments. The Global NOR and NAND Flash market was valued at US$ 78.4 billion in 2024 and is projected to reach US$ 134.7 billion by 2032, growing at a CAGR of 8.1 % during the forecast period.
- Segmentation Analysis: Detailed breakdown by product type (NOR Flash and NAND Flash), technology, application (Telecommunication, Consumer Electronics, Automotive, Others), and end-user industry to identify high-growth segments and investment opportunities.
- Regional Outlook: Insights into market performance across North America, Europe, Asia-Pacific, Latin America, and the Middle East & Africa, including country-level analysis. The U.S. market size is estimated at USD million in 2024, while China is projected to reach USD million.
- Competitive Landscape: Profiles of leading market participants including Cypress, Samsung, Winbond, Micron, Macronix, ISSI, Eon, Microchip, and GigaDevice, covering their product offerings, R&D focus, manufacturing capacity, pricing strategies, and recent developments.
- Technology Trends & Innovation: Assessment of emerging technologies, integration of AI/IoT in flash memory, semiconductor design trends, fabrication techniques, and evolving industry standards.
- Market Drivers & Restraints: Evaluation of factors driving market growth along with challenges, supply chain constraints, regulatory issues, and market-entry barriers.
- Stakeholder Analysis: Insights for component suppliers, OEMs, system integrators, investors, and policymakers regarding the evolving ecosystem and strategic opportunities.
Primary and secondary research methods are employed, including interviews with industry experts, data from verified sources, and real-time market intelligence to ensure the accuracy and reliability of the insights presented.
FREQUENTLY ASKED QUESTIONS:
What is the current market size of Global NOR and NAND Flash Market?
-> NOR and NAND Flash Market size was valued at US$ 78.4 billion in 2024 and is projected to reach US$ 134.7 billion by 2032, at a CAGR of 8.1% during the forecast period 2025-2032.
Which key companies operate in Global NOR and NAND Flash Market?
-> Key players include Cypress, Samsung, Winbond, Micron, Macronix, ISSI, Eon, Microchip, and GigaDevice, among others.
What are the key growth drivers?
-> Key growth drivers include increasing demand for data storage, growth in IoT devices, automotive electronics adoption, and expansion of 5G networks.
Which region dominates the market?
-> Asia-Pacific is the fastest-growing region, driven by semiconductor manufacturing in China, South Korea, and Taiwan, while North America remains a technological leader.
What are the emerging trends?
-> Emerging trends include 3D NAND technology advancement, ultra-high-density flash memory, AI-optimized storage solutions, and increased adoption in automotive applications.

Get Sample Report PDF for Exclusive Insights
Report Sample Includes
- Table of Contents
- List of Tables & Figures
- Charts, Research Methodology, and more...


