Magnetic Jack Market, Trends, Business Strategies 2025-2032

Magnetic Jack Market size was valued at US$ 234 million in 2024 and is projected to reach US$ 376 million by 2032, at a CAGR of 6.9% during the forecast period 2025-2032

PDF Icon Download Sample Report PDF
  • Quick Dispatch

    All Orders

  • Secure Payment

    100% Secure Payment

Price range: $1,500.00 through $4,250.00

Clear

MARKET INSIGHTS

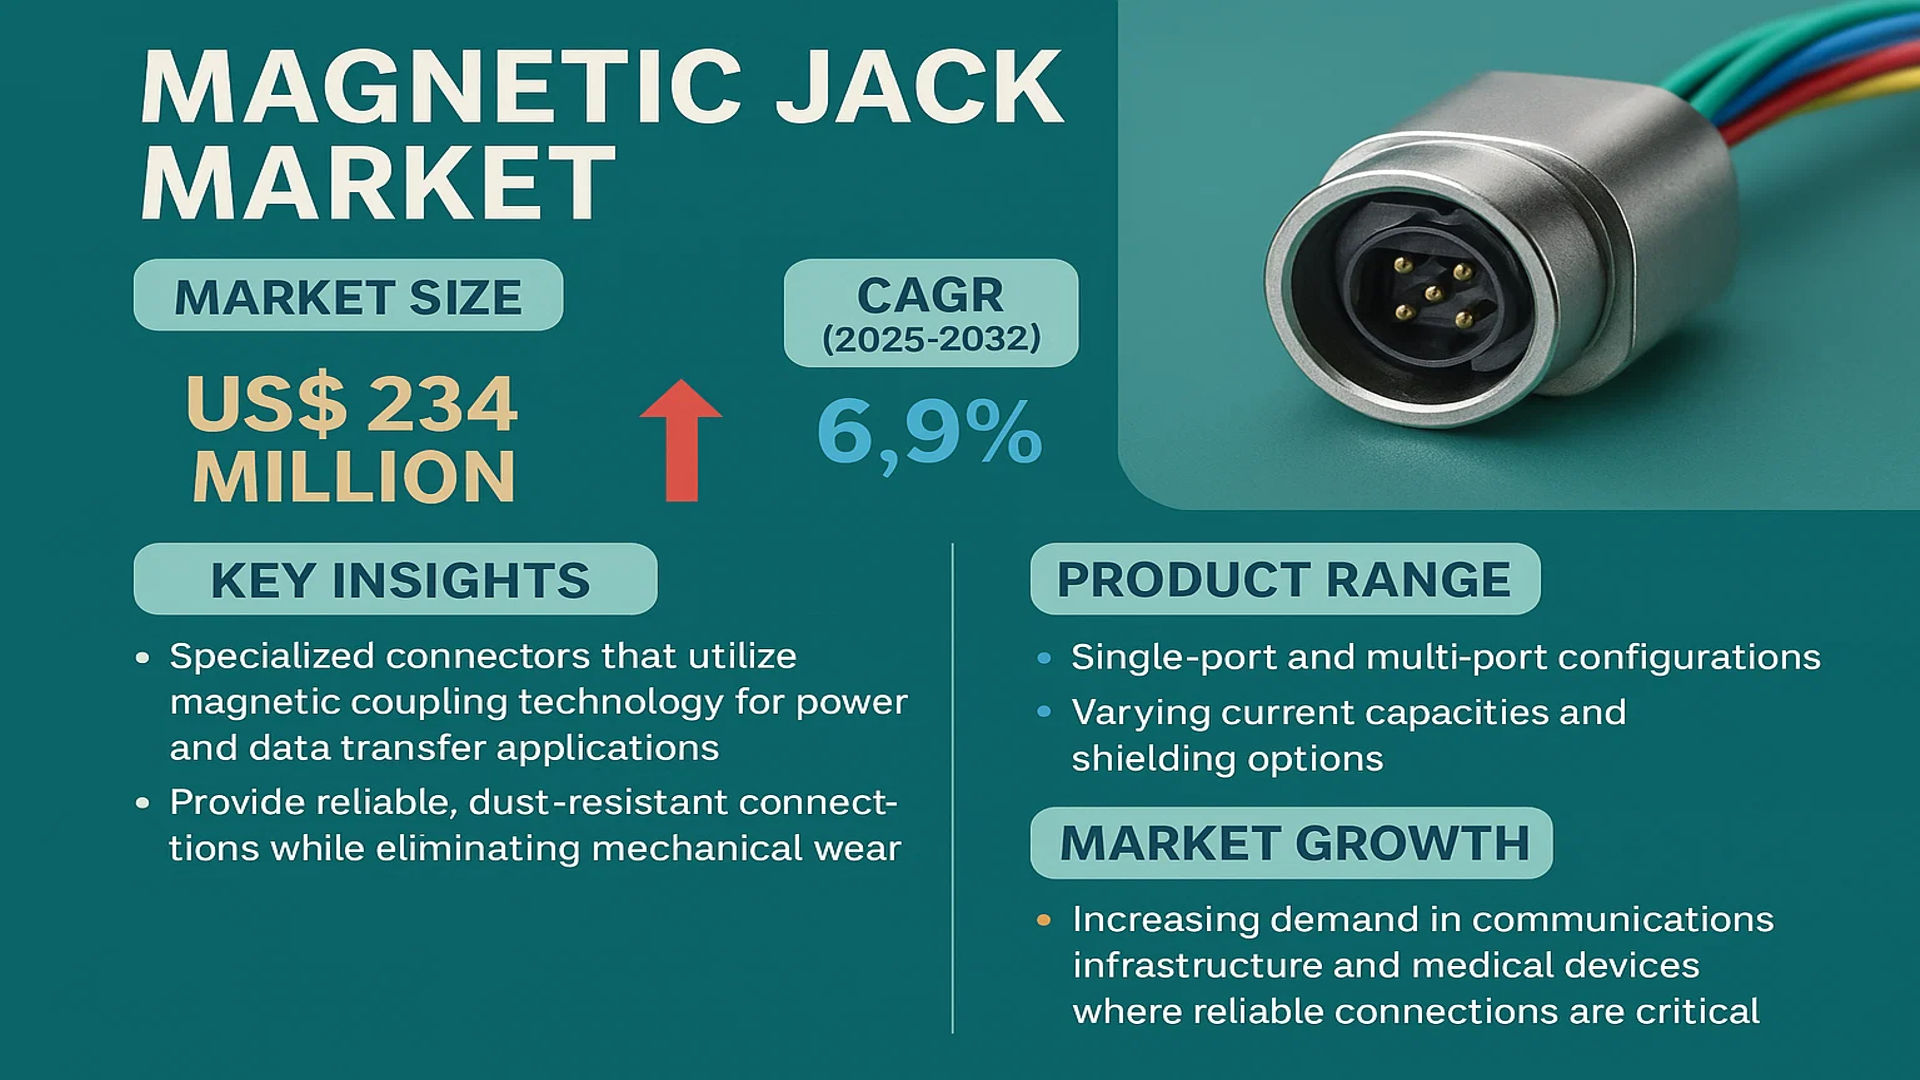
The global Magnetic Jack Market size was valued at US$ 234 million in 2024 and is projected to reach US$ 376 million by 2032, at a CAGR of 6.9% during the forecast period 2025-2032.

Magnetic jacks are specialized connectors that utilize magnetic coupling technology for power and data transfer applications. These components provide reliable, dust-resistant connections while eliminating mechanical wear, making them ideal for industrial, medical, and consumer electronics applications. The product range includes single-port and multi-port configurations with varying current capacities and shielding options.

The market growth is driven by increasing demand in communications infrastructure and medical devices, where reliable connections are critical. However, supply chain disruptions and raw material price volatility pose challenges. Leading manufacturers like Molex and Amphenol are expanding production capacities, with the top five players holding approximately 42% market share in 2024. The U.S. accounts for 28% of global demand, while China’s market is growing at 8.2% CAGR due to electronics manufacturing expansion.

Magnetic Jack Market

MARKET DYNAMICS

MARKET DRIVERS

Rising Demand in Consumer Electronics to Accelerate Magnetic Jack Adoption

The global surge in smartphone and wearable device production is significantly driving the magnetic jack market. With over 1.4 billion smartphones shipped annually and wearable shipments exceeding 500 million units globally, manufacturers increasingly adopt magnetic jacks for their durability and space-saving advantages. These components offer secure connectivity while reducing port damage—a critical factor as device miniaturization continues to dominate product development strategies across major electronics brands.

Medical Sector Modernization Creates New Growth Avenues

Healthcare facilities globally are transitioning to wireless medical devices equipped with magnetic charging solutions, with the medical connectors market projected to maintain a steady growth rate. Magnetic jacks prove indispensable in this shift, providing reliable sterilization-resistant connections for equipment ranging from patient monitors to portable diagnostic tools. Their fail-safe disconnection feature prevents accidental equipment damage during emergencies, making them particularly valuable in critical care environments where reliability is paramount.

An estimated 65% of new medical devices now incorporate some form of magnetic connectivity, reflecting broader industry acceptance.

Furthermore, industrial automation trends are amplifying demand, with magnetic jacks becoming standard in factory robotics and IoT-enabled equipment due to their vibration resistance and easy maintenance—features that reduce downtime in high-throughput manufacturing environments.

MARKET RESTRAINTS

Standardization Challenges Hinder Cross-Industry Adoption

Despite growing popularity, the lack of universal standards for magnetic jack configurations creates compatibility issues across devices. Over 30 distinct magnetic connector types currently exist in the consumer electronics sector alone, forcing manufacturers to develop proprietary solutions rather than benefit from economies of scale. This fragmentation increases production costs and complicates supply chain management, particularly for smaller manufacturers unable to justify customized connector development.

Thermal Limitations Restrict High-Power Applications

While ideal for low-to-medium power transfer, most magnetic jacks struggle with thermal management in high-current scenarios above 5A, limiting their use in industrial machinery and electric vehicle charging. The core technology faces inherent challenges in heat dissipation—a critical factor preventing broader adoption in power-intensive sectors that require continuous operation under heavy loads. These technical constraints necessitate ongoing material science innovations to expand application possibilities.

MARKET OPPORTUNITIES

Emerging Wireless Charging Integration Opens New Frontiers

The convergence of magnetic jack technology with wireless power transfer systems presents a transformative opportunity. Several leading automotive manufacturers are piloting hybrid charging solutions that combine magnetic alignment with inductive charging—a development that could redefine EV charging infrastructure. This dual approach addresses alignment precision challenges while maintaining the convenience of contactless power transfer, potentially creating a new standard for next-generation charging systems.

Military & Aerospace Modernization Drives Specialty Demand

Defense sector modernization programs globally are specifying ruggedized magnetic connectors for new aircraft and naval systems, valuing their resistance to vibration and environmental contaminants. With defense budgets increasing across major economies, this niche segment shows particular promise for manufacturers capable of meeting stringent MIL-SPEC certifications. The ability to maintain connectivity in extreme conditions makes magnetic jacks ideal for unmanned systems and portable military electronics undergoing field deployment.

MARKET CHALLENGES

Material Cost Volatility Impacts Profit Margins

Rare earth magnet components essential for high-performance magnetic jacks face supply chain uncertainties, with neodymium prices fluctuating up to 30% annually. This volatility complicates long-term product pricing strategies, particularly for manufacturers serving cost-sensitive consumer markets. The geopolitical concentration of rare earth mineral production further exacerbates supply risks, prompting some manufacturers to explore alternative materials with reduced performance trade-offs.

Other Challenges

Miniaturization Limits
As devices shrink, maintaining magnetic coupling strength while reducing jack dimensions presents engineering hurdles. Current designs struggle to deliver reliable connections below 4mm thickness without compromising durability—a threshold that limits adoption in ultra-thin device categories.

Water Resistance Trade-offs
Achieving IP68 waterproofing with magnetic connectors requires complex sealing solutions that often increase production costs by 15-20%. This creates market segmentation between premium and budget devices, slowing widespread adoption across all price tiers.

MAGNETIC JACK MARKET TRENDS

Rising Demand for Compact Connectivity Solutions in Electronics to Drive Market Growth

The global Magnetic Jack market is experiencing significant growth driven by the increasing demand for compact, reliable, and high-performance connectivity solutions in various industries. Widely used in applications such as communications, medical devices, and consumer electronics, magnetic jacks provide secure and efficient power and data transfer while minimizing wear and tear. With the market projected to reach $XX million by 2032, growing at a CAGR of X%, manufacturers are focusing on developing advanced multi-port and single-port configurations to meet diverse industry needs. The U.S. remains a key market, while China shows the fastest growth potential due to rapid industrialization and technological adoption.

Other Trends

Adoption in Medical and Industrial Applications

The medical sector is leveraging magnetic jacks for secure, interference-free connections in diagnostic and therapeutic devices, reducing mechanical stress on ports during frequent plugging/unplugging. Industrial automation is another major growth area, where robust magnetic jacks enhance data connectivity in harsh environments. The segment is expected to grow at X% CAGR over the forecast period, fueled by Industry 4.0 advancements. In 2024, industrial applications accounted for XX% of the total market share, with projections indicating further expansion.

Technological Innovations in Consumer Electronics

With consumer electronics manufacturers prioritizing sleek, durable designs, magnetic jacks are becoming essential for fast-charging ports and modular accessories in smartphones, laptops, and wearables. Leading brands are integrating reversible magnetic connectors to improve user experience, accelerating the single-port segment growth, which is anticipated to surpass $XX million by 2032. Meanwhile, advancements in corrosion-resistant materials and miniaturization are broadening adoption in IoT devices. Collaboration between manufacturers and OEMs is driving customized solutions, further fueling market expansion.

COMPETITIVE LANDSCAPE

Key Industry Players

Manufacturers Expand Technological Capabilities to Secure Market Share

The global magnetic jack market exhibits a competitive ecosystem characterized by the presence of established global players, regional specialists, and innovative startups. Molex has emerged as the dominant force in 2024, commanding approximately 18% revenue share through its patented magnetic jack solutions for high-speed data transmission applications. This leadership stems from their vertically integrated manufacturing capabilities and strategic partnerships with telecommunications giants.

Amphenol follows closely, leveraging its military-grade connector expertise to capture 15% of the industrial & instrumentation segment. Their recent acquisition of EDAC in early 2024 strengthened their intellectual property portfolio concerning vibration-resistant magnetic coupling designs. Meanwhile, E-JAX and CUI Devices are making significant inroads in consumer electronics, where cost-efficient miniaturized solutions are paramount.

Smaller players like KINSUN Industries and Link-PP are adopting niche strategies – the former focusing on medical-grade magnetic jacks with EMI shielding, while the latter develops waterproof variants for marine applications. This specialization allows them to compete effectively despite the R&D budgets of larger corporations.

The competitive intensity is expected to heighten as INGKE Technology accelerates its European expansion, having secured ISO 13485 certification for medical device connectivity solutions. Simultaneously, Japanese manufacturers are likely to gain traction in the APAC region through localized production facilities, potentially reshaping regional supply chain dynamics. Market leaders are responding by increasing after-sales support services and offering customizable firmware integration, creating new differentiation avenues beyond hardware specifications.

List of Key Magnetic Jack Manufacturers Profiled

  • Molex (U.S.)
  • Amphenol Corporation (U.S.)
  • E-JAX (China)
  • CUI Devices (U.S.)
  • INGKE Technology Co., Ltd. (China)
  • KINSUN Industries Inc. (Taiwan)
  • NorComp Inc. (U.S.)
  • EDAC Inc. (U.S.)
  • Link-PP Technology (Shenzhen) Co., Ltd. (China)

Segment Analysis:

By Type

Single-Port Segment Leads the Market Owing to High Demand in Compact Electronic Devices

The market is segmented based on type into:

  • Single-Port
  • Multi-Port

By Application

Communication Segment Dominates Due to Widespread Usage in Networking Equipment

The market is segmented based on application into:

  • Communications
  • Medical
  • Industrial & Instrumentation
  • Consumer Electronics
  • Other

By End-User

Enterprise Sector Holds Significant Share Due to Increased Connectivity Requirements

The market is segmented based on end-user into:

  • Telecommunication Providers
  • Healthcare Facilities
  • Manufacturing Plants
  • Consumer Electronics Manufacturers
  • Others

By Material

Nickel-Plated Copper Segment Gains Traction for Its Durability and Conductivity

The market is segmented based on material into:

  • Brass
  • Nickel-Plated Copper
  • Stainless Steel
  • Others

Regional Analysis: Magnetic Jack Market

Asia-Pacific
The Asia-Pacific region dominates the global Magnetic Jack market, accounting for the largest revenue share in 2024. This is driven by two primary factors: China’s massive electronics manufacturing sector and India’s rapidly growing IT infrastructure. Chinese manufacturers have particularly embraced magnetic jack technology for consumer electronics and industrial automation systems, where space-saving connector solutions are in high demand. Japan and South Korea contribute significantly through their advanced medical equipment sectors, where magnetic jacks are preferred for their reliability in critical applications. However, price competition remains intense across the region, with local manufacturers increasingly challenging established global players. The rollout of 5G networks and expansion of data center infrastructure present key growth opportunities, particularly for high-performance multi-port variants.

North America
North America represents the second-largest market for Magnetic Jacks, with the U.S. contributing approximately 70% of the regional revenue. The market benefits from strong demand in the medical device and telecommunications sectors, where product reliability and miniaturization are critical. Regulatory standards for electromagnetic interference (EMI) in medical and aerospace applications drive adoption of premium-quality magnetic jacks. Major technology hubs like Silicon Valley and Boston’s medical device corridor serve as innovation centers for connector technologies. Canada’s growing industrial IoT sector and Mexico’s electronics manufacturing industry provide additional growth channels. However, the market faces challenges from the gradual saturation in some application segments and the high cost of specialized military/aerospace grade components.

Europe
Europe maintains a steady position in the Magnetic Jack market, characterized by high-value applications rather than volume sales. Germany leads in industrial automation adoption, while the UK and France show strong demand in medical and test/measurement equipment. The region’s stringent environmental regulations, particularly RoHS and REACH compliance requirements, have pushed manufacturers to develop lead-free and more durable connector solutions. European research institutions frequently collaborate with manufacturers on next-generation designs, particularly for harsh environment applications. The automotive sector’s shift toward electric vehicles presents new opportunities for magnetic jacks in charging systems and onboard electronics. However, relatively slow industrial growth in some countries has moderated market expansion compared to Asia.

South America
South America represents an emerging market for Magnetic Jack technologies, with Brazil accounting for over 50% of regional demand. Growth is primarily driven by the telecommunications sector’s expansion and increasing automation in mining and oil/gas operations. The relatively low penetration of advanced connector technologies leaves room for market growth, though economic instabilities in key countries create purchasing uncertainties. Argentina and Chile show promising adoption in renewable energy systems and industrial equipment. Price sensitivity remains high across the region, favoring simpler single-port designs over advanced multi-port configurations. Infrastructure limitations and import dependencies continue to challenge more rapid market development.

Middle East & Africa
The Middle East & Africa region shows gradual but steady growth in Magnetic Jack adoption. The UAE and Saudi Arabia lead in telecommunications infrastructure investments, while South Africa serves as the main industrial hub. Oil and gas applications drive demand for ruggedized connector solutions in harsh environments. Israel’s thriving medical technology and defense sectors utilize specialized magnetic jack variants. However, the market remains constrained by limited local manufacturing capabilities and reliance on imports. Africa’s developing digital infrastructure presents long-term opportunities, though current growth is concentrated in a few urban centers. The region’s focus on renewable energy projects, particularly in North Africa, may accelerate future demand for durable connectivity solutions.

Report Scope

This market research report provides a comprehensive analysis of the global Magnetic Jack market, covering the forecast period 2025–2032. It offers detailed insights into market dynamics, technological advancements, competitive landscape, and key trends shaping the industry.

Key focus areas of the report include:

  • Market Size & Forecast: Historical data and future projections for revenue, unit shipments, and market value across major regions and segments.
  • Segmentation Analysis: Detailed breakdown by product type (Single-Port, Multi-Port), application (Communications, Medical, Industrial & Instrumentation, Consumer Electronics, Others), and end-user industry to identify high-growth segments.
  • Regional Outlook: Insights into market performance across North America, Europe, Asia-Pacific, Latin America, and the Middle East & Africa, including country-level analysis for key markets like the U.S., China, and Germany.
  • Competitive Landscape: Profiles of leading market participants including Molex, Amphenol, E-JAX, CUI Devices, and INGKE Technology, covering their product portfolios, market share, and strategic initiatives.
  • Technology Trends & Innovation: Assessment of emerging connector technologies, miniaturization trends, and integration with IoT/IIoT applications.
  • Market Drivers & Restraints: Evaluation of factors such as increasing demand for high-speed data transmission, growth in medical electronics, and challenges related to raw material costs.
  • Stakeholder Analysis: Strategic insights for component manufacturers, OEMs, distributors, and investors regarding supply chain dynamics and growth opportunities.

The analysis employs primary and secondary research methodologies, incorporating manufacturer surveys, trade data, and industry expert interviews to ensure data accuracy.

FREQUENTLY ASKED QUESTIONS:

What is the current market size of Global Magnetic Jack Market?

-> Magnetic Jack Market size was valued at US$ 234 million in 2024 and is projected to reach US$ 376 million by 2032, at a CAGR of 6.9% during the forecast period 2025-2032.

Which key companies operate in Global Magnetic Jack Market?

-> Key players include Molex, Amphenol, E-JAX, CUI Devices, INGKE Technology, KINSUN Industries Inc, NorComp, EDAC, and Link-PP.

What are the key growth drivers?

-> Key growth drivers include rising demand for compact connectors in consumer electronics, expansion of 5G infrastructure, and increasing medical device manufacturing.

Which region dominates the market?

-> Asia-Pacific leads in both production and consumption, while North America remains strong in high-end applications.

What are the emerging trends?

-> Emerging trends include development of waterproof magnetic jacks, higher current-carrying capacities, and integration with smart home systems.

Magnetic Jack Market, Trends, Business Strategies 2025-2032

Get Sample Report PDF for Exclusive Insights

Report Sample Includes

  • Table of Contents
  • List of Tables & Figures
  • Charts, Research Methodology, and more...
PDF Icon Download Sample Report PDF

Download Sample Report

Table of Content

1 Introduction to Research & Analysis Reports
1.1 Magnetic Jack Market Definition
1.2 Market Segments
1.2.1 Segment by Type
1.2.2 Segment by Application
1.3 Global Magnetic Jack Market Overview
1.4 Features & Benefits of This Report
1.5 Methodology & Sources of Information
1.5.1 Research Methodology
1.5.2 Research Process
1.5.3 Base Year
1.5.4 Report Assumptions & Caveats
2 Global Magnetic Jack Overall Market Size
2.1 Global Magnetic Jack Market Size: 2024 VS 2032
2.2 Global Magnetic Jack Market Size, Prospects & Forecasts: 2020-2032
2.3 Global Magnetic Jack Sales: 2020-2032
3 Company Landscape
3.1 Top Magnetic Jack Players in Global Market
3.2 Top Global Magnetic Jack Companies Ranked by Revenue
3.3 Global Magnetic Jack Revenue by Companies
3.4 Global Magnetic Jack Sales by Companies
3.5 Global Magnetic Jack Price by Manufacturer (2020-2025)
3.6 Top 3 and Top 5 Magnetic Jack Companies in Global Market, by Revenue in 2024
3.7 Global Manufacturers Magnetic Jack Product Type
3.8 Tier 1, Tier 2, and Tier 3 Magnetic Jack Players in Global Market
3.8.1 List of Global Tier 1 Magnetic Jack Companies
3.8.2 List of Global Tier 2 and Tier 3 Magnetic Jack Companies
4 Sights by Product
4.1 Overview
4.1.1 Segment by Type – Global Magnetic Jack Market Size Markets, 2024 & 2032
4.1.2 Single-Port
4.1.3 Multi-Port
4.2 Segment by Type – Global Magnetic Jack Revenue & Forecasts
4.2.1 Segment by Type – Global Magnetic Jack Revenue, 2020-2025
4.2.2 Segment by Type – Global Magnetic Jack Revenue, 2026-2032
4.2.3 Segment by Type – Global Magnetic Jack Revenue Market Share, 2020-2032
4.3 Segment by Type – Global Magnetic Jack Sales & Forecasts
4.3.1 Segment by Type – Global Magnetic Jack Sales, 2020-2025
4.3.2 Segment by Type – Global Magnetic Jack Sales, 2026-2032
4.3.3 Segment by Type – Global Magnetic Jack Sales Market Share, 2020-2032
4.4 Segment by Type – Global Magnetic Jack Price (Manufacturers Selling Prices), 2020-2032
5 Sights by Application
5.1 Overview
5.1.1 Segment by Application – Global Magnetic Jack Market Size, 2024 & 2032
5.1.2 Communications
5.1.3 Medical
5.1.4 Industrial & Instrumentation
5.1.5 Consumer Electronics
5.1.6 Other
5.2 Segment by Application – Global Magnetic Jack Revenue & Forecasts
5.2.1 Segment by Application – Global Magnetic Jack Revenue, 2020-2025
5.2.2 Segment by Application – Global Magnetic Jack Revenue, 2026-2032
5.2.3 Segment by Application – Global Magnetic Jack Revenue Market Share, 2020-2032
5.3 Segment by Application – Global Magnetic Jack Sales & Forecasts
5.3.1 Segment by Application – Global Magnetic Jack Sales, 2020-2025
5.3.2 Segment by Application – Global Magnetic Jack Sales, 2026-2032
5.3.3 Segment by Application – Global Magnetic Jack Sales Market Share, 2020-2032
5.4 Segment by Application – Global Magnetic Jack Price (Manufacturers Selling Prices), 2020-2032
6 Sights by Region
6.1 By Region – Global Magnetic Jack Market Size, 2024 & 2032
6.2 By Region – Global Magnetic Jack Revenue & Forecasts
6.2.1 By Region – Global Magnetic Jack Revenue, 2020-2025
6.2.2 By Region – Global Magnetic Jack Revenue, 2026-2032
6.2.3 By Region – Global Magnetic Jack Revenue Market Share, 2020-2032
6.3 By Region – Global Magnetic Jack Sales & Forecasts
6.3.1 By Region – Global Magnetic Jack Sales, 2020-2025
6.3.2 By Region – Global Magnetic Jack Sales, 2026-2032
6.3.3 By Region – Global Magnetic Jack Sales Market Share, 2020-2032
6.4 North America
6.4.1 By Country – North America Magnetic Jack Revenue, 2020-2032
6.4.2 By Country – North America Magnetic Jack Sales, 2020-2032
6.4.3 United States Magnetic Jack Market Size, 2020-2032
6.4.4 Canada Magnetic Jack Market Size, 2020-2032
6.4.5 Mexico Magnetic Jack Market Size, 2020-2032
6.5 Europe
6.5.1 By Country – Europe Magnetic Jack Revenue, 2020-2032
6.5.2 By Country – Europe Magnetic Jack Sales, 2020-2032
6.5.3 Germany Magnetic Jack Market Size, 2020-2032
6.5.4 France Magnetic Jack Market Size, 2020-2032
6.5.5 U.K. Magnetic Jack Market Size, 2020-2032
6.5.6 Italy Magnetic Jack Market Size, 2020-2032
6.5.7 Russia Magnetic Jack Market Size, 2020-2032
6.5.8 Nordic Countries Magnetic Jack Market Size, 2020-2032
6.5.9 Benelux Magnetic Jack Market Size, 2020-2032
6.6 Asia
6.6.1 By Region – Asia Magnetic Jack Revenue, 2020-2032
6.6.2 By Region – Asia Magnetic Jack Sales, 2020-2032
6.6.3 China Magnetic Jack Market Size, 2020-2032
6.6.4 Japan Magnetic Jack Market Size, 2020-2032
6.6.5 South Korea Magnetic Jack Market Size, 2020-2032
6.6.6 Southeast Asia Magnetic Jack Market Size, 2020-2032
6.6.7 India Magnetic Jack Market Size, 2020-2032
6.7 South America
6.7.1 By Country – South America Magnetic Jack Revenue, 2020-2032
6.7.2 By Country – South America Magnetic Jack Sales, 2020-2032
6.7.3 Brazil Magnetic Jack Market Size, 2020-2032
6.7.4 Argentina Magnetic Jack Market Size, 2020-2032
6.8 Middle East & Africa
6.8.1 By Country – Middle East & Africa Magnetic Jack Revenue, 2020-2032
6.8.2 By Country – Middle East & Africa Magnetic Jack Sales, 2020-2032
6.8.3 Turkey Magnetic Jack Market Size, 2020-2032
6.8.4 Israel Magnetic Jack Market Size, 2020-2032
6.8.5 Saudi Arabia Magnetic Jack Market Size, 2020-2032
6.8.6 UAE Magnetic Jack Market Size, 2020-2032
7 Manufacturers & Brands Profiles
7.1 Molex
7.1.1 Molex Company Summary
7.1.2 Molex Business Overview
7.1.3 Molex Magnetic Jack Major Product Offerings
7.1.4 Molex Magnetic Jack Sales and Revenue in Global (2020-2025)
7.1.5 Molex Key News & Latest Developments
7.2 Amphenol
7.2.1 Amphenol Company Summary
7.2.2 Amphenol Business Overview
7.2.3 Amphenol Magnetic Jack Major Product Offerings
7.2.4 Amphenol Magnetic Jack Sales and Revenue in Global (2020-2025)
7.2.5 Amphenol Key News & Latest Developments
7.3 E-JAX
7.3.1 E-JAX Company Summary
7.3.2 E-JAX Business Overview
7.3.3 E-JAX Magnetic Jack Major Product Offerings
7.3.4 E-JAX Magnetic Jack Sales and Revenue in Global (2020-2025)
7.3.5 E-JAX Key News & Latest Developments
7.4 CUI Devices
7.4.1 CUI Devices Company Summary
7.4.2 CUI Devices Business Overview
7.4.3 CUI Devices Magnetic Jack Major Product Offerings
7.4.4 CUI Devices Magnetic Jack Sales and Revenue in Global (2020-2025)
7.4.5 CUI Devices Key News & Latest Developments
7.5 INGKE Technology
7.5.1 INGKE Technology Company Summary
7.5.2 INGKE Technology Business Overview
7.5.3 INGKE Technology Magnetic Jack Major Product Offerings
7.5.4 INGKE Technology Magnetic Jack Sales and Revenue in Global (2020-2025)
7.5.5 INGKE Technology Key News & Latest Developments
7.6 KINSUN Industries Inc
7.6.1 KINSUN Industries Inc Company Summary
7.6.2 KINSUN Industries Inc Business Overview
7.6.3 KINSUN Industries Inc Magnetic Jack Major Product Offerings
7.6.4 KINSUN Industries Inc Magnetic Jack Sales and Revenue in Global (2020-2025)
7.6.5 KINSUN Industries Inc Key News & Latest Developments
7.7 NorComp
7.7.1 NorComp Company Summary
7.7.2 NorComp Business Overview
7.7.3 NorComp Magnetic Jack Major Product Offerings
7.7.4 NorComp Magnetic Jack Sales and Revenue in Global (2020-2025)
7.7.5 NorComp Key News & Latest Developments
7.8 EDAC
7.8.1 EDAC Company Summary
7.8.2 EDAC Business Overview
7.8.3 EDAC Magnetic Jack Major Product Offerings
7.8.4 EDAC Magnetic Jack Sales and Revenue in Global (2020-2025)
7.8.5 EDAC Key News & Latest Developments
7.9 Link-PP
7.9.1 Link-PP Company Summary
7.9.2 Link-PP Business Overview
7.9.3 Link-PP Magnetic Jack Major Product Offerings
7.9.4 Link-PP Magnetic Jack Sales and Revenue in Global (2020-2025)
7.9.5 Link-PP Key News & Latest Developments
8 Global Magnetic Jack Production Capacity, Analysis
8.1 Global Magnetic Jack Production Capacity, 2020-2032
8.2 Magnetic Jack Production Capacity of Key Manufacturers in Global Market
8.3 Global Magnetic Jack Production by Region
9 Key Market Trends, Opportunity, Drivers and Restraints
9.1 Market Opportunities & Trends
9.2 Market Drivers
9.3 Market Restraints
10 Magnetic Jack Supply Chain Analysis
10.1 Magnetic Jack Industry Value Chain
10.2 Magnetic Jack Upstream Market
10.3 Magnetic Jack Downstream and Clients
10.4 Marketing Channels Analysis
10.4.1 Marketing Channels
10.4.2 Magnetic Jack Distributors and Sales Agents in Global
11 Conclusion
12 Appendix
12.1 Note
12.2 Examples of Clients
12.3 DisclaimerList of Tables
Table 1. Key Players of Magnetic Jack in Global Market
Table 2. Top Magnetic Jack Players in Global Market, Ranking by Revenue (2024)
Table 3. Global Magnetic Jack Revenue by Companies, (US$, Mn), 2020-2025
Table 4. Global Magnetic Jack Revenue Share by Companies, 2020-2025
Table 5. Global Magnetic Jack Sales by Companies, (Units), 2020-2025
Table 6. Global Magnetic Jack Sales Share by Companies, 2020-2025
Table 7. Key Manufacturers Magnetic Jack Price (2020-2025) & (US$/Unit)
Table 8. Global Manufacturers Magnetic Jack Product Type
Table 9. List of Global Tier 1 Magnetic Jack Companies, Revenue (US$, Mn) in 2024 and Market Share
Table 10. List of Global Tier 2 and Tier 3 Magnetic Jack Companies, Revenue (US$, Mn) in 2024 and Market Share
Table 11. Segment by Type – Global Magnetic Jack Revenue, (US$, Mn), 2024 & 2032
Table 12. Segment by Type – Global Magnetic Jack Revenue (US$, Mn), 2020-2025
Table 13. Segment by Type – Global Magnetic Jack Revenue (US$, Mn), 2026-2032
Table 14. Segment by Type – Global Magnetic Jack Sales (Units), 2020-2025
Table 15. Segment by Type – Global Magnetic Jack Sales (Units), 2026-2032
Table 16. Segment by Application – Global Magnetic Jack Revenue, (US$, Mn), 2024 & 2032
Table 17. Segment by Application – Global Magnetic Jack Revenue, (US$, Mn), 2020-2025
Table 18. Segment by Application – Global Magnetic Jack Revenue, (US$, Mn), 2026-2032
Table 19. Segment by Application – Global Magnetic Jack Sales, (Units), 2020-2025
Table 20. Segment by Application – Global Magnetic Jack Sales, (Units), 2026-2032
Table 21. By Region – Global Magnetic Jack Revenue, (US$, Mn), 2025-2032
Table 22. By Region – Global Magnetic Jack Revenue, (US$, Mn), 2020-2025
Table 23. By Region – Global Magnetic Jack Revenue, (US$, Mn), 2026-2032
Table 24. By Region – Global Magnetic Jack Sales, (Units), 2020-2025
Table 25. By Region – Global Magnetic Jack Sales, (Units), 2026-2032
Table 26. By Country – North America Magnetic Jack Revenue, (US$, Mn), 2020-2025
Table 27. By Country – North America Magnetic Jack Revenue, (US$, Mn), 2026-2032
Table 28. By Country – North America Magnetic Jack Sales, (Units), 2020-2025
Table 29. By Country – North America Magnetic Jack Sales, (Units), 2026-2032
Table 30. By Country – Europe Magnetic Jack Revenue, (US$, Mn), 2020-2025
Table 31. By Country – Europe Magnetic Jack Revenue, (US$, Mn), 2026-2032
Table 32. By Country – Europe Magnetic Jack Sales, (Units), 2020-2025
Table 33. By Country – Europe Magnetic Jack Sales, (Units), 2026-2032
Table 34. By Region – Asia Magnetic Jack Revenue, (US$, Mn), 2020-2025
Table 35. By Region – Asia Magnetic Jack Revenue, (US$, Mn), 2026-2032
Table 36. By Region – Asia Magnetic Jack Sales, (Units), 2020-2025
Table 37. By Region – Asia Magnetic Jack Sales, (Units), 2026-2032
Table 38. By Country – South America Magnetic Jack Revenue, (US$, Mn), 2020-2025
Table 39. By Country – South America Magnetic Jack Revenue, (US$, Mn), 2026-2032
Table 40. By Country – South America Magnetic Jack Sales, (Units), 2020-2025
Table 41. By Country – South America Magnetic Jack Sales, (Units), 2026-2032
Table 42. By Country – Middle East & Africa Magnetic Jack Revenue, (US$, Mn), 2020-2025
Table 43. By Country – Middle East & Africa Magnetic Jack Revenue, (US$, Mn), 2026-2032
Table 44. By Country – Middle East & Africa Magnetic Jack Sales, (Units), 2020-2025
Table 45. By Country – Middle East & Africa Magnetic Jack Sales, (Units), 2026-2032
Table 46. Molex Company Summary
Table 47. Molex Magnetic Jack Product Offerings
Table 48. Molex Magnetic Jack Sales (Units), Revenue (US$, Mn) and Average Price (US$/Unit) & (2020-2025)
Table 49. Molex Key News & Latest Developments
Table 50. Amphenol Company Summary
Table 51. Amphenol Magnetic Jack Product Offerings
Table 52. Amphenol Magnetic Jack Sales (Units), Revenue (US$, Mn) and Average Price (US$/Unit) & (2020-2025)
Table 53. Amphenol Key News & Latest Developments
Table 54. E-JAX Company Summary
Table 55. E-JAX Magnetic Jack Product Offerings
Table 56. E-JAX Magnetic Jack Sales (Units), Revenue (US$, Mn) and Average Price (US$/Unit) & (2020-2025)
Table 57. E-JAX Key News & Latest Developments
Table 58. CUI Devices Company Summary
Table 59. CUI Devices Magnetic Jack Product Offerings
Table 60. CUI Devices Magnetic Jack Sales (Units), Revenue (US$, Mn) and Average Price (US$/Unit) & (2020-2025)
Table 61. CUI Devices Key News & Latest Developments
Table 62. INGKE Technology Company Summary
Table 63. INGKE Technology Magnetic Jack Product Offerings
Table 64. INGKE Technology Magnetic Jack Sales (Units), Revenue (US$, Mn) and Average Price (US$/Unit) & (2020-2025)
Table 65. INGKE Technology Key News & Latest Developments
Table 66. KINSUN Industries Inc Company Summary
Table 67. KINSUN Industries Inc Magnetic Jack Product Offerings
Table 68. KINSUN Industries Inc Magnetic Jack Sales (Units), Revenue (US$, Mn) and Average Price (US$/Unit) & (2020-2025)
Table 69. KINSUN Industries Inc Key News & Latest Developments
Table 70. NorComp Company Summary
Table 71. NorComp Magnetic Jack Product Offerings
Table 72. NorComp Magnetic Jack Sales (Units), Revenue (US$, Mn) and Average Price (US$/Unit) & (2020-2025)
Table 73. NorComp Key News & Latest Developments
Table 74. EDAC Company Summary
Table 75. EDAC Magnetic Jack Product Offerings
Table 76. EDAC Magnetic Jack Sales (Units), Revenue (US$, Mn) and Average Price (US$/Unit) & (2020-2025)
Table 77. EDAC Key News & Latest Developments
Table 78. Link-PP Company Summary
Table 79. Link-PP Magnetic Jack Product Offerings
Table 80. Link-PP Magnetic Jack Sales (Units), Revenue (US$, Mn) and Average Price (US$/Unit) & (2020-2025)
Table 81. Link-PP Key News & Latest Developments
Table 82. Magnetic Jack Capacity of Key Manufacturers in Global Market, 2023-2025 (Units)
Table 83. Global Magnetic Jack Capacity Market Share of Key Manufacturers, 2023-2025
Table 84. Global Magnetic Jack Production by Region, 2020-2025 (Units)
Table 85. Global Magnetic Jack Production by Region, 2026-2032 (Units)
Table 86. Magnetic Jack Market Opportunities & Trends in Global Market
Table 87. Magnetic Jack Market Drivers in Global Market
Table 88. Magnetic Jack Market Restraints in Global Market
Table 89. Magnetic Jack Raw Materials
Table 90. Magnetic Jack Raw Materials Suppliers in Global Market
Table 91. Typical Magnetic Jack Downstream
Table 92. Magnetic Jack Downstream Clients in Global Market
Table 93. Magnetic Jack Distributors and Sales Agents in Global Market

List of Figures
Figure 1. Magnetic Jack Product Picture
Figure 2. Magnetic Jack Segment by Type in 2024
Figure 3. Magnetic Jack Segment by Application in 2024
Figure 4. Global Magnetic Jack Market Overview: 2024
Figure 5. Key Caveats
Figure 6. Global Magnetic Jack Market Size: 2024 VS 2032 (US$, Mn)
Figure 7. Global Magnetic Jack Revenue: 2020-2032 (US$, Mn)
Figure 8. Magnetic Jack Sales in Global Market: 2020-2032 (Units)
Figure 9. The Top 3 and 5 Players Market Share by Magnetic Jack Revenue in 2024
Figure 10. Segment by Type – Global Magnetic Jack Revenue, (US$, Mn), 2024 & 2032
Figure 11. Segment by Type – Global Magnetic Jack Revenue Market Share, 2020-2032
Figure 12. Segment by Type – Global Magnetic Jack Sales Market Share, 2020-2032
Figure 13. Segment by Type – Global Magnetic Jack Price (US$/Unit), 2020-2032
Figure 14. Segment by Application – Global Magnetic Jack Revenue, (US$, Mn), 2024 & 2032
Figure 15. Segment by Application – Global Magnetic Jack Revenue Market Share, 2020-2032
Figure 16. Segment by Application – Global Magnetic Jack Sales Market Share, 2020-2032
Figure 17. Segment by Application -Global Magnetic Jack Price (US$/Unit), 2020-2032
Figure 18. By Region – Global Magnetic Jack Revenue, (US$, Mn), 2025 & 2032
Figure 19. By Region – Global Magnetic Jack Revenue Market Share, 2020 VS 2024 VS 2032
Figure 20. By Region – Global Magnetic Jack Revenue Market Share, 2020-2032
Figure 21. By Region – Global Magnetic Jack Sales Market Share, 2020-2032
Figure 22. By Country – North America Magnetic Jack Revenue Market Share, 2020-2032
Figure 23. By Country – North America Magnetic Jack Sales Market Share, 2020-2032
Figure 24. United States Magnetic Jack Revenue, (US$, Mn), 2020-2032
Figure 25. Canada Magnetic Jack Revenue, (US$, Mn), 2020-2032
Figure 26. Mexico Magnetic Jack Revenue, (US$, Mn), 2020-2032
Figure 27. By Country – Europe Magnetic Jack Revenue Market Share, 2020-2032
Figure 28. By Country – Europe Magnetic Jack Sales Market Share, 2020-2032
Figure 29. Germany Magnetic Jack Revenue, (US$, Mn), 2020-2032
Figure 30. France Magnetic Jack Revenue, (US$, Mn), 2020-2032
Figure 31. U.K. Magnetic Jack Revenue, (US$, Mn), 2020-2032
Figure 32. Italy Magnetic Jack Revenue, (US$, Mn), 2020-2032
Figure 33. Russia Magnetic Jack Revenue, (US$, Mn), 2020-2032
Figure 34. Nordic Countries Magnetic Jack Revenue, (US$, Mn), 2020-2032
Figure 35. Benelux Magnetic Jack Revenue, (US$, Mn), 2020-2032
Figure 36. By Region – Asia Magnetic Jack Revenue Market Share, 2020-2032
Figure 37. By Region – Asia Magnetic Jack Sales Market Share, 2020-2032
Figure 38. China Magnetic Jack Revenue, (US$, Mn), 2020-2032
Figure 39. Japan Magnetic Jack Revenue, (US$, Mn), 2020-2032
Figure 40. South Korea Magnetic Jack Revenue, (US$, Mn), 2020-2032
Figure 41. Southeast Asia Magnetic Jack Revenue, (US$, Mn), 2020-2032
Figure 42. India Magnetic Jack Revenue, (US$, Mn), 2020-2032
Figure 43. By Country – South America Magnetic Jack Revenue Market Share, 2020-2032
Figure 44. By Country – South America Magnetic Jack Sales, Market Share, 2020-2032
Figure 45. Brazil Magnetic Jack Revenue, (US$, Mn), 2020-2032
Figure 46. Argentina Magnetic Jack Revenue, (US$, Mn), 2020-2032
Figure 47. By Country – Middle East & Africa Magnetic Jack Revenue, Market Share, 2020-2032
Figure 48. By Country – Middle East & Africa Magnetic Jack Sales, Market Share, 2020-2032
Figure 49. Turkey Magnetic Jack Revenue, (US$, Mn), 2020-2032
Figure 50. Israel Magnetic Jack Revenue, (US$, Mn), 2020-2032
Figure 51. Saudi Arabia Magnetic Jack Revenue, (US$, Mn), 2020-2032
Figure 52. UAE Magnetic Jack Revenue, (US$, Mn), 2020-2032
Figure 53. Global Magnetic Jack Production Capacity (Units), 2020-2032
Figure 54. The Percentage of Production Magnetic Jack by Region, 2024 VS 2032
Figure 55. Magnetic Jack Industry Value Chain
Figure 56. Marketing Channels