1 Introduction to Research & Analysis Reports
1.1 LiTaO3 (LT) and LiNbO3 (LN) Crystal Market Definition
1.2 Market Segments
1.2.1 Segment by Type
1.2.2 Segment by Application
1.3 Global LiTaO3 (LT) and LiNbO3 (LN) Crystal Market Overview
1.4 Features & Benefits of This Report
1.5 Methodology & Sources of Information
1.5.1 Research Methodology
1.5.2 Research Process
1.5.3 Base Year
1.5.4 Report Assumptions & Caveats
2 Global LiTaO3 (LT) and LiNbO3 (LN) Crystal Overall Market Size
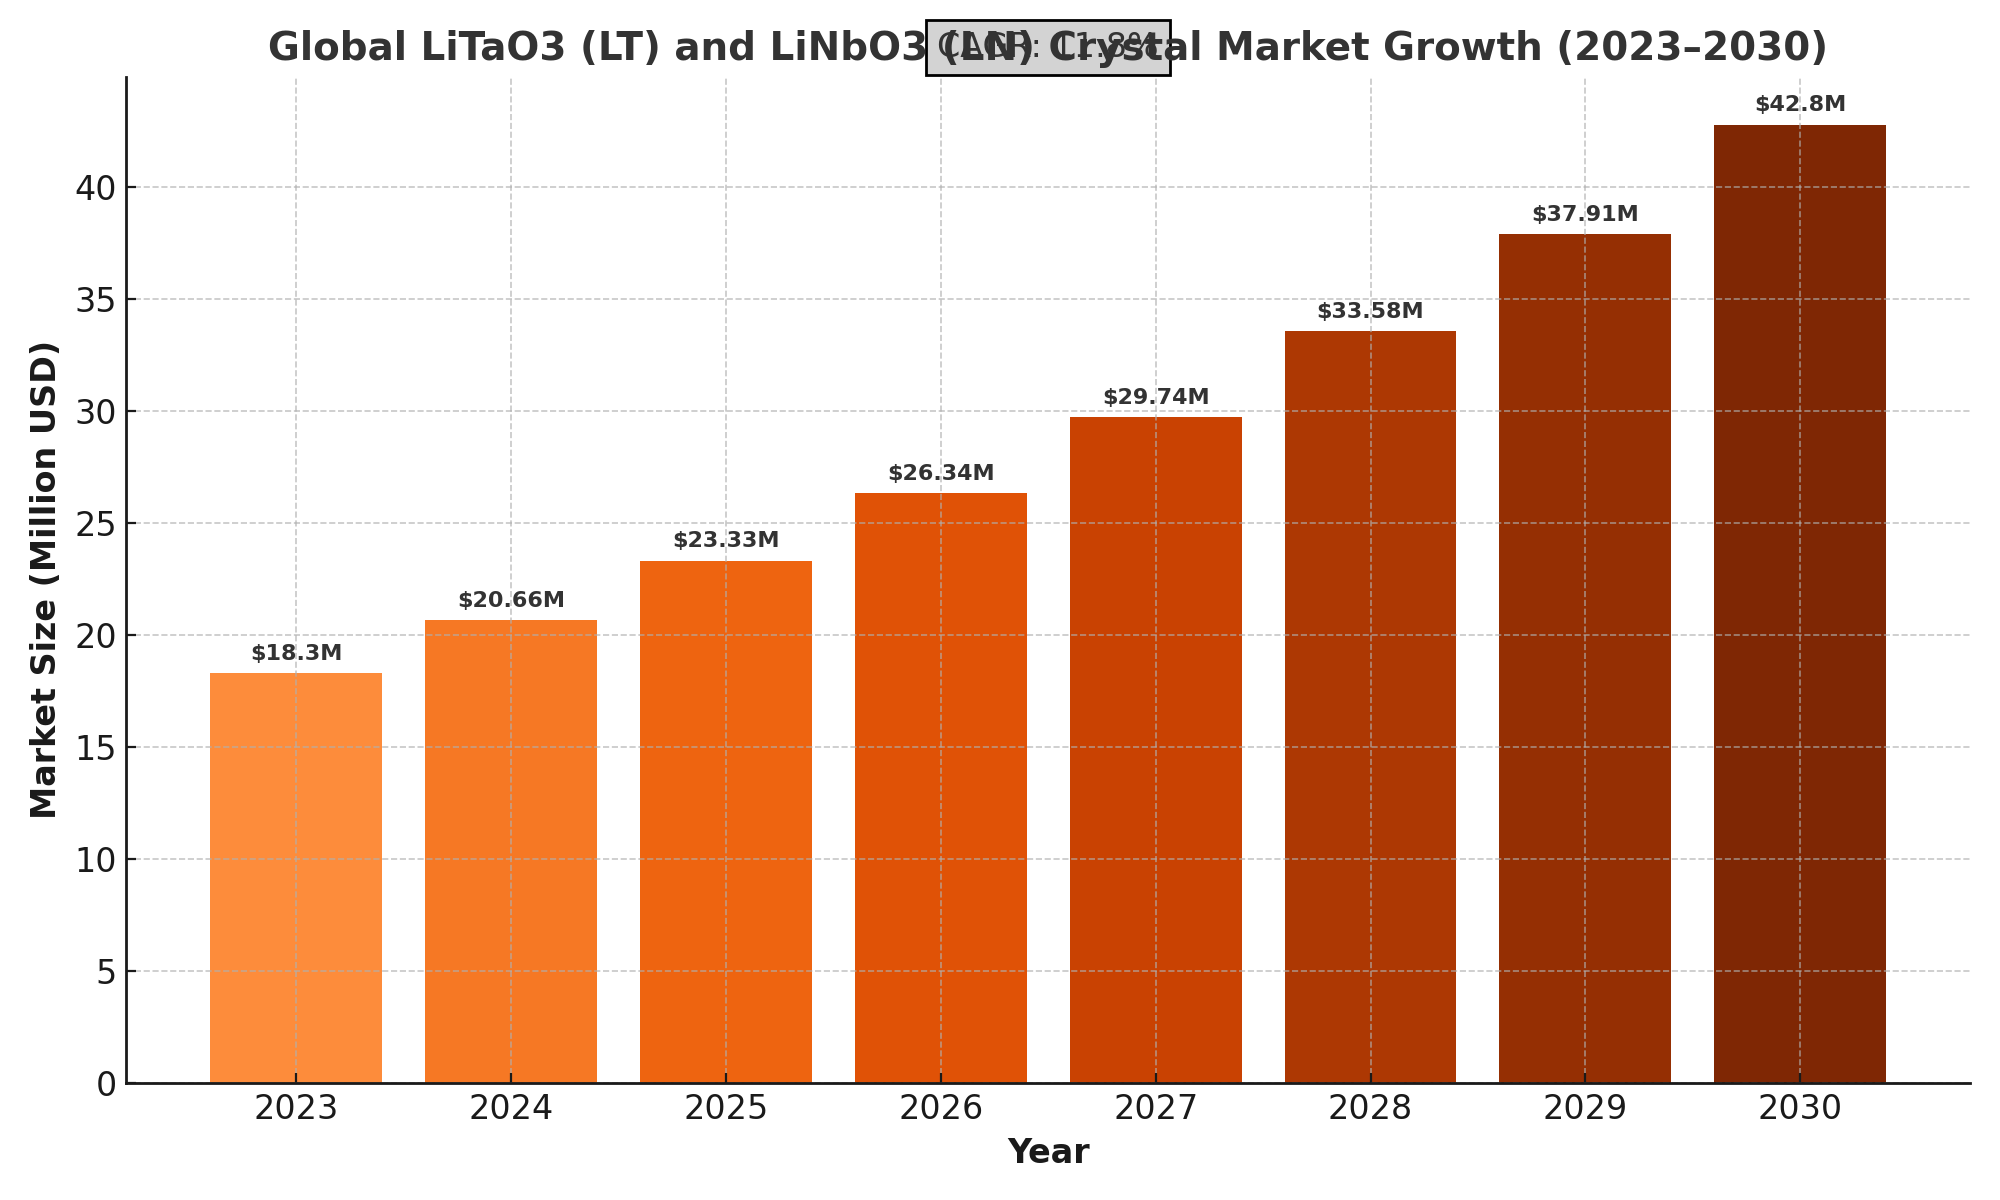
2.1 Global LiTaO3 (LT) and LiNbO3 (LN) Crystal Market Size: 2023 VS 2030
2.2 Global LiTaO3 (LT) and LiNbO3 (LN) Crystal Market Size, Prospects & Forecasts: 2019-2030
2.3 Global LiTaO3 (LT) and LiNbO3 (LN) Crystal Sales: 2019-2030
3 Company Landscape
3.1 Top LiTaO3 (LT) and LiNbO3 (LN) Crystal Players in Global Market
3.2 Top Global LiTaO3 (LT) and LiNbO3 (LN) Crystal Companies Ranked by Revenue
3.3 Global LiTaO3 (LT) and LiNbO3 (LN) Crystal Revenue by Companies
3.4 Global LiTaO3 (LT) and LiNbO3 (LN) Crystal Sales by Companies
3.5 Global LiTaO3 (LT) and LiNbO3 (LN) Crystal Price by Manufacturer (2019-2024)
3.6 Top 3 and Top 5 LiTaO3 (LT) and LiNbO3 (LN) Crystal Companies in Global Market, by Revenue in 2023
3.7 Global Manufacturers LiTaO3 (LT) and LiNbO3 (LN) Crystal Product Type
3.8 Tier 1, Tier 2, and Tier 3 LiTaO3 (LT) and LiNbO3 (LN) Crystal Players in Global Market
3.8.1 List of Global Tier 1 LiTaO3 (LT) and LiNbO3 (LN) Crystal Companies
3.8.2 List of Global Tier 2 and Tier 3 LiTaO3 (LT) and LiNbO3 (LN) Crystal Companies
4 Sights by Product
4.1 Overview
4.1.1 Segment by Type – Global LiTaO3 (LT) and LiNbO3 (LN) Crystal Market Size Markets, 2023 & 2030
4.1.2 LiTaO3 (LT) Crystal
4.1.3 LiNbO3 (LN) Crystal
4.2 Segment – Global LiTaO3 (LT) and LiNbO3 (LN) Crystal Revenue & Forecasts
4.2.1 Segment – Global LiTaO3 (LT) and LiNbO3 (LN) Crystal Revenue, 2019-2024
4.2.2 Segment – Global LiTaO3 (LT) and LiNbO3 (LN) Crystal Revenue, 2025-2030
4.2.3 Segment – Global LiTaO3 (LT) and LiNbO3 (LN) Crystal Revenue Market Share, 2019-2030
4.3 Segment – Global LiTaO3 (LT) and LiNbO3 (LN) Crystal Sales & Forecasts
4.3.1 Segment – Global LiTaO3 (LT) and LiNbO3 (LN) Crystal Sales, 2019-2024
4.3.2 Segment – Global LiTaO3 (LT) and LiNbO3 (LN) Crystal Sales, 2025-2030
4.3.3 Segment – Global LiTaO3 (LT) and LiNbO3 (LN) Crystal Sales Market Share, 2019-2030
4.4 Segment – Global LiTaO3 (LT) and LiNbO3 (LN) Crystal Price (Manufacturers Selling Prices), 2019-2030
5 Sights by Application
5.1 Overview
5.1.1 Segment by Application – Global LiTaO3 (LT) and LiNbO3 (LN) Crystal Market Size, 2023 & 2030
5.1.2 Modulator
5.1.3 Optical Isolator
5.1.4 Detector
5.1.5 Filter
5.1.6 Other
5.2 Segment by Application – Global LiTaO3 (LT) and LiNbO3 (LN) Crystal Revenue & Forecasts
5.2.1 Segment by Application – Global LiTaO3 (LT) and LiNbO3 (LN) Crystal Revenue, 2019-2024
5.2.2 Segment by Application – Global LiTaO3 (LT) and LiNbO3 (LN) Crystal Revenue, 2025-2030
5.2.3 Segment by Application – Global LiTaO3 (LT) and LiNbO3 (LN) Crystal Revenue Market Share, 2019-2030
5.3 Segment by Application – Global LiTaO3 (LT) and LiNbO3 (LN) Crystal Sales & Forecasts
5.3.1 Segment by Application – Global LiTaO3 (LT) and LiNbO3 (LN) Crystal Sales, 2019-2024
5.3.2 Segment by Application – Global LiTaO3 (LT) and LiNbO3 (LN) Crystal Sales, 2025-2030
5.3.3 Segment by Application – Global LiTaO3 (LT) and LiNbO3 (LN) Crystal Sales Market Share, 2019-2030
5.4 Segment by Application – Global LiTaO3 (LT) and LiNbO3 (LN) Crystal Price (Manufacturers Selling Prices), 2019-2030
6 Sights by Region
6.1 By Region – Global LiTaO3 (LT) and LiNbO3 (LN) Crystal Market Size, 2023 & 2030
6.2 By Region – Global LiTaO3 (LT) and LiNbO3 (LN) Crystal Revenue & Forecasts
6.2.1 By Region – Global LiTaO3 (LT) and LiNbO3 (LN) Crystal Revenue, 2019-2024
6.2.2 By Region – Global LiTaO3 (LT) and LiNbO3 (LN) Crystal Revenue, 2025-2030
6.2.3 By Region – Global LiTaO3 (LT) and LiNbO3 (LN) Crystal Revenue Market Share, 2019-2030
6.3 By Region – Global LiTaO3 (LT) and LiNbO3 (LN) Crystal Sales & Forecasts
6.3.1 By Region – Global LiTaO3 (LT) and LiNbO3 (LN) Crystal Sales, 2019-2024
6.3.2 By Region – Global LiTaO3 (LT) and LiNbO3 (LN) Crystal Sales, 2025-2030
6.3.3 By Region – Global LiTaO3 (LT) and LiNbO3 (LN) Crystal Sales Market Share, 2019-2030
6.4 North America
6.4.1 By Country – North America LiTaO3 (LT) and LiNbO3 (LN) Crystal Revenue, 2019-2030
6.4.2 By Country – North America LiTaO3 (LT) and LiNbO3 (LN) Crystal Sales, 2019-2030
6.4.3 United States LiTaO3 (LT) and LiNbO3 (LN) Crystal Market Size, 2019-2030
6.4.4 Canada LiTaO3 (LT) and LiNbO3 (LN) Crystal Market Size, 2019-2030
6.4.5 Mexico LiTaO3 (LT) and LiNbO3 (LN) Crystal Market Size, 2019-2030
6.5 Europe
6.5.1 By Country – Europe LiTaO3 (LT) and LiNbO3 (LN) Crystal Revenue, 2019-2030
6.5.2 By Country – Europe LiTaO3 (LT) and LiNbO3 (LN) Crystal Sales, 2019-2030
6.5.3 Germany LiTaO3 (LT) and LiNbO3 (LN) Crystal Market Size, 2019-2030
6.5.4 France LiTaO3 (LT) and LiNbO3 (LN) Crystal Market Size, 2019-2030
6.5.5 U.K. LiTaO3 (LT) and LiNbO3 (LN) Crystal Market Size, 2019-2030
6.5.6 Italy LiTaO3 (LT) and LiNbO3 (LN) Crystal Market Size, 2019-2030
6.5.7 Russia LiTaO3 (LT) and LiNbO3 (LN) Crystal Market Size, 2019-2030
6.5.8 Nordic Countries LiTaO3 (LT) and LiNbO3 (LN) Crystal Market Size, 2019-2030
6.5.9 Benelux LiTaO3 (LT) and LiNbO3 (LN) Crystal Market Size, 2019-2030
6.6 Asia
6.6.1 By Region – Asia LiTaO3 (LT) and LiNbO3 (LN) Crystal Revenue, 2019-2030
6.6.2 By Region – Asia LiTaO3 (LT) and LiNbO3 (LN) Crystal Sales, 2019-2030
6.6.3 China LiTaO3 (LT) and LiNbO3 (LN) Crystal Market Size, 2019-2030
6.6.4 Japan LiTaO3 (LT) and LiNbO3 (LN) Crystal Market Size, 2019-2030
6.6.5 South Korea LiTaO3 (LT) and LiNbO3 (LN) Crystal Market Size, 2019-2030
6.6.6 Southeast Asia LiTaO3 (LT) and LiNbO3 (LN) Crystal Market Size, 2019-2030
6.6.7 India LiTaO3 (LT) and LiNbO3 (LN) Crystal Market Size, 2019-2030
6.7 South America
6.7.1 By Country – South America LiTaO3 (LT) and LiNbO3 (LN) Crystal Revenue, 2019-2030
6.7.2 By Country – South America LiTaO3 (LT) and LiNbO3 (LN) Crystal Sales, 2019-2030
6.7.3 Brazil LiTaO3 (LT) and LiNbO3 (LN) Crystal Market Size, 2019-2030
6.7.4 Argentina LiTaO3 (LT) and LiNbO3 (LN) Crystal Market Size, 2019-2030
6.8 Middle East & Africa
6.8.1 By Country – Middle East & Africa LiTaO3 (LT) and LiNbO3 (LN) Crystal Revenue, 2019-2030
6.8.2 By Country – Middle East & Africa LiTaO3 (LT) and LiNbO3 (LN) Crystal Sales, 2019-2030
6.8.3 Turkey LiTaO3 (LT) and LiNbO3 (LN) Crystal Market Size, 2019-2030
6.8.4 Israel LiTaO3 (LT) and LiNbO3 (LN) Crystal Market Size, 2019-2030
6.8.5 Saudi Arabia LiTaO3 (LT) and LiNbO3 (LN) Crystal Market Size, 2019-2030
6.8.6 UAE LiTaO3 (LT) and LiNbO3 (LN) Crystal Market Size, 2019-2030
7 Manufacturers & Brands Profiles
7.1 Fujian Castech
7.1.1 Fujian Castech Company Summary
7.1.2 Fujian Castech Business Overview
7.1.3 Fujian Castech LiTaO3 (LT) and LiNbO3 (LN) Crystal Major Product Offerings
7.1.4 Fujian Castech LiTaO3 (LT) and LiNbO3 (LN) Crystal Sales and Revenue in Global (2019-2024)
7.1.5 Fujian Castech Key News & Latest Developments
7.2 Sumitomo Metal Mining
7.2.1 Sumitomo Metal Mining Company Summary
7.2.2 Sumitomo Metal Mining Business Overview
7.2.3 Sumitomo Metal Mining LiTaO3 (LT) and LiNbO3 (LN) Crystal Major Product Offerings
7.2.4 Sumitomo Metal Mining LiTaO3 (LT) and LiNbO3 (LN) Crystal Sales and Revenue in Global (2019-2024)
7.2.5 Sumitomo Metal Mining Key News & Latest Developments
7.3 Eksma Optics
7.3.1 Eksma Optics Company Summary
7.3.2 Eksma Optics Business Overview
7.3.3 Eksma Optics LiTaO3 (LT) and LiNbO3 (LN) Crystal Major Product Offerings
7.3.4 Eksma Optics LiTaO3 (LT) and LiNbO3 (LN) Crystal Sales and Revenue in Global (2019-2024)
7.3.5 Eksma Optics Key News & Latest Developments
7.4 Gooch & Housego
7.4.1 Gooch & Housego Company Summary
7.4.2 Gooch & Housego Business Overview
7.4.3 Gooch & Housego LiTaO3 (LT) and LiNbO3 (LN) Crystal Major Product Offerings
7.4.4 Gooch & Housego LiTaO3 (LT) and LiNbO3 (LN) Crystal Sales and Revenue in Global (2019-2024)
7.4.5 Gooch & Housego Key News & Latest Developments
7.5 Inrad Optics
7.5.1 Inrad Optics Company Summary
7.5.2 Inrad Optics Business Overview
7.5.3 Inrad Optics LiTaO3 (LT) and LiNbO3 (LN) Crystal Major Product Offerings
7.5.4 Inrad Optics LiTaO3 (LT) and LiNbO3 (LN) Crystal Sales and Revenue in Global (2019-2024)
7.5.5 Inrad Optics Key News & Latest Developments
7.6 Chengdu Dien Tech
7.6.1 Chengdu Dien Tech Company Summary
7.6.2 Chengdu Dien Tech Business Overview
7.6.3 Chengdu Dien Tech LiTaO3 (LT) and LiNbO3 (LN) Crystal Major Product Offerings
7.6.4 Chengdu Dien Tech LiTaO3 (LT) and LiNbO3 (LN) Crystal Sales and Revenue in Global (2019-2024)
7.6.5 Chengdu Dien Tech Key News & Latest Developments
7.7 FUZHOU HUNDREDS OPTICS
7.7.1 FUZHOU HUNDREDS OPTICS Company Summary
7.7.2 FUZHOU HUNDREDS OPTICS Business Overview
7.7.3 FUZHOU HUNDREDS OPTICS LiTaO3 (LT) and LiNbO3 (LN) Crystal Major Product Offerings
7.7.4 FUZHOU HUNDREDS OPTICS LiTaO3 (LT) and LiNbO3 (LN) Crystal Sales and Revenue in Global (2019-2024)
7.7.5 FUZHOU HUNDREDS OPTICS Key News & Latest Developments
7.8 TDG Holding
7.8.1 TDG Holding Company Summary
7.8.2 TDG Holding Business Overview
7.8.3 TDG Holding LiTaO3 (LT) and LiNbO3 (LN) Crystal Major Product Offerings
7.8.4 TDG Holding LiTaO3 (LT) and LiNbO3 (LN) Crystal Sales and Revenue in Global (2019-2024)
7.8.5 TDG Holding Key News & Latest Developments
7.9 Shin-Etsu Chemical
7.9.1 Shin-Etsu Chemical Company Summary
7.9.2 Shin-Etsu Chemical Business Overview
7.9.3 Shin-Etsu Chemical LiTaO3 (LT) and LiNbO3 (LN) Crystal Major Product Offerings
7.9.4 Shin-Etsu Chemical LiTaO3 (LT) and LiNbO3 (LN) Crystal Sales and Revenue in Global (2019-2024)
7.9.5 Shin-Etsu Chemical Key News & Latest Developments
7.10 Korth Kristalle
7.10.1 Korth Kristalle Company Summary
7.10.2 Korth Kristalle Business Overview
7.10.3 Korth Kristalle LiTaO3 (LT) and LiNbO3 (LN) Crystal Major Product Offerings
7.10.4 Korth Kristalle LiTaO3 (LT) and LiNbO3 (LN) Crystal Sales and Revenue in Global (2019-2024)
7.10.5 Korth Kristalle Key News & Latest Developments
7.11 Jinan Caxin
7.11.1 Jinan Caxin Company Summary
7.11.2 Jinan Caxin Business Overview
7.11.3 Jinan Caxin LiTaO3 (LT) and LiNbO3 (LN) Crystal Major Product Offerings
7.11.4 Jinan Caxin LiTaO3 (LT) and LiNbO3 (LN) Crystal Sales and Revenue in Global (2019-2024)
7.11.5 Jinan Caxin Key News & Latest Developments
8 Global LiTaO3 (LT) and LiNbO3 (LN) Crystal Production Capacity, Analysis
8.1 Global LiTaO3 (LT) and LiNbO3 (LN) Crystal Production Capacity, 2019-2030
8.2 LiTaO3 (LT) and LiNbO3 (LN) Crystal Production Capacity of Key Manufacturers in Global Market
8.3 Global LiTaO3 (LT) and LiNbO3 (LN) Crystal Production by Region
9 Key Market Trends, Opportunity, Drivers and Restraints
9.1 Market Opportunities & Trends
9.2 Market Drivers
9.3 Market Restraints
10 LiTaO3 (LT) and LiNbO3 (LN) Crystal Supply Chain Analysis
10.1 LiTaO3 (LT) and LiNbO3 (LN) Crystal Industry Value Chain
10.2 LiTaO3 (LT) and LiNbO3 (LN) Crystal Upstream Market
10.3 LiTaO3 (LT) and LiNbO3 (LN) Crystal Downstream and Clients
10.4 Marketing Channels Analysis
10.4.1 Marketing Channels
10.4.2 LiTaO3 (LT) and LiNbO3 (LN) Crystal Distributors and Sales Agents in Global
11 Conclusion
12 Appendix
12.1 Note
12.2 Examples of Clients
12.3 DisclaimerList of Tables
Table 1. Key Players of LiTaO3 (LT) and LiNbO3 (LN) Crystal in Global Market
Table 2. Top LiTaO3 (LT) and LiNbO3 (LN) Crystal Players in Global Market, Ranking by Revenue (2023)
Table 3. Global LiTaO3 (LT) and LiNbO3 (LN) Crystal Revenue by Companies, (US$, Mn), 2019-2024
Table 4. Global LiTaO3 (LT) and LiNbO3 (LN) Crystal Revenue Share by Companies, 2019-2024
Table 5. Global LiTaO3 (LT) and LiNbO3 (LN) Crystal Sales by Companies, (K Pcs), 2019-2024
Table 6. Global LiTaO3 (LT) and LiNbO3 (LN) Crystal Sales Share by Companies, 2019-2024
Table 7. Key Manufacturers LiTaO3 (LT) and LiNbO3 (LN) Crystal Price (2019-2024) & (US$/Pcs)
Table 8. Global Manufacturers LiTaO3 (LT) and LiNbO3 (LN) Crystal Product Type
Table 9. List of Global Tier 1 LiTaO3 (LT) and LiNbO3 (LN) Crystal Companies, Revenue (US$, Mn) in 2023 and Market Share
Table 10. List of Global Tier 2 and Tier 3 LiTaO3 (LT) and LiNbO3 (LN) Crystal Companies, Revenue (US$, Mn) in 2023 and Market Share
Table 11. Segment by Type Global LiTaO3 (LT) and LiNbO3 (LN) Crystal Revenue, (US$, Mn), 2023 & 2030
Table 12. Segment by Type – Global LiTaO3 (LT) and LiNbO3 (LN) Crystal Revenue (US$, Mn), 2019-2024
Table 13. Segment by Type – Global LiTaO3 (LT) and LiNbO3 (LN) Crystal Revenue (US$, Mn), 2025-2030
Table 14. Segment by Type – Global LiTaO3 (LT) and LiNbO3 (LN) Crystal Sales (K Pcs), 2019-2024
Table 15. Segment by Type – Global LiTaO3 (LT) and LiNbO3 (LN) Crystal Sales (K Pcs), 2025-2030
Table 16. Segment by Application Global LiTaO3 (LT) and LiNbO3 (LN) Crystal Revenue, (US$, Mn), 2023 & 2030
Table 17. Segment by Application – Global LiTaO3 (LT) and LiNbO3 (LN) Crystal Revenue, (US$, Mn), 2019-2024
Table 18. Segment by Application – Global LiTaO3 (LT) and LiNbO3 (LN) Crystal Revenue, (US$, Mn), 2025-2030
Table 19. Segment by Application – Global LiTaO3 (LT) and LiNbO3 (LN) Crystal Sales, (K Pcs), 2019-2024
Table 20. Segment by Application – Global LiTaO3 (LT) and LiNbO3 (LN) Crystal Sales, (K Pcs), 2025-2030
Table 21. By Region Global LiTaO3 (LT) and LiNbO3 (LN) Crystal Revenue, (US$, Mn), 2023-2030
Table 22. By Region – Global LiTaO3 (LT) and LiNbO3 (LN) Crystal Revenue, (US$, Mn), 2019-2024
Table 23. By Region – Global LiTaO3 (LT) and LiNbO3 (LN) Crystal Revenue, (US$, Mn), 2025-2030
Table 24. By Region – Global LiTaO3 (LT) and LiNbO3 (LN) Crystal Sales, (K Pcs), 2019-2024
Table 25. By Region – Global LiTaO3 (LT) and LiNbO3 (LN) Crystal Sales, (K Pcs), 2025-2030
Table 26. By Country – North America LiTaO3 (LT) and LiNbO3 (LN) Crystal Revenue, (US$, Mn), 2019-2024
Table 27. By Country – North America LiTaO3 (LT) and LiNbO3 (LN) Crystal Revenue, (US$, Mn), 2025-2030
Table 28. By Country – North America LiTaO3 (LT) and LiNbO3 (LN) Crystal Sales, (K Pcs), 2019-2024
Table 29. By Country – North America LiTaO3 (LT) and LiNbO3 (LN) Crystal Sales, (K Pcs), 2025-2030
Table 30. By Country – Europe LiTaO3 (LT) and LiNbO3 (LN) Crystal Revenue, (US$, Mn), 2019-2024
Table 31. By Country – Europe LiTaO3 (LT) and LiNbO3 (LN) Crystal Revenue, (US$, Mn), 2025-2030
Table 32. By Country – Europe LiTaO3 (LT) and LiNbO3 (LN) Crystal Sales, (K Pcs), 2019-2024
Table 33. By Country – Europe LiTaO3 (LT) and LiNbO3 (LN) Crystal Sales, (K Pcs), 2025-2030
Table 34. By Region – Asia LiTaO3 (LT) and LiNbO3 (LN) Crystal Revenue, (US$, Mn), 2019-2024
Table 35. By Region – Asia LiTaO3 (LT) and LiNbO3 (LN) Crystal Revenue, (US$, Mn), 2025-2030
Table 36. By Region – Asia LiTaO3 (LT) and LiNbO3 (LN) Crystal Sales, (K Pcs), 2019-2024
Table 37. By Region – Asia LiTaO3 (LT) and LiNbO3 (LN) Crystal Sales, (K Pcs), 2025-2030
Table 38. By Country – South America LiTaO3 (LT) and LiNbO3 (LN) Crystal Revenue, (US$, Mn), 2019-2024
Table 39. By Country – South America LiTaO3 (LT) and LiNbO3 (LN) Crystal Revenue, (US$, Mn), 2025-2030
Table 40. By Country – South America LiTaO3 (LT) and LiNbO3 (LN) Crystal Sales, (K Pcs), 2019-2024
Table 41. By Country – South America LiTaO3 (LT) and LiNbO3 (LN) Crystal Sales, (K Pcs), 2025-2030
Table 42. By Country – Middle East & Africa LiTaO3 (LT) and LiNbO3 (LN) Crystal Revenue, (US$, Mn), 2019-2024
Table 43. By Country – Middle East & Africa LiTaO3 (LT) and LiNbO3 (LN) Crystal Revenue, (US$, Mn), 2025-2030
Table 44. By Country – Middle East & Africa LiTaO3 (LT) and LiNbO3 (LN) Crystal Sales, (K Pcs), 2019-2024
Table 45. By Country – Middle East & Africa LiTaO3 (LT) and LiNbO3 (LN) Crystal Sales, (K Pcs), 2025-2030
Table 46. Fujian Castech Company Summary
Table 47. Fujian Castech LiTaO3 (LT) and LiNbO3 (LN) Crystal Product Offerings
Table 48. Fujian Castech LiTaO3 (LT) and LiNbO3 (LN) Crystal Sales (K Pcs), Revenue (US$, Mn) and Average Price (US$/Pcs) & (2019-2024)
Table 49. Fujian Castech Key News & Latest Developments
Table 50. Sumitomo Metal Mining Company Summary
Table 51. Sumitomo Metal Mining LiTaO3 (LT) and LiNbO3 (LN) Crystal Product Offerings
Table 52. Sumitomo Metal Mining LiTaO3 (LT) and LiNbO3 (LN) Crystal Sales (K Pcs), Revenue (US$, Mn) and Average Price (US$/Pcs) & (2019-2024)
Table 53. Sumitomo Metal Mining Key News & Latest Developments
Table 54. Eksma Optics Company Summary
Table 55. Eksma Optics LiTaO3 (LT) and LiNbO3 (LN) Crystal Product Offerings
Table 56. Eksma Optics LiTaO3 (LT) and LiNbO3 (LN) Crystal Sales (K Pcs), Revenue (US$, Mn) and Average Price (US$/Pcs) & (2019-2024)
Table 57. Eksma Optics Key News & Latest Developments
Table 58. Gooch & Housego Company Summary
Table 59. Gooch & Housego LiTaO3 (LT) and LiNbO3 (LN) Crystal Product Offerings
Table 60. Gooch & Housego LiTaO3 (LT) and LiNbO3 (LN) Crystal Sales (K Pcs), Revenue (US$, Mn) and Average Price (US$/Pcs) & (2019-2024)
Table 61. Gooch & Housego Key News & Latest Developments
Table 62. Inrad Optics Company Summary
Table 63. Inrad Optics LiTaO3 (LT) and LiNbO3 (LN) Crystal Product Offerings
Table 64. Inrad Optics LiTaO3 (LT) and LiNbO3 (LN) Crystal Sales (K Pcs), Revenue (US$, Mn) and Average Price (US$/Pcs) & (2019-2024)
Table 65. Inrad Optics Key News & Latest Developments
Table 66. Chengdu Dien Tech Company Summary
Table 67. Chengdu Dien Tech LiTaO3 (LT) and LiNbO3 (LN) Crystal Product Offerings
Table 68. Chengdu Dien Tech LiTaO3 (LT) and LiNbO3 (LN) Crystal Sales (K Pcs), Revenue (US$, Mn) and Average Price (US$/Pcs) & (2019-2024)
Table 69. Chengdu Dien Tech Key News & Latest Developments
Table 70. FUZHOU HUNDREDS OPTICS Company Summary
Table 71. FUZHOU HUNDREDS OPTICS LiTaO3 (LT) and LiNbO3 (LN) Crystal Product Offerings
Table 72. FUZHOU HUNDREDS OPTICS LiTaO3 (LT) and LiNbO3 (LN) Crystal Sales (K Pcs), Revenue (US$, Mn) and Average Price (US$/Pcs) & (2019-2024)
Table 73. FUZHOU HUNDREDS OPTICS Key News & Latest Developments
Table 74. TDG Holding Company Summary
Table 75. TDG Holding LiTaO3 (LT) and LiNbO3 (LN) Crystal Product Offerings
Table 76. TDG Holding LiTaO3 (LT) and LiNbO3 (LN) Crystal Sales (K Pcs), Revenue (US$, Mn) and Average Price (US$/Pcs) & (2019-2024)
Table 77. TDG Holding Key News & Latest Developments
Table 78. Shin-Etsu Chemical Company Summary
Table 79. Shin-Etsu Chemical LiTaO3 (LT) and LiNbO3 (LN) Crystal Product Offerings
Table 80. Shin-Etsu Chemical LiTaO3 (LT) and LiNbO3 (LN) Crystal Sales (K Pcs), Revenue (US$, Mn) and Average Price (US$/Pcs) & (2019-2024)
Table 81. Shin-Etsu Chemical Key News & Latest Developments
Table 82. Korth Kristalle Company Summary
Table 83. Korth Kristalle LiTaO3 (LT) and LiNbO3 (LN) Crystal Product Offerings
Table 84. Korth Kristalle LiTaO3 (LT) and LiNbO3 (LN) Crystal Sales (K Pcs), Revenue (US$, Mn) and Average Price (US$/Pcs) & (2019-2024)
Table 85. Korth Kristalle Key News & Latest Developments
Table 86. Jinan Caxin Company Summary
Table 87. Jinan Caxin LiTaO3 (LT) and LiNbO3 (LN) Crystal Product Offerings
Table 88. Jinan Caxin LiTaO3 (LT) and LiNbO3 (LN) Crystal Sales (K Pcs), Revenue (US$, Mn) and Average Price (US$/Pcs) & (2019-2024)
Table 89. Jinan Caxin Key News & Latest Developments
Table 90. LiTaO3 (LT) and LiNbO3 (LN) Crystal Capacity of Key Manufacturers in Global Market, 2022-2024 (K Pcs)
Table 91. Global LiTaO3 (LT) and LiNbO3 (LN) Crystal Capacity Market Share of Key Manufacturers, 2022-2024
Table 92. Global LiTaO3 (LT) and LiNbO3 (LN) Crystal Production by Region, 2019-2024 (K Pcs)
Table 93. Global LiTaO3 (LT) and LiNbO3 (LN) Crystal Production by Region, 2025-2030 (K Pcs)
Table 94. LiTaO3 (LT) and LiNbO3 (LN) Crystal Market Opportunities & Trends in Global Market
Table 95. LiTaO3 (LT) and LiNbO3 (LN) Crystal Market Drivers in Global Market
Table 96. LiTaO3 (LT) and LiNbO3 (LN) Crystal Market Restraints in Global Market
Table 97. LiTaO3 (LT) and LiNbO3 (LN) Crystal Raw Materials
Table 98. LiTaO3 (LT) and LiNbO3 (LN) Crystal Raw Materials Suppliers in Global Market
Table 99. Typical LiTaO3 (LT) and LiNbO3 (LN) Crystal Downstream
Table 100. LiTaO3 (LT) and LiNbO3 (LN) Crystal Downstream Clients in Global Market
Table 101. LiTaO3 (LT) and LiNbO3 (LN) Crystal Distributors and Sales Agents in Global Market
List of Figures
Figure 1. LiTaO3 (LT) and LiNbO3 (LN) Crystal Segment by Type in 2023
Figure 2. LiTaO3 (LT) and LiNbO3 (LN) Crystal Segment by Application in 2023
Figure 3. Global LiTaO3 (LT) and LiNbO3 (LN) Crystal Market Overview: 2023
Figure 4. Key Caveats
Figure 5. Global LiTaO3 (LT) and LiNbO3 (LN) Crystal Market Size: 2023 VS 2030 (US$, Mn)
Figure 6. Global LiTaO3 (LT) and LiNbO3 (LN) Crystal Revenue: 2019-2030 (US$, Mn)
Figure 7. LiTaO3 (LT) and LiNbO3 (LN) Crystal Sales in Global Market: 2019-2030 (K Pcs)
Figure 8. The Top 3 and 5 Players Market Share by LiTaO3 (LT) and LiNbO3 (LN) Crystal Revenue in 2023
Figure 9. Segment by Type Global LiTaO3 (LT) and LiNbO3 (LN) Crystal Revenue, (US$, Mn), 2023 & 2030
Figure 10. Segment by Type – Global LiTaO3 (LT) and LiNbO3 (LN) Crystal Revenue Market Share, 2019-2030
Figure 11. Segment by Type – Global LiTaO3 (LT) and LiNbO3 (LN) Crystal Sales Market Share, 2019-2030
Figure 12. Segment by Type – Global LiTaO3 (LT) and LiNbO3 (LN) Crystal Price (US$/Pcs), 2019-2030
Figure 13. Segment by Application Global LiTaO3 (LT) and LiNbO3 (LN) Crystal Revenue, (US$, Mn), 2023 & 2030
Figure 14. Segment by Application – Global LiTaO3 (LT) and LiNbO3 (LN) Crystal Revenue Market Share, 2019-2030
Figure 15. Segment by Application – Global LiTaO3 (LT) and LiNbO3 (LN) Crystal Sales Market Share, 2019-2030
Figure 16. Segment by Application -Global LiTaO3 (LT) and LiNbO3 (LN) Crystal Price (US$/Pcs), 2019-2030
Figure 17. By Region Global LiTaO3 (LT) and LiNbO3 (LN) Crystal Revenue, (US$, Mn), 2023 & 2030
Figure 18. By Region – Global LiTaO3 (LT) and LiNbO3 (LN) Crystal Revenue Market Share, 2019 VS 2023 VS 2030
Figure 19. By Region – Global LiTaO3 (LT) and LiNbO3 (LN) Crystal Revenue Market Share, 2019-2030
Figure 20. By Region – Global LiTaO3 (LT) and LiNbO3 (LN) Crystal Sales Market Share, 2019-2030
Figure 21. By Country – North America LiTaO3 (LT) and LiNbO3 (LN) Crystal Revenue Market Share, 2019-2030
Figure 22. By Country – North America LiTaO3 (LT) and LiNbO3 (LN) Crystal Sales Market Share, 2019-2030
Figure 23. United States LiTaO3 (LT) and LiNbO3 (LN) Crystal Revenue, (US$, Mn), 2019-2030
Figure 24. Canada LiTaO3 (LT) and LiNbO3 (LN) Crystal Revenue, (US$, Mn), 2019-2030
Figure 25. Mexico LiTaO3 (LT) and LiNbO3 (LN) Crystal Revenue, (US$, Mn), 2019-2030
Figure 26. By Country – Europe LiTaO3 (LT) and LiNbO3 (LN) Crystal Revenue Market Share, 2019-2030
Figure 27. By Country – Europe LiTaO3 (LT) and LiNbO3 (LN) Crystal Sales Market Share, 2019-2030
Figure 28. Germany LiTaO3 (LT) and LiNbO3 (LN) Crystal Revenue, (US$, Mn), 2019-2030
Figure 29. France LiTaO3 (LT) and LiNbO3 (LN) Crystal Revenue, (US$, Mn), 2019-2030
Figure 30. U.K. LiTaO3 (LT) and LiNbO3 (LN) Crystal Revenue, (US$, Mn), 2019-2030
Figure 31. Italy LiTaO3 (LT) and LiNbO3 (LN) Crystal Revenue, (US$, Mn), 2019-2030
Figure 32. Russia LiTaO3 (LT) and LiNbO3 (LN) Crystal Revenue, (US$, Mn), 2019-2030
Figure 33. Nordic Countries LiTaO3 (LT) and LiNbO3 (LN) Crystal Revenue, (US$, Mn), 2019-2030
Figure 34. Benelux LiTaO3 (LT) and LiNbO3 (LN) Crystal Revenue, (US$, Mn), 2019-2030
Figure 35. By Region – Asia LiTaO3 (LT) and LiNbO3 (LN) Crystal Revenue Market Share, 2019-2030
Figure 36. By Region – Asia LiTaO3 (LT) and LiNbO3 (LN) Crystal Sales Market Share, 2019-2030
Figure 37. China LiTaO3 (LT) and LiNbO3 (LN) Crystal Revenue, (US$, Mn), 2019-2030
Figure 38. Japan LiTaO3 (LT) and LiNbO3 (LN) Crystal Revenue, (US$, Mn), 2019-2030
Figure 39. South Korea LiTaO3 (LT) and LiNbO3 (LN) Crystal Revenue, (US$, Mn), 2019-2030
Figure 40. Southeast Asia LiTaO3 (LT) and LiNbO3 (LN) Crystal Revenue, (US$, Mn), 2019-2030
Figure 41. India LiTaO3 (LT) and LiNbO3 (LN) Crystal Revenue, (US$, Mn), 2019-2030
Figure 42. By Country – South America LiTaO3 (LT) and LiNbO3 (LN) Crystal Revenue Market Share, 2019-2030
Figure 43. By Country – South America LiTaO3 (LT) and LiNbO3 (LN) Crystal Sales, Market Share, 2019-2030
Figure 44. Brazil LiTaO3 (LT) and LiNbO3 (LN) Crystal Revenue, (US$, Mn), 2019-2030
Figure 45. Argentina LiTaO3 (LT) and LiNbO3 (LN) Crystal Revenue, (US$, Mn), 2019-2030
Figure 46. By Country – Middle East & Africa LiTaO3 (LT) and LiNbO3 (LN) Crystal Revenue, Market Share, 2019-2030
Figure 47. By Country – Middle East & Africa LiTaO3 (LT) and LiNbO3 (LN) Crystal Sales, Market Share, 2019-2030
Figure 48. Turkey LiTaO3 (LT) and LiNbO3 (LN) Crystal Revenue, (US$, Mn), 2019-2030
Figure 49. Israel LiTaO3 (LT) and LiNbO3 (LN) Crystal Revenue, (US$, Mn), 2019-2030
Figure 50. Saudi Arabia LiTaO3 (LT) and LiNbO3 (LN) Crystal Revenue, (US$, Mn), 2019-2030
Figure 51. UAE LiTaO3 (LT) and LiNbO3 (LN) Crystal Revenue, (US$, Mn), 2019-2030
Figure 52. Global LiTaO3 (LT) and LiNbO3 (LN) Crystal Production Capacity (K Pcs), 2019-2030
Figure 53. The Percentage of Production LiTaO3 (LT) and LiNbO3 (LN) Crystal by Region, 2023 VS 2030
Figure 54. LiTaO3 (LT) and LiNbO3 (LN) Crystal Industry Value Chain
Figure 55. Marketing Channels