Lighting Systems Used Occupancy Sensors Market, Size, Trends, Business Strategies 2026-2036

Lighting systems used occupancy sensors market is projected to reach USD 2 871 million by 2034, exhibiting a CAGR of 11.0% during the forecast period.

PDF Icon Download Sample Report PDF
  • Quick Dispatch

    All Orders

  • Secure Payment

    100% Secure Payment

Price range: $1,500.00 through $4,250.00

Clear

Lighting Systems Used Occupancy Sensors Market Insights

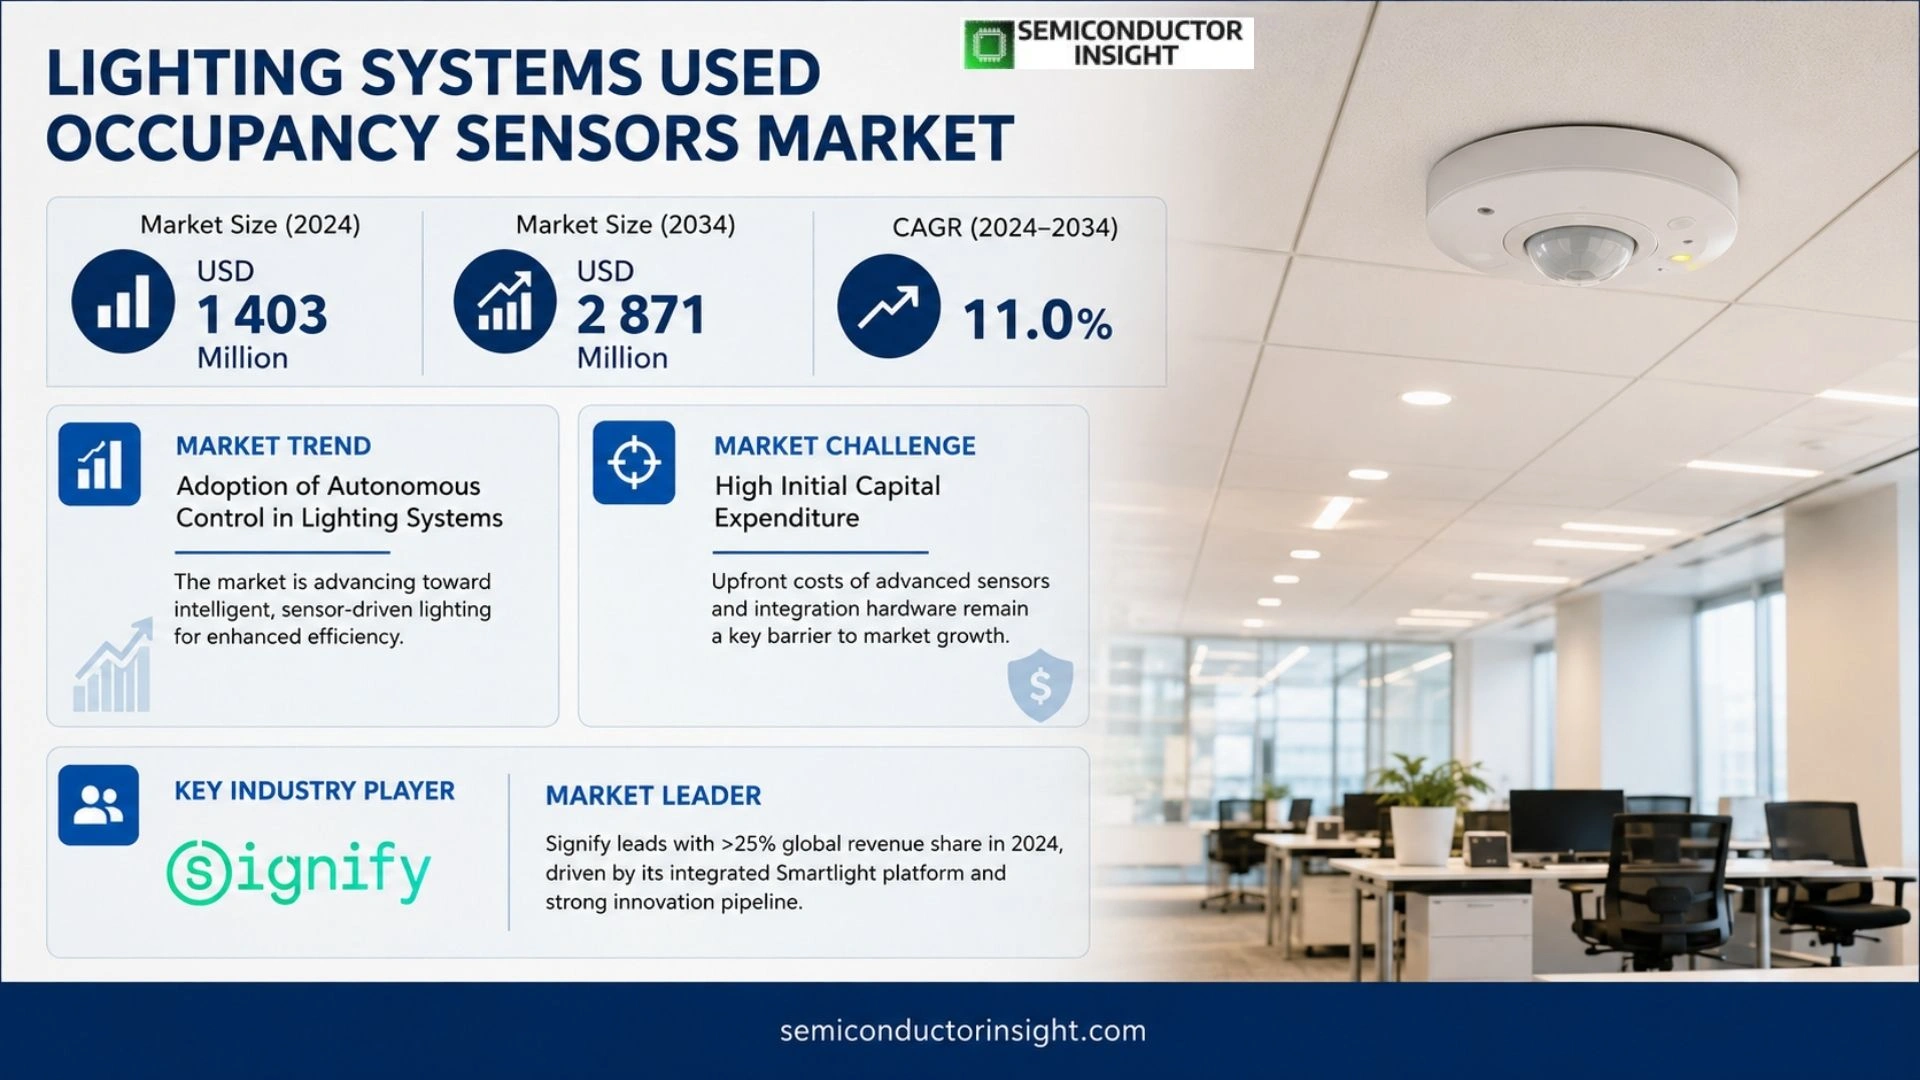
Lighting systems used occupancy sensors market was valued at USD 1 403 million in 2024 and is projected to reach USD 2 871 million by 2034, exhibiting a CAGR of 11.0% during the forecast period.

Occupancy sensors are electronic devices engineered to detect human presence within a defined zone, enabling automated control of lighting and HVAC systems for energy efficiency. By automatically adjusting illumination levels when occupants leave a room, these devices reduce electricity consumption considerably. While initial installation costs may deter some buyers, long‑term savings often outweigh upfront expenses.
Lighting Systems Used Occupancy Sensors Market Trends 2026

MARKET DRIVERS

Technological Advancements Driving Adoption

The surge in Lighting systems used occupancy sensors Market is propelled primarily by the convergence of software intelligence and sensor miniaturization. Over the last 18–24 months, the deployment of low‑power, RF‑based occupancy units that combine motion detection with light‑intensity monitoring has reduced power draw by up to 35% compared with legacy infrared solutions, making retrofits financially attractive even in dense office clusters. Furthermore, the widespread adoption of Internet‑of‑Things (IoT) platforms that allow real‑time analytics has enabled facilities managers to adjust lighting schedules dynamically, trimming electricity usage by an estimated 22% in mid‑size enterprises. This technology wave also fuels a cascade of ancillary product development; smart bulbs now integrate occupancy data feeds to adjust color temperature, boosting occupant comfort while maintaining energy efficiency. As building certification schemes evolve,with the International Energy Agency (IEA) and UK Building Regulations placing 10‑15% energy savings amongst mandatory metrics,market participants prioritize lighting controls that can demonstrate compliance, accelerating pipeline speed for new fixtures.

Regulatory Support and Building Standards

Governments worldwide are tightening lighting regulations that demand predictive usage based on occupancy. In the United States, the Energy Independence and Security Act (EISA) of 2022 now mandates that all federally funded commercial buildings retrofit lighting systems with occupancy controls by 2026, creating a mandatory supply chain pressure. Parallel initiatives in Europe,particularly within the EU’s Renewable Energy Directive II,outline a 15% consumption ceiling for public buildings, incentivising occupancy‑based lighting to align with policy goals. The surge in these policies exerts a double‑whammy; first, it obliges developers to integrate occupancy sensors during construction, and second, it drives end‑users to retrofit legacy installations for tax credit eligibility. Consequently, several OEMs report a 30% increase in domestic sales of occupancy‑enabled luminaires within the past two fiscal years.

➤ Building owners are increasingly considering occupancy sensors as a high‑visibility asset for ESG reporting, especially as investor sentiment shifts toward sustainable operational footprints.

The proliferation of remote‑first workforces and flexible co‑working hubs has also shifted occupancy patterns, generating unpredictable lighting loads that cannot be efficiently managed through simple time‑based scheduling. Demand‑responsive lighting driven by occupancy data offers a solution that scales across office, retail, and hospitality sectors, returning robust cost savings while improving occupant satisfaction. As green building portfolios grow, the slice of the total lighting cycle captured by occupancy systems is expected to rise, further reinforcing the case for timely investment.

MARKET CHALLENGES

High Initial Capital Expenditure

One of the most stringent barriers impeding rapid scaling of Lighting systems used occupancy sensors Market remains the upfront cost associated with advanced sensors and integration hardware. Although sensor units themselves have seen a 15% price drop, the cumulative expense,comprising installation labor, power layout modifications, and IoT gateway integration,still commands a premium for early adopters. Buildings retrofitted with traditional lighting fixtures lose a key advantage of modular retrofit: minimal disruption. In contrast, occupancy‑enabled luminaires often require rewiring or commissioning of new control hubs, thereby eroding the economic appeal for millimeter‑grade deployments in older properties. This cost differential is magnified for owners with short asset cycles, where the payback period must align with asset life expectancy.

Complex Integration with Legacy Systems

Obtaining seamless interaction between new occupancy sensors and legacy lighting control networks presents persistent technical headaches. Legacy BACnet or DMX systems, widespread in buildings constructed before the 2000s, often lack digital communication capabilities, necessitating gateway adapters that themselves complicate the installation matrix. Compatibility issues can lead to increased commissioning times,on average 18% higher than new constructions,introducing delays, additional labor, and possible downtime during transition phases. Moreover, these adapters frequently become single points of failure, reducing overall system reliability and increasing long‑term maintenance costs.

Insufficient Standardization Across Market Segments

While the draft of the ANSI C84.1 lighting standard is moving toward unified control interfaces, no comprehensive, industry‑wide standard yet governs occupancy‑sensor integration, resulting in fragmented product ecosystems. Manufacturers implement proprietary protocols that sometimes clash, forming interoperability silos that hinder multi‑vendor environments common in large office campuses. As a result, buyers are forced to adopt single‑vendor “black‑box” solutions, curbing competitive pricing mechanisms and limiting technology diffusion across sectors.

Other Challenges

Limited Advanced Analytics Adoption in Mid‑Size Enterprises

Even when occupancy sensors are installed, a significant proportion of mid‑size enterprises,those with 50–200 employees,fail to leverage advanced analytics provided by proprietary lighting platforms. This phenomenon arises from a knowledge gap and limited IT budgets, rendering occupancy data underutilized and offering minimal ROI insulation from the initial purchase. Consequently, the pace of value capture is sub‑optimal, stalling broader market acceptance.

MARKET RESTRAINTS

Electrical Infrastructure Constraints

In contemporary high‑density settings such as corporate campuses, the electrical infrastructure may lack the capacity to support additional occupancy‑enabled lighting systems. The requirement for dedicated circuits to accommodate centralized control units frequently conflicts with existing cable loads, leading to costly rewiring or the deployment of external power modules. The associated overtime costs and scheduling coordination challenges create a prohibitive barrier, especially in older structures where structural retrofits are limited by building codes and historical preservation mandates.

Concerns Over Data Security and Privacy

Occupancy sensors routinely collate large volumes of occupant presence data, increasingly bringing privacy concerns to the forefront of compliance frameworks such as GDPR and CCPA. The potential for misuse,be it analytics for workforce monitoring or unauthorized third‑party data sharing,can affect the adoption trajectory. Consequently, many enterprises adopt conservative data-handling policies that limit sensor usage or choose analog solutions despite higher energy draw, thereby restraining market penetration.

MARKET OPPORTUNITIES

Growth in Smart Building Initiatives

The ascendance of Industry 4.0 frameworks in real estate management creates fertile ground for occupancy‑powered lighting expansions. Building Analytics platforms,now available as SaaS,from vendors like Autodesk and Siemens begin to expose larger datasets to system integrators, allowing them to pair lighting controls with HVAC, occupancy analytics, and even workforce mobility patterns. Integrators can leverage this synergetic value chain to suggest hybrid retrofits that capitalize on demand‑response capabilities across multiple tenant spaces, opening revenue avenues while delivering differentiated service portfolios to anchor tenants.

Urban Density Projects and Co‑Working Spaces

Urban centers, targeting higher rooftop and floor‑plan utilization, increasingly deploy shared working pods where lighting is adjusted based on real‑time occupancy. In locations like Singapore, Shenzhen, and Toronto, dedicated space‑sharing platforms tie occupancy data with subscription billing models, enabling space providers to monetize sensor‑enabled lighting as part of differentiated membership tiers. This model not only reinforces lease stability but also scales occupancy‑driven lighting adoption with minimal incremental hardware costs, thereby offering a strong growth vector for component suppliers and system vendors alike.

Advanced Energy‑Saving Programs in Commercial Real Estate

Many institutional investors and real‑estate SMAs (Speciality Mortgage Associates) have ventured into energy‑bidding schemes that reward buildings for demonstrable reductions in consumption. Occupancy‑enabled lighting systems provide measurable metrics that can directly satisfy these contractual obligations. Exposure to institutional real‑estate portfolios,often representing 20–30% of the total market,thereby becomes a pivotal catalyst for sensor adoption, particularly in commercial office towers bundled into ESG driven financing structures. Companies aligning with these programs early stand to secure bulk procurement contracts and long‑term service agreements, driving consistent revenue flows during the next 10‑year lifecycle.

Lighting Systems Used Occupancy Sensors Market Trends

Adoption of Autonomous Control in Lighting Systems

In the United States, the baseline for Lighting Systems Used Occupancy Sensors Market was 1403 million in 2024. By 2031, the value is slated to climb to roughly 2871 million, corresponding to a compounded expansion of more than ten percent annually. The underlying catalyst is the increasing prevalence of building energy efficiency directives, many of which prescribe sensor‑enabled lighting as a means to cut consumption in commercial and high‑rise districts. Because the cost of installing sensors is offset by measurable utility reductions,in some metro areas more than 15% of monthly energy,is a compelling argument for facility managers. The trend becomes even more pronounced in regions where green building accords mandate full illumination control, as the sensor’s ability to turn lights off in unoccupied zones directly satisfies compliance quota. Consequently, the market is evolving beyond single‑zone fixtures to multi‑sensor networks integrated across a building’s schematics, prompting vendors to develop hybrid PIR‑ultrasonic modules that offer higher detection accuracy while reducing false positives that have historically limited deployment.

Other Trends

Integration with Building Management Systems

While the core market remains largely driven by standalone sensor installation, the convergence of lighting and HVAC controls marks a breakout opportunity. Legacy supervisory platforms often lack real‑time data feeds from occupancy modules, causing marginal inefficiencies. Vendors are therefore introducing API‑ready firmware, allowing seamless communication between the sensor and advanced energy‑management software. This interoperability translates into two principal benefits: centralized monitoring dashboards that reduce manual adjustments, and predictive maintenance that flags actuating circuits before they fail. The adoption curve is however tempered by the necessity of compatible interface modules; many older chillers and HVAC control units require retrofit, adding to upfront capital. Nonetheless, the return on investment tightens over a five‑year horizon, aligning with the typical lifecycle of commercial lighting arrays. Auditing climate‑controlled spaces further benefits from the dual‑functionality of occupancy‑enabled refrigerators and telescopic temperature‑sensing loops that keep HVAC overhead in check.

Competition and Fragmentation in the Sensor Segment

The competitive landscape is sharply segmented among a handful of leaders,Signify, Schneider Electric, Honeywell, and GE Current,yet smaller specialists such as Legrand and Z-Wave maintain niche footholds in retrofit markets. Product differentiation pivots on factor ratings like response time and coverage angle; dual‑technology solutions that combine infrared and sound detection claim up to 30% lower false‑alarm rates compared to single‑sensor approaches. Retailers observe a differential between large turnkey projects, where bundle pricing yields tighter margins, and ad‑hoc installations by independent contractors, where unit cost sensitivity is higher. This bifurcation means vendors must balance volume pricing with premium service tiers, an approach mirrored in the pricing of evolutionary firmware releases that lock advanced analytics into a subscription model. As a result, strategic alliances with building‑automation platforms are emerging, enabling a more integrated ecosystem that should level the playing field between established and emergent players while maintaining a clear profit emphasis on long‑term system performance and reliability.

COMPETITIVE LANDSCAPE

Key Industry Players

Lighting Systems Used Occupancy Sensors Market Core Dynamics

Signify, the market’s chartered leader, commands over 25% of global revenue in 2024, a share that has expanded steadily since the adoption of its integrated Smartlight platform. The company’s strategy to bundle occupancy sensing with advanced IoT dashboards sets a high bar for interoperability and data‑driven decision making. Schneider Electric, closely behind, leverages its EcoStruxure architecture to embed occupancy logic into broader building management suites, capturing approximately 18% of the market. Together, these two players steer a market that has become increasingly segmented by verticals such as commercial office, hospitality and healthcare, each demanding tightly coupled sensor‑lighting networks that meet stringent energy‑efficiency regulations. Their ability to secure large contracts across North America and Europe has also channeled significant R&D investment into next‑generation dual‑technology sensors, which now serve as the preferred solution for utilities and sustainability‑focused enterprises. Their dominance also forces smaller entrants to pursue alliances and price‑sensitive solutions, curbing market fragmentation yet leaving room for incremental technological breakthroughs.

On the periphery, companies such as Honeywell, Lutron, and Acuity Brands differentiate themselves by focusing on niche segments where legacy infrastructure still dominates. Honeywell’s building‑control modules integrate occupancy modules into HVAC‑centric ecosystems, delivering value‑add on retrofit projects that upset conventional procurement cycles. Lutron harnesses its long‑standing expertise in dimming technologies to offer sensor‑controlled lighting trimmers that appeal to retrofit designers and automation installers. Acuity Brands, with its extensive reseller network, targets the residential and low‑profile commercial markets, providing cost‑effective PIR modules that can be installed with minimal disruption. Smaller specialists like Enerlites and Hubbell bring customized sensor layouts for industrial and educational campuses, while ATSS offers versatile sensor housings that address harsh‑environment applications. Collectively, these players sustain a competitive landscape that rewards specialization, regional adaptability and pricing flexibility. The resulting mosaic of capabilities encourages OEMs to forge strategic alliances and offers buyers a broader array of choices tailored to their specific functional and budgetary constraints.

List of Key Lighting Systems Used Occupancy Sensors Companies Profiled

Segment Analysis:

Segment Category Sub-Segments Key Insights
By Type
  • PIR Sensors
  • Ultrasonic Sensors
  • Dual-technology Sensors
  • Others
PIR Sensors offer reliable infrared detection with low power consumption, making them the preferred choice for energy‑aware lighting systems. • Their rapid response time delivers instant lighting adjustments in dynamic spaces. • Seamless integration with building automation adds value for system integrators. • Coverage across both large lobbies and small offices ensures versatility across market segments.
By Application
  • Residential
  • Commercial
  • Industrial
  • Others
Commercial environments such as offices and retail are key drivers, as occupancy sensors reduce energy consumption while enhancing occupant comfort. • Sensor placement in high‑traffic corridors provides consistent lighting dynamics. • Integration with HVAC control systems offers consolidated energy management. • Subsidies and incentive programs in urban centers further accelerate deployment.
By End User
  • Office Buildings
  • Retail Stores
  • Hospitals
Hospital Facilities drive adoption due to stringent energy efficiency mandates and the need for continuous patient monitoring. • Occupancy data supports dynamic lighting age reduction in patient rooms. • Sensors enable flexible workflow adaptation for medical staff. • Integration with health‑information systems creates a comprehensive environment management platform.
By Building Type
  • Multi‑storey Buildings
  • Low‑rise Buildings
  • High‑rise Buildings
Multi‑storey Buildings present complex occupancy patterns, making advanced sensor algorithms essential. • Deployment of zoned sensor networks optimizes energy use across floors. • Predictive occupancy analytics support proactive lighting adjustments. • The scale of deployment drives demand for standardized, cost‑effective solutions.
By Sensor Sensitivity
  • Low Sensitivity
  • Medium Sensitivity
  • High Sensitivity
High Sensitivity sensors excel in environments with sparse occupancy, such as open‑plan offices, where subtle presence detection can prevent unnecessary lighting. • They provide granular data for occupant analytics. • Sensor calibration is critical to avoid false triggers. • The capability to handle motion after prolonged inactivity differentiates high‑end products.

Regional Analysis: Lighting Systems Used Occupancy Sensors Market

North America

The North American subsection of Lighting systems used occupancy sensors Market stands as a bellwether for technological adoption. Its propensity for early integration of sensor‑enabled fixtures with building automation frameworks has established a circuitry of demand that is difficult to replicate elsewhere. The intersection of stringent energy standards, such as ENERGY STAR® penalties and the federal commitment to green signage, catalyzes a cascade of solutions that blend sensing capabilities with smart grid compatibility. Here, the synergy between manufacturers and large‑scale operators is manifested through joint pilot programs that showcase service‑level agreements, proving the case for ROI in both commercial and institutional settings. Market leaders harness a “plug‑and‑play” architecture, enabling latency‑free data flows across lighting, HVAC, and security layers. While some peripheral logging features are still maturing, the prevailing trend is toward unified dashboards that translate occupancy analytics into real‑time illumination and energy savings. The academic output also underscores a strategic pivot: integration with artificial‑intelligence‑driven optimization, where demand‑response logic adapts to occupant patterns with predictive fidelity. This has prompted a flurry of talent recruitment in both sensor hardware and software monetization, further entrenching North America’s position as the frontline for intelligent lighting ecosystems. From an investment lens, the region remains a magnet for venture capital due to its robust ecosystem of start‑ups incubating novel sensing modalities such as radar‑based detection and near‑infrared illumination. The widespread availability of data‑science talent ensures that large corporates can iterate rapidly on profitability models, thereby reaffirming a virtuous cycle of continuous product improvement. The densification of retail clusters and the evolution of e‑commerce fulfilment centres also create use‑case pressure that accelerates sensor deployment in indoor environments. With such a confluence of regulatory incentives, tech ecosystems, and commercial appetite, North America’s leadership is likely to persist deep into the forecast horizon and beyond.

Adoption Drivers
Demand from commercial real‑estate developers for compliant, carbon‑neutral portfolios pushes sensor‑based lighting to the fore. This is amplified by data‑silo collapse, whereby occupancy data pairs with floor‑plan analytics to optimise internal space usage.
Technology Innovation
High‑resolution imaging and machine‑learning inference open new avenues for granular occupant detection, allowing lighting controls to adapt on a minute‑by‑minute basis.
Regulatory Landscape
The ENERGY STAR® framework and ISO 50001 certification convergently raise baseline requirements, encouraging the roll‑out of sensor‑enabled fixtures in new builds and retrofits.
Investment Outlook
Asset‑management firms are allocating capital towards predictive maintenance models that use occupancy data to pre‑empt failure, thus reducing downtime and maintenance costs.

Europe
Within Europe, inertia in built‑environment innovation is tempered by a mosaic of regional policies aimed at de‑carbonising urban cores. The European Union’s Energy‑Efficiency Directive, coupled with the Smart Grids Initiative, has instilled a market pressure that favours occupancy‑sensing lighting as a gateway to reduced electrical consumption. Public‑sector projects, such as the European Green Deal‑aligned refurbishments of municipal offices, demonstrate a preference for sensors that can log presence data for both safety and audit compliance. Regional fragmentation, however, introduces variations in adoption rates: Northern European countries with advanced digital infrastructures see earlier uptake, while Southern regions lag, constrained by slower regulatory harmonisation. Nonetheless, the long‑term outlook hinges on cross‑border standardisation of sensor communication protocols, ensuring seamless integration with European micro‑grids and smart‑city platforms. This alignment is poised to elevate occupancy‑enabled lighting from a niche segmentation to a core commodity, especially in high‑density office districts.

Asia‑Pacific
Asia‑Pacific presents a dual‑driven market where rapid urbanisation and population density fuel the demand for intelligent lighting frameworks. In Japan and South Korea, stringent energy–saving mandates, alongside a cultural emphasis on efficient in‑office lighting, accelerate the adoption of occupancy sensors that provide granular control over ambient conditions. Emerging economies such as China and India, on the other hand, are finding success through scalable sensor‑infrastructure projects in commercial malls and logistics centres, where occupancy data informs dynamic lighting schedules that reduce wastage. Additionally, the proliferation of 5G networks and data‑edge computing solutions in the region affords real‑time analytics, allowing for predictive illumination adjustments that align with workforce patterns. While cost sensitivity remains a barrier in some market segments, rising disposable income and the pursuit of green branding are shifting the cost‑benefit calculus, making occupancy‑based lighting increasingly attractive for both private and public sectors. The convergence of local standards with international best practices will likely drive consistent growth across the region in the intermediate term.

South America
South America’s lighting sensor market is characterised by nascent infrastructure but a clear strategic pivot toward energy efficiency, especially under national sustainability programmes. Brazil’s “Energia Verde” initiative, supported by federal tax incentives, promotes the installation of sensor‑enabled lighting in new commercial assets. Chile’s mining and forestry operations, which operate under stringent energy consumption caps, are exploring occupancy–based controls to reduce the electrical footprint of large‑scale facilities. The challenge, nonetheless, lies in the fragmented supply chain and variable regulatory enforcement across countries, creating market entry obstacles for foreign suppliers. Local manufacturers, responding to these constraints, are tailored to integrate low‑cost, easy‑to‑install sensing modules that can be retrofitted into existing fixtures, often with minimal downtime. This pragmatic approach unlocks adoption in smaller enterprises and government buildings, thereby expanding the market bandwidth. The cumulative effect will position South America as a gradually consolidating hub for intelligent lighting practices in the coming decades.

Middle East & Africa
In the Middle East, rapid infrastructural development, coupled with aggressive commitments to renewable integration, fuels a robust demand for occupancy‑sensing lighting solutions. Projects such as the Dubai Smart City Initiative explicitly tie intelligent lighting to building automation, driving a market that prizes seamless interoperability and remote monitoring capabilities. The region’s penchant for luxury has also fostered early experimentation with ambient‑adjusting fixtures that combine presence detection with aesthetic lighting effects. Moving to Africa, the growth narrative is more uneven; urban centres in South Africa and Egypt are initiating pilot projects that target high‑profile public institutions and mixed‑use developments. Yet, widespread adoption faces hurdles such as limited grid stability and non‑uniform regulatory frameworks. Nonetheless, the increasing focus on energy resilience, supported by international donor funding, creates a deterministic pathway for occupancy sensor integration across critical infrastructure. By the early 2030s, the cumulative effect of these regional programmes is expected to transition the market from a corridor of experimental deployments to a standardized, demand‑driven ecosystem.

Report Scope

This market research report provides a comprehensive analysis of the Lighting Systems Used Occupancy Sensors Market , covering the forecast period 2026–2034. It offers detailed insights into market dynamics, technological advancements, competitive landscape, and key trends shaping the industry.

Key focus areas of the report include:

  • Market Overview: The report begins with an overview outlining its current market scenario, key growth indicators, and industry transformation drivers. It discusses macroeconomic factors, demand–supply balance, regulatory landscape, and the strategic role of semiconductors in powering advancements across industries such as automotive, telecommunications, consumer electronics, and industrial automation.
  • Market Size & Forecast: Historical data and future projections for revenue, unit shipments, and market value across major regions and segments.
  • Segmentation Analysis: Detailed breakdown by product type, technology, application, and end-user industry to identify high-growth segments and investment opportunities.
  • Regional Insights: Insights into market performance across North America, Europe, Asia-Pacific, Latin America, and the Middle East & Africa, including country-level analysis where relevant.
  • Competitive Landscape: Profiles of leading market participants, including their product offerings, R&D focus, manufacturing capacity, pricing strategies, and recent developments such as mergers, acquisitions, and partnerships.
  • Technology Trends & Innovation: Assessment of emerging technologies, integration of AI/IoT, semiconductor design trends, fabrication techniques, and evolving industry standards.
  • Market Drivers & Restraints: Evaluation of factors driving market growth along with challenges, supply chain constraints, regulatory issues, and market-entry barriers.
  • Stakeholder Insights: Insights for component suppliers, OEMs, system integrators, investors, and policymakers regarding the evolving ecosystem and strategic opportunities.

Primary and secondary research methods are employed, including interviews with industry experts, data from verified sources, and real-time market intelligence to ensure the accuracy and reliability of the insights presented.

FREQUENTLY ASKED QUESTIONS:

What is the current market size of Lighting Systems Used Occupancy Sensors Market?

-> Lighting systems used occupancy sensors market is projected to reach USD 2 871 million by 2034, exhibiting a CAGR of 11.0% during the forecast period.

Which key companies operate in Lighting Systems Used Occupancy Sensors Market?

-> Key players include Signify, Schneider Electric, Honeywell, GE Current, Johnson Controls, Legrand, Crestron Electronics, Lutron Electronics, Acuity Brands, OPTEX, Leviton Manufacturing Co., Inc, Enerlites, Hubbell, and ATSS.

What are the key growth drivers?

-> Key growth drivers include energy efficiency regulations and standards that drive demand for automatic lighting and HVAC control, cost savings from reduced energy consumption, and increasing integration of occupancy sensors with building management systems.

Which region dominates the market?

-> North America remains a leading region due to widespread adoption of energy‑efficient building technologies and strong government incentives for smart building solutions.

What are the emerging trends?

-> Emerging trends include integration of AI and IoT for predictive maintenance, advanced dual‑technology occupancy sensors, and enhanced compatibility with existing building management systems to reduce upfront investment barriers.

Lighting Systems Used Occupancy Sensors Market, Size, Trends, Business Strategies 2026-2036

Get Sample Report PDF for Exclusive Insights

Report Sample Includes

  • Table of Contents
  • List of Tables & Figures
  • Charts, Research Methodology, and more...

PDF Icon Download Sample Report PDF

Download Sample Report

Table of Content

Table of Contents
1 Research Methodology and Statistical Scope
1.1 Market Definition and Statistical Scope of Lighting Systems Used Occupancy Sensors
1.2 Key Market Segments
1.2.1 Lighting Systems Used Occupancy Sensors Segment by Type
1.2.2 Lighting Systems Used Occupancy Sensors Segment by Application
1.3 Methodology & Sources of Information
1.3.1 Research Methodology
1.3.2 Research Process
1.3.3 Market Breakdown and Data Triangulation
1.3.4 Base Year
1.3.5 Report Assumptions & Caveats
2 Lighting Systems Used Occupancy Sensors Market Overview
2.1 Global Market Overview
2.1.1 Global Lighting Systems Used Occupancy Sensors Market Size (M USD) Estimates and Forecasts (2019-2030)
2.1.2 Global Lighting Systems Used Occupancy Sensors Sales Estimates and Forecasts (2019-2030)
2.2 Market Segment Executive Summary
2.3 Global Market Size by Region
3 Lighting Systems Used Occupancy Sensors Market Competitive Landscape
3.1 Global Lighting Systems Used Occupancy Sensors Sales by Manufacturers (2019-2025)
3.2 Global Lighting Systems Used Occupancy Sensors Revenue Market Share by Manufacturers (2019-2025)
3.3 Lighting Systems Used Occupancy Sensors Market Share by Company Type (Tier 1, Tier 2, and Tier 3)
3.4 Global Lighting Systems Used Occupancy Sensors Average Price by Manufacturers (2019-2025)
3.5 Manufacturers Lighting Systems Used Occupancy Sensors Sales Sites, Area Served, Product Type
3.6 Lighting Systems Used Occupancy Sensors Market Competitive Situation and Trends
3.6.1 Lighting Systems Used Occupancy Sensors Market Concentration Rate
3.6.2 Global 5 and 10 Largest Lighting Systems Used Occupancy Sensors Players Market Share by Revenue
3.6.3 Mergers & Acquisitions, Expansion
4 Lighting Systems Used Occupancy Sensors Industry Chain Analysis
4.1 Lighting Systems Used Occupancy Sensors Industry Chain Analysis
4.2 Market Overview of Key Raw Materials
4.3 Midstream Market Analysis
4.4 Downstream Customer Analysis
5 The Development and Dynamics of Lighting Systems Used Occupancy Sensors Market
5.1 Key Development Trends
5.2 Driving Factors
5.3 Market Challenges
5.4 Market Restraints
5.5 Industry News
5.5.1 New Product Developments
5.5.2 Mergers & Acquisitions
5.5.3 Expansions
5.5.4 Collaboration/Supply Contracts
5.6 Industry Policies
6 Lighting Systems Used Occupancy Sensors Market Segmentation by Type
6.1 Evaluation Matrix of Segment Market Development Potential (Type)
6.2 Global Lighting Systems Used Occupancy Sensors Sales Market Share by Type (2019-2025)
6.3 Global Lighting Systems Used Occupancy Sensors Market Size Market Share by Type (2019-2025)
6.4 Global Lighting Systems Used Occupancy Sensors Price by Type (2019-2025)
7 Lighting Systems Used Occupancy Sensors Market Segmentation by Application
7.1 Evaluation Matrix of Segment Market Development Potential (Application)
7.2 Global Lighting Systems Used Occupancy Sensors Market Sales by Application (2019-2025)
7.3 Global Lighting Systems Used Occupancy Sensors Market Size (M USD) by Application (2019-2025)
7.4 Global Lighting Systems Used Occupancy Sensors Sales Growth Rate by Application (2019-2025)
8 Lighting Systems Used Occupancy Sensors Market Segmentation by Region
8.1 Global Lighting Systems Used Occupancy Sensors Sales by Region
8.1.1 Global Lighting Systems Used Occupancy Sensors Sales by Region
8.1.2 Global Lighting Systems Used Occupancy Sensors Sales Market Share by Region
8.2 North America
8.2.1 North America Lighting Systems Used Occupancy Sensors Sales by Country
8.2.2 U.S.
8.2.3 Canada
8.2.4 Mexico
8.3 Europe
8.3.1 Europe Lighting Systems Used Occupancy Sensors Sales by Country
8.3.2 Germany
8.3.3 France
8.3.4 U.K.
8.3.5 Italy
8.3.6 Russia
8.4 Asia Pacific
8.4.1 Asia Pacific Lighting Systems Used Occupancy Sensors Sales by Region
8.4.2 China
8.4.3 Japan
8.4.4 South Korea
8.4.5 India
8.4.6 Southeast Asia
8.5 South America
8.5.1 South America Lighting Systems Used Occupancy Sensors Sales by Country
8.5.2 Brazil
8.5.3 Argentina
8.5.4 Columbia
8.6 Middle East and Africa
8.6.1 Middle East and Africa Lighting Systems Used Occupancy Sensors Sales by Region
8.6.2 Saudi Arabia
8.6.3 UAE
8.6.4 Egypt
8.6.5 Nigeria
8.6.6 South Africa
9 Key Companies Profile
9.1 Signify
9.1.1 Signify Lighting Systems Used Occupancy Sensors Basic Information
9.1.2 Signify Lighting Systems Used Occupancy Sensors Product Overview
9.1.3 Signify Lighting Systems Used Occupancy Sensors Product Market Performance
9.1.4 Signify Business Overview
9.1.5 Signify Lighting Systems Used Occupancy Sensors SWOT Analysis
9.1.6 Signify Recent Developments
9.2 Schneider Electric
9.2.1 Schneider Electric Lighting Systems Used Occupancy Sensors Basic Information
9.2.2 Schneider Electric Lighting Systems Used Occupancy Sensors Product Overview
9.2.3 Schneider Electric Lighting Systems Used Occupancy Sensors Product Market Performance
9.2.4 Schneider Electric Business Overview
9.2.5 Schneider Electric Lighting Systems Used Occupancy Sensors SWOT Analysis
9.2.6 Schneider Electric Recent Developments
9.3 Honeywell
9.3.1 Honeywell Lighting Systems Used Occupancy Sensors Basic Information
9.3.2 Honeywell Lighting Systems Used Occupancy Sensors Product Overview
9.3.3 Honeywell Lighting Systems Used Occupancy Sensors Product Market Performance
9.3.4 Honeywell Lighting Systems Used Occupancy Sensors SWOT Analysis
9.3.5 Honeywell Business Overview
9.3.6 Honeywell Recent Developments
9.4 GE Current
9.4.1 GE Current Lighting Systems Used Occupancy Sensors Basic Information
9.4.2 GE Current Lighting Systems Used Occupancy Sensors Product Overview
9.4.3 GE Current Lighting Systems Used Occupancy Sensors Product Market Performance
9.4.4 GE Current Business Overview
9.4.5 GE Current Recent Developments
9.5 Johnson Controls
9.5.1 Johnson Controls Lighting Systems Used Occupancy Sensors Basic Information
9.5.2 Johnson Controls Lighting Systems Used Occupancy Sensors Product Overview
9.5.3 Johnson Controls Lighting Systems Used Occupancy Sensors Product Market Performance
9.5.4 Johnson Controls Business Overview
9.5.5 Johnson Controls Recent Developments
9.6 Legrand
9.6.1 Legrand Lighting Systems Used Occupancy Sensors Basic Information
9.6.2 Legrand Lighting Systems Used Occupancy Sensors Product Overview
9.6.3 Legrand Lighting Systems Used Occupancy Sensors Product Market Performance
9.6.4 Legrand Business Overview
9.6.5 Legrand Recent Developments
9.7 Crestron Electronics
9.7.1 Crestron Electronics Lighting Systems Used Occupancy Sensors Basic Information
9.7.2 Crestron Electronics Lighting Systems Used Occupancy Sensors Product Overview
9.7.3 Crestron Electronics Lighting Systems Used Occupancy Sensors Product Market Performance
9.7.4 Crestron Electronics Business Overview
9.7.5 Crestron Electronics Recent Developments
9.8 Lutron Electronics
9.8.1 Lutron Electronics Lighting Systems Used Occupancy Sensors Basic Information
9.8.2 Lutron Electronics Lighting Systems Used Occupancy Sensors Product Overview
9.8.3 Lutron Electronics Lighting Systems Used Occupancy Sensors Product Market Performance
9.8.4 Lutron Electronics Business Overview
9.8.5 Lutron Electronics Recent Developments
9.9 Acuity Brands
9.9.1 Acuity Brands Lighting Systems Used Occupancy Sensors Basic Information
9.9.2 Acuity Brands Lighting Systems Used Occupancy Sensors Product Overview
9.9.3 Acuity Brands Lighting Systems Used Occupancy Sensors Product Market Performance
9.9.4 Acuity Brands Business Overview
9.9.5 Acuity Brands Recent Developments
9.10 OPTEX
9.10.1 OPTEX Lighting Systems Used Occupancy Sensors Basic Information
9.10.2 OPTEX Lighting Systems Used Occupancy Sensors Product Overview
9.10.3 OPTEX Lighting Systems Used Occupancy Sensors Product Market Performance
9.10.4 OPTEX Business Overview
9.10.5 OPTEX Recent Developments
9.11 Leviton Manufacturing Co.
9.11.1 Leviton Manufacturing Co. Lighting Systems Used Occupancy Sensors Basic Information
9.11.2 Leviton Manufacturing Co. Lighting Systems Used Occupancy Sensors Product Overview
9.11.3 Leviton Manufacturing Co. Lighting Systems Used Occupancy Sensors Product Market Performance
9.11.4 Leviton Manufacturing Co. Business Overview
9.11.5 Leviton Manufacturing Co. Recent Developments
9.12 Inc
9.12.1 Inc Lighting Systems Used Occupancy Sensors Basic Information
9.12.2 Inc Lighting Systems Used Occupancy Sensors Product Overview
9.12.3 Inc Lighting Systems Used Occupancy Sensors Product Market Performance
9.12.4 Inc Business Overview
9.12.5 Inc Recent Developments
9.13 Enerlites
9.13.1 Enerlites Lighting Systems Used Occupancy Sensors Basic Information
9.13.2 Enerlites Lighting Systems Used Occupancy Sensors Product Overview
9.13.3 Enerlites Lighting Systems Used Occupancy Sensors Product Market Performance
9.13.4 Enerlites Business Overview
9.13.5 Enerlites Recent Developments
9.14 Hubbell
9.14.1 Hubbell Lighting Systems Used Occupancy Sensors Basic Information
9.14.2 Hubbell Lighting Systems Used Occupancy Sensors Product Overview
9.14.3 Hubbell Lighting Systems Used Occupancy Sensors Product Market Performance
9.14.4 Hubbell Business Overview
9.14.5 Hubbell Recent Developments
9.15 ATSS
9.15.1 ATSS Lighting Systems Used Occupancy Sensors Basic Information
9.15.2 ATSS Lighting Systems Used Occupancy Sensors Product Overview
9.15.3 ATSS Lighting Systems Used Occupancy Sensors Product Market Performance
9.15.4 ATSS Business Overview
9.15.5 ATSS Recent Developments
10 Lighting Systems Used Occupancy Sensors Market Forecast by Region
10.1 Global Lighting Systems Used Occupancy Sensors Market Size Forecast
10.2 Global Lighting Systems Used Occupancy Sensors Market Forecast by Region
10.2.1 North America Market Size Forecast by Country
10.2.2 Europe Lighting Systems Used Occupancy Sensors Market Size Forecast by Country
10.2.3 Asia Pacific Lighting Systems Used Occupancy Sensors Market Size Forecast by Region
10.2.4 South America Lighting Systems Used Occupancy Sensors Market Size Forecast by Country
10.2.5 Middle East and Africa Forecasted Consumption of Lighting Systems Used Occupancy Sensors by Country
11 Forecast Market by Type and by Application (2025-2030)
11.1 Global Lighting Systems Used Occupancy Sensors Market Forecast by Type (2025-2030)
11.1.1 Global Forecasted Sales of Lighting Systems Used Occupancy Sensors by Type (2025-2030)
11.1.2 Global Lighting Systems Used Occupancy Sensors Market Size Forecast by Type (2025-2030)
11.1.3 Global Forecasted Price of Lighting Systems Used Occupancy Sensors by Type (2025-2030)
11.2 Global Lighting Systems Used Occupancy Sensors Market Forecast by Application (2025-2030)
11.2.1 Global Lighting Systems Used Occupancy Sensors Sales (K Units) Forecast by Application
11.2.2 Global Lighting Systems Used Occupancy Sensors Market Size (M USD) Forecast by Application (2025-2030)
12 Conclusion and Key FindingsList of Tables
Table 1. Introduction of the Type
Table 2. Introduction of the Application
Table 3. Market Size (M USD) Segment Executive Summary
Table 4. Lighting Systems Used Occupancy Sensors Market Size Comparison by Region (M USD)
Table 5. Global Lighting Systems Used Occupancy Sensors Sales (K Units) by Manufacturers (2019-2025)
Table 6. Global Lighting Systems Used Occupancy Sensors Sales Market Share by Manufacturers (2019-2025)
Table 7. Global Lighting Systems Used Occupancy Sensors Revenue (M USD) by Manufacturers (2019-2025)
Table 8. Global Lighting Systems Used Occupancy Sensors Revenue Share by Manufacturers (2019-2025)
Table 9. Company Type (Tier 1, Tier 2, and Tier 3) & (based on the Revenue in Lighting Systems Used Occupancy Sensors as of 2022)
Table 10. Global Market Lighting Systems Used Occupancy Sensors Average Price (USD/Unit) of Key Manufacturers (2019-2025)
Table 11. Manufacturers Lighting Systems Used Occupancy Sensors Sales Sites and Area Served
Table 12. Manufacturers Lighting Systems Used Occupancy Sensors Product Type
Table 13. Global Lighting Systems Used Occupancy Sensors Manufacturers Market Concentration Ratio (CR5 and HHI)
Table 14. Mergers & Acquisitions, Expansion Plans
Table 15. Industry Chain Map of Lighting Systems Used Occupancy Sensors
Table 16. Market Overview of Key Raw Materials
Table 17. Midstream Market Analysis
Table 18. Downstream Customer Analysis
Table 19. Key Development Trends
Table 20. Driving Factors
Table 21. Lighting Systems Used Occupancy Sensors Market Challenges
Table 22. Global Lighting Systems Used Occupancy Sensors Sales by Type (K Units)
Table 23. Global Lighting Systems Used Occupancy Sensors Market Size by Type (M USD)
Table 24. Global Lighting Systems Used Occupancy Sensors Sales (K Units) by Type (2019-2025)
Table 25. Global Lighting Systems Used Occupancy Sensors Sales Market Share by Type (2019-2025)
Table 26. Global Lighting Systems Used Occupancy Sensors Market Size (M USD) by Type (2019-2025)
Table 27. Global Lighting Systems Used Occupancy Sensors Market Size Share by Type (2019-2025)
Table 28. Global Lighting Systems Used Occupancy Sensors Price (USD/Unit) by Type (2019-2025)
Table 29. Global Lighting Systems Used Occupancy Sensors Sales (K Units) by Application
Table 30. Global Lighting Systems Used Occupancy Sensors Market Size by Application
Table 31. Global Lighting Systems Used Occupancy Sensors Sales by Application (2019-2025) & (K Units)
Table 32. Global Lighting Systems Used Occupancy Sensors Sales Market Share by Application (2019-2025)
Table 33. Global Lighting Systems Used Occupancy Sensors Sales by Application (2019-2025) & (M USD)
Table 34. Global Lighting Systems Used Occupancy Sensors Market Share by Application (2019-2025)
Table 35. Global Lighting Systems Used Occupancy Sensors Sales Growth Rate by Application (2019-2025)
Table 36. Global Lighting Systems Used Occupancy Sensors Sales by Region (2019-2025) & (K Units)
Table 37. Global Lighting Systems Used Occupancy Sensors Sales Market Share by Region (2019-2025)
Table 38. North America Lighting Systems Used Occupancy Sensors Sales by Country (2019-2025) & (K Units)
Table 39. Europe Lighting Systems Used Occupancy Sensors Sales by Country (2019-2025) & (K Units)
Table 40. Asia Pacific Lighting Systems Used Occupancy Sensors Sales by Region (2019-2025) & (K Units)
Table 41. South America Lighting Systems Used Occupancy Sensors Sales by Country (2019-2025) & (K Units)
Table 42. Middle East and Africa Lighting Systems Used Occupancy Sensors Sales by Region (2019-2025) & (K Units)
Table 43. Signify Lighting Systems Used Occupancy Sensors Basic Information
Table 44. Signify Lighting Systems Used Occupancy Sensors Product Overview
Table 45. Signify Lighting Systems Used Occupancy Sensors Sales (K Units), Revenue (M USD), Price (USD/Unit) and Gross Margin (2019-2025)
Table 46. Signify Business Overview
Table 47. Signify Lighting Systems Used Occupancy Sensors SWOT Analysis
Table 48. Signify Recent Developments
Table 49. Schneider Electric Lighting Systems Used Occupancy Sensors Basic Information
Table 50. Schneider Electric Lighting Systems Used Occupancy Sensors Product Overview
Table 51. Schneider Electric Lighting Systems Used Occupancy Sensors Sales (K Units), Revenue (M USD), Price (USD/Unit) and Gross Margin (2019-2025)
Table 52. Schneider Electric Business Overview
Table 53. Schneider Electric Lighting Systems Used Occupancy Sensors SWOT Analysis
Table 54. Schneider Electric Recent Developments
Table 55. Honeywell Lighting Systems Used Occupancy Sensors Basic Information
Table 56. Honeywell Lighting Systems Used Occupancy Sensors Product Overview
Table 57. Honeywell Lighting Systems Used Occupancy Sensors Sales (K Units), Revenue (M USD), Price (USD/Unit) and Gross Margin (2019-2025)
Table 58. Honeywell Lighting Systems Used Occupancy Sensors SWOT Analysis
Table 59. Honeywell Business Overview
Table 60. Honeywell Recent Developments
Table 61. GE Current Lighting Systems Used Occupancy Sensors Basic Information
Table 62. GE Current Lighting Systems Used Occupancy Sensors Product Overview
Table 63. GE Current Lighting Systems Used Occupancy Sensors Sales (K Units), Revenue (M USD), Price (USD/Unit) and Gross Margin (2019-2025)
Table 64. GE Current Business Overview
Table 65. GE Current Recent Developments
Table 66. Johnson Controls Lighting Systems Used Occupancy Sensors Basic Information
Table 67. Johnson Controls Lighting Systems Used Occupancy Sensors Product Overview
Table 68. Johnson Controls Lighting Systems Used Occupancy Sensors Sales (K Units), Revenue (M USD), Price (USD/Unit) and Gross Margin (2019-2025)
Table 69. Johnson Controls Business Overview
Table 70. Johnson Controls Recent Developments
Table 71. Legrand Lighting Systems Used Occupancy Sensors Basic Information
Table 72. Legrand Lighting Systems Used Occupancy Sensors Product Overview
Table 73. Legrand Lighting Systems Used Occupancy Sensors Sales (K Units), Revenue (M USD), Price (USD/Unit) and Gross Margin (2019-2025)
Table 74. Legrand Business Overview
Table 75. Legrand Recent Developments
Table 76. Crestron Electronics Lighting Systems Used Occupancy Sensors Basic Information
Table 77. Crestron Electronics Lighting Systems Used Occupancy Sensors Product Overview
Table 78. Crestron Electronics Lighting Systems Used Occupancy Sensors Sales (K Units), Revenue (M USD), Price (USD/Unit) and Gross Margin (2019-2025)
Table 79. Crestron Electronics Business Overview
Table 80. Crestron Electronics Recent Developments
Table 81. Lutron Electronics Lighting Systems Used Occupancy Sensors Basic Information
Table 82. Lutron Electronics Lighting Systems Used Occupancy Sensors Product Overview
Table 83. Lutron Electronics Lighting Systems Used Occupancy Sensors Sales (K Units), Revenue (M USD), Price (USD/Unit) and Gross Margin (2019-2025)
Table 84. Lutron Electronics Business Overview
Table 85. Lutron Electronics Recent Developments
Table 86. Acuity Brands Lighting Systems Used Occupancy Sensors Basic Information
Table 87. Acuity Brands Lighting Systems Used Occupancy Sensors Product Overview
Table 88. Acuity Brands Lighting Systems Used Occupancy Sensors Sales (K Units), Revenue (M USD), Price (USD/Unit) and Gross Margin (2019-2025)
Table 89. Acuity Brands Business Overview
Table 90. Acuity Brands Recent Developments
Table 91. OPTEX Lighting Systems Used Occupancy Sensors Basic Information
Table 92. OPTEX Lighting Systems Used Occupancy Sensors Product Overview
Table 93. OPTEX Lighting Systems Used Occupancy Sensors Sales (K Units), Revenue (M USD), Price (USD/Unit) and Gross Margin (2019-2025)
Table 94. OPTEX Business Overview
Table 95. OPTEX Recent Developments
Table 96. Leviton Manufacturing Co. Lighting Systems Used Occupancy Sensors Basic Information
Table 97. Leviton Manufacturing Co. Lighting Systems Used Occupancy Sensors Product Overview
Table 98. Leviton Manufacturing Co. Lighting Systems Used Occupancy Sensors Sales (K Units), Revenue (M USD), Price (USD/Unit) and Gross Margin (2019-2025)
Table 99. Leviton Manufacturing Co. Business Overview
Table 100. Leviton Manufacturing Co. Recent Developments
Table 101. Inc Lighting Systems Used Occupancy Sensors Basic Information
Table 102. Inc Lighting Systems Used Occupancy Sensors Product Overview
Table 103. Inc Lighting Systems Used Occupancy Sensors Sales (K Units), Revenue (M USD), Price (USD/Unit) and Gross Margin (2019-2025)
Table 104. Inc Business Overview
Table 105. Inc Recent Developments
Table 106. Enerlites Lighting Systems Used Occupancy Sensors Basic Information
Table 107. Enerlites Lighting Systems Used Occupancy Sensors Product Overview
Table 108. Enerlites Lighting Systems Used Occupancy Sensors Sales (K Units), Revenue (M USD), Price (USD/Unit) and Gross Margin (2019-2025)
Table 109. Enerlites Business Overview
Table 110. Enerlites Recent Developments
Table 111. Hubbell Lighting Systems Used Occupancy Sensors Basic Information
Table 112. Hubbell Lighting Systems Used Occupancy Sensors Product Overview
Table 113. Hubbell Lighting Systems Used Occupancy Sensors Sales (K Units), Revenue (M USD), Price (USD/Unit) and Gross Margin (2019-2025)
Table 114. Hubbell Business Overview
Table 115. Hubbell Recent Developments
Table 116. ATSS Lighting Systems Used Occupancy Sensors Basic Information
Table 117. ATSS Lighting Systems Used Occupancy Sensors Product Overview
Table 118. ATSS Lighting Systems Used Occupancy Sensors Sales (K Units), Revenue (M USD), Price (USD/Unit) and Gross Margin (2019-2025)
Table 119. ATSS Business Overview
Table 120. ATSS Recent Developments
Table 121. Global Lighting Systems Used Occupancy Sensors Sales Forecast by Region (2025-2030) & (K Units)
Table 122. Global Lighting Systems Used Occupancy Sensors Market Size Forecast by Region (2025-2030) & (M USD)
Table 123. North America Lighting Systems Used Occupancy Sensors Sales Forecast by Country (2025-2030) & (K Units)
Table 124. North America Lighting Systems Used Occupancy Sensors Market Size Forecast by Country (2025-2030) & (M USD)
Table 125. Europe Lighting Systems Used Occupancy Sensors Sales Forecast by Country (2025-2030) & (K Units)
Table 126. Europe Lighting Systems Used Occupancy Sensors Market Size Forecast by Country (2025-2030) & (M USD)
Table 127. Asia Pacific Lighting Systems Used Occupancy Sensors Sales Forecast by Region (2025-2030) & (K Units)
Table 128. Asia Pacific Lighting Systems Used Occupancy Sensors Market Size Forecast by Region (2025-2030) & (M USD)
Table 129. South America Lighting Systems Used Occupancy Sensors Sales Forecast by Country (2025-2030) & (K Units)
Table 130. South America Lighting Systems Used Occupancy Sensors Market Size Forecast by Country (2025-2030) & (M USD)
Table 131. Middle East and Africa Lighting Systems Used Occupancy Sensors Consumption Forecast by Country (2025-2030) & (Units)
Table 132. Middle East and Africa Lighting Systems Used Occupancy Sensors Market Size Forecast by Country (2025-2030) & (M USD)
Table 133. Global Lighting Systems Used Occupancy Sensors Sales Forecast by Type (2025-2030) & (K Units)
Table 134. Global Lighting Systems Used Occupancy Sensors Market Size Forecast by Type (2025-2030) & (M USD)
Table 135. Global Lighting Systems Used Occupancy Sensors Price Forecast by Type (2025-2030) & (USD/Unit)
Table 136. Global Lighting Systems Used Occupancy Sensors Sales (K Units) Forecast by Application (2025-2030)
Table 137. Global Lighting Systems Used Occupancy Sensors Market Size Forecast by Application (2025-2030) & (M USD)
List of Figures
Figure 1. Product Picture of Lighting Systems Used Occupancy Sensors
Figure 2. Data Triangulation
Figure 3. Key Caveats
Figure 4. Global Lighting Systems Used Occupancy Sensors Market Size (M USD), 2019-2030
Figure 5. Global Lighting Systems Used Occupancy Sensors Market Size (M USD) (2019-2030)
Figure 6. Global Lighting Systems Used Occupancy Sensors Sales (K Units) & (2019-2030)
Figure 7. Evaluation Matrix of Segment Market Development Potential (Type)
Figure 8. Evaluation Matrix of Segment Market Development Potential (Application)
Figure 9. Evaluation Matrix of Regional Market Development Potential
Figure 10. Lighting Systems Used Occupancy Sensors Market Size by Country (M USD)
Figure 11. Lighting Systems Used Occupancy Sensors Sales Share by Manufacturers in 2023
Figure 12. Global Lighting Systems Used Occupancy Sensors Revenue Share by Manufacturers in 2023
Figure 13. Lighting Systems Used Occupancy Sensors Market Share by Company Type (Tier 1, Tier 2 and Tier 3): 2023
Figure 14. Global Market Lighting Systems Used Occupancy Sensors Average Price (USD/Unit) of Key Manufacturers in 2023
Figure 15. The Global 5 and 10 Largest Players: Market Share by Lighting Systems Used Occupancy Sensors Revenue in 2023
Figure 16. Evaluation Matrix of Segment Market Development Potential (Type)
Figure 17. Global Lighting Systems Used Occupancy Sensors Market Share by Type
Figure 18. Sales Market Share of Lighting Systems Used Occupancy Sensors by Type (2019-2025)
Figure 19. Sales Market Share of Lighting Systems Used Occupancy Sensors by Type in 2023
Figure 20. Market Size Share of Lighting Systems Used Occupancy Sensors by Type (2019-2025)
Figure 21. Market Size Market Share of Lighting Systems Used Occupancy Sensors by Type in 2023
Figure 22. Evaluation Matrix of Segment Market Development Potential (Application)
Figure 23. Global Lighting Systems Used Occupancy Sensors Market Share by Application
Figure 24. Global Lighting Systems Used Occupancy Sensors Sales Market Share by Application (2019-2025)
Figure 25. Global Lighting Systems Used Occupancy Sensors Sales Market Share by Application in 2023
Figure 26. Global Lighting Systems Used Occupancy Sensors Market Share by Application (2019-2025)
Figure 27. Global Lighting Systems Used Occupancy Sensors Market Share by Application in 2023
Figure 28. Global Lighting Systems Used Occupancy Sensors Sales Growth Rate by Application (2019-2025)
Figure 29. Global Lighting Systems Used Occupancy Sensors Sales Market Share by Region (2019-2025)
Figure 30. North America Lighting Systems Used Occupancy Sensors Sales and Growth Rate (2019-2025) & (K Units)
Figure 31. North America Lighting Systems Used Occupancy Sensors Sales Market Share by Country in 2023
Figure 32. U.S. Lighting Systems Used Occupancy Sensors Sales and Growth Rate (2019-2025) & (K Units)
Figure 33. Canada Lighting Systems Used Occupancy Sensors Sales (K Units) and Growth Rate (2019-2025)
Figure 34. Mexico Lighting Systems Used Occupancy Sensors Sales (Units) and Growth Rate (2019-2025)
Figure 35. Europe Lighting Systems Used Occupancy Sensors Sales and Growth Rate (2019-2025) & (K Units)
Figure 36. Europe Lighting Systems Used Occupancy Sensors Sales Market Share by Country in 2023
Figure 37. Germany Lighting Systems Used Occupancy Sensors Sales and Growth Rate (2019-2025) & (K Units)
Figure 38. France Lighting Systems Used Occupancy Sensors Sales and Growth Rate (2019-2025) & (K Units)
Figure 39. U.K. Lighting Systems Used Occupancy Sensors Sales and Growth Rate (2019-2025) & (K Units)
Figure 40. Italy Lighting Systems Used Occupancy Sensors Sales and Growth Rate (2019-2025) & (K Units)
Figure 41. Russia Lighting Systems Used Occupancy Sensors Sales and Growth Rate (2019-2025) & (K Units)
Figure 42. Asia Pacific Lighting Systems Used Occupancy Sensors Sales and Growth Rate (K Units)
Figure 43. Asia Pacific Lighting Systems Used Occupancy Sensors Sales Market Share by Region in 2023
Figure 44. China Lighting Systems Used Occupancy Sensors Sales and Growth Rate (2019-2025) & (K Units)
Figure 45. Japan Lighting Systems Used Occupancy Sensors Sales and Growth Rate (2019-2025) & (K Units)
Figure 46. South Korea Lighting Systems Used Occupancy Sensors Sales and Growth Rate (2019-2025) & (K Units)
Figure 47. India Lighting Systems Used Occupancy Sensors Sales and Growth Rate (2019-2025) & (K Units)
Figure 48. Southeast Asia Lighting Systems Used Occupancy Sensors Sales and Growth Rate (2019-2025) & (K Units)
Figure 49. South America Lighting Systems Used Occupancy Sensors Sales and Growth Rate (K Units)
Figure 50. South America Lighting Systems Used Occupancy Sensors Sales Market Share by Country in 2023
Figure 51. Brazil Lighting Systems Used Occupancy Sensors Sales and Growth Rate (2019-2025) & (K Units)
Figure 52. Argentina Lighting Systems Used Occupancy Sensors Sales and Growth Rate (2019-2025) & (K Units)
Figure 53. Columbia Lighting Systems Used Occupancy Sensors Sales and Growth Rate (2019-2025) & (K Units)
Figure 54. Middle East and Africa Lighting Systems Used Occupancy Sensors Sales and Growth Rate (K Units)
Figure 55. Middle East and Africa Lighting Systems Used Occupancy Sensors Sales Market Share by Region in 2023
Figure 56. Saudi Arabia Lighting Systems Used Occupancy Sensors Sales and Growth Rate (2019-2025) & (K Units)
Figure 57. UAE Lighting Systems Used Occupancy Sensors Sales and Growth Rate (2019-2025) & (K Units)
Figure 58. Egypt Lighting Systems Used Occupancy Sensors Sales and Growth Rate (2019-2025) & (K Units)
Figure 59. Nigeria Lighting Systems Used Occupancy Sensors Sales and Growth Rate (2019-2025) & (K Units)
Figure 60. South Africa Lighting Systems Used Occupancy Sensors Sales and Growth Rate (2019-2025) & (K Units)
Figure 61. Global Lighting Systems Used Occupancy Sensors Sales Forecast by Volume (2019-2030) & (K Units)
Figure 62. Global Lighting Systems Used Occupancy Sensors Market Size Forecast by Value (2019-2030) & (M USD)
Figure 63. Global Lighting Systems Used Occupancy Sensors Sales Market Share Forecast by Type (2025-2030)
Figure 64. Global Lighting Systems Used Occupancy Sensors Market Share Forecast by Type (2025-2030)
Figure 65. Global Lighting Systems Used Occupancy Sensors Sales Forecast by Application (2025-2030)
Figure 66. Global Lighting Systems Used Occupancy Sensors Market Share Forecast by Application (2025-2030)