MARKET INSIGHTS
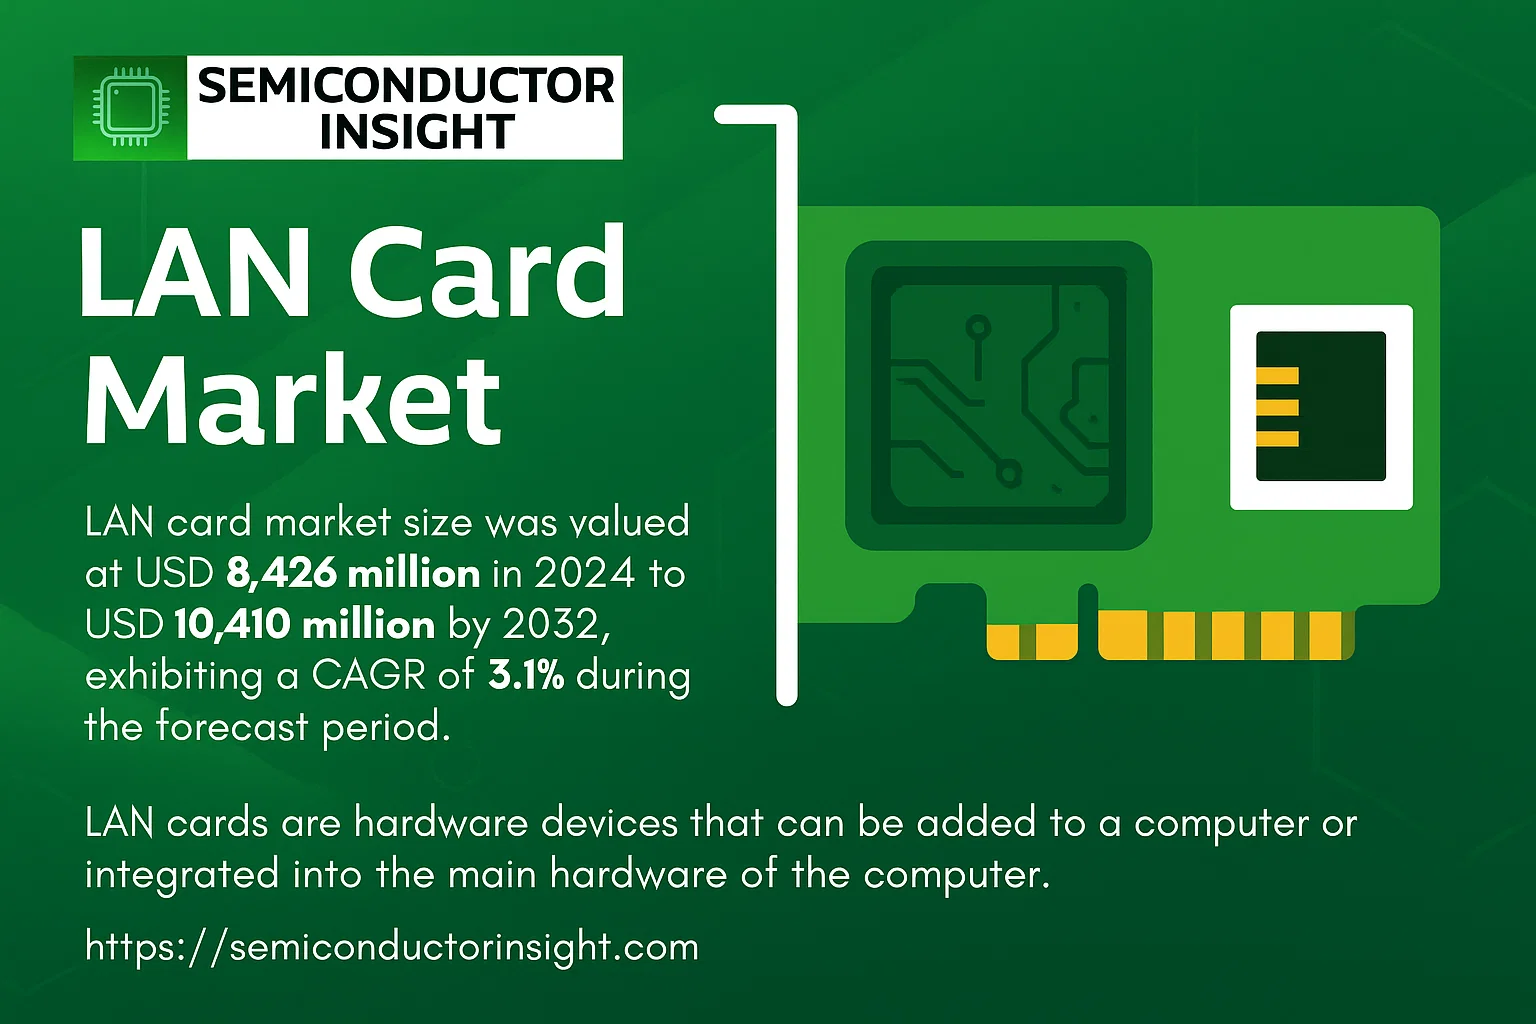
Global LAN card market size was valued at USD 8,426 million in 2024 to USD 10,410 million by 2032, exhibiting a CAGR of 3.1% during the forecast period.
LAN cards are hardware devices that can be added to a computer or integrated into the main hardware of the computer. These network interface cards facilitate connections between computers and local area networks, enabling data transmission through various interfaces including Ethernet cables, USB connections, and wireless technologies.
The market is experiencing steady growth driven by increasing demand for high-speed internet connectivity, expansion of corporate networks, and rising adoption of IoT devices. However, the market faces challenges from integrated network solutions in modern motherboards. Key players like Intel, TP-Link, and D-Link continue to innovate with advanced products supporting higher bandwidth requirements. China dominates the global market with approximately 36% share, followed by North America at 23%, reflecting regional disparities in technology adoption and manufacturing capabilities.
MARKET DRIVERS
Proliferation of High-Speed Connectivity Standards
The transition to faster network standards, including 2.5GbE, 5GbE, and 10GbE, is a primary driver for the LAN card market. As enterprises and data centers demand higher bandwidth to support data-intensive applications like cloud computing, video conferencing, and real-time analytics, the upgrade cycle for network interface cards accelerates. This technological evolution creates a continuous refresh market for compatible hardware.
Expansion of Data Center Infrastructure
Global investment in hyperscale and enterprise data centers is fueling demand for high-performance LAN cards. The need for reliable, low-latency connectivity within server racks and between data center nodes is critical. The rise of AI workloads and distributed computing further necessitates specialized network interface cards capable of handling massive parallel data flows, with shipments for data center NICs projected to grow significantly.
➤ The work-from-home and hybrid work models have permanently increased the need for robust and reliable home and small office networking equipment, including high-quality internal and external LAN cards.
Lastly, the gaming and content creation sectors are key consumer segments. Gamers and professionals require stable, high-throughput connections to minimize latency and ensure smooth performance, driving the adoption of dedicated, high-end Ethernet cards over integrated motherboard solutions.
MARKET CHALLENGES
Competition from Integrated Solutions
A significant challenge for the dedicated LAN card market is the prevalence of integrated network interface controllers (NICs) on motherboards. For many standard consumer and business PCs, the built-in Ethernet port is sufficient, reducing the need for an aftermarket add-in card, which cannibalizes a large portion of the potential market.
Other Challenges
Rapid Technological Obsolescence
The pace of change in networking standards requires constant investment in R&D by manufacturers. Cards that support older standards like Gigabit Ethernet face diminishing demand as the industry moves toward multi-gigabit speeds, posing a challenge for inventory management and product lifecycle planning.
Supply Chain Constraints and Cost Pressures
Fluctuations in the availability and cost of key components, such as controllers and PHY chips, can lead to production delays and increased manufacturing costs. This volatility challenges manufacturers’ ability to maintain competitive pricing and stable supply, especially for high-volume orders.
MARKET RESTRAINTS
Market Maturity and Saturation in Key Segments
The market for basic Gigabit Ethernet cards is highly mature and faces saturation, particularly in the consumer and small business segments. Growth in these areas is largely limited to replacement cycles rather than new customer acquisition, acting as a restraint on overall market expansion for entry-level products.
Increasing Wireless Substitution
The advancement and adoption of high-speed Wi-Fi standards, such as Wi-Fi 6 and Wi-Fi 6E, present a growing restraint. For many mobile devices and even desktop setups, a robust wireless connection can adequately replace a wired Ethernet connection, reducing the necessity for a dedicated LAN card in certain environments.
MARKET OPPORTUNITIES
Emergence of Specialized and Smart NICs
The growing complexity of data center workloads creates a substantial opportunity for SmartNICs and Data Processing Units (DPUs). These advanced LAN cards offload processing tasks like security, storage, and networking from the main CPU, offering significant performance gains. This niche is expected to be a high-growth segment.
Growth in Industrial and IoT Applications
The Industrial Internet of Things (IIoT) and automation sectors represent a promising frontier. These applications require reliable, deterministic wired networked communications in harsh environments, driving demand for ruggedized and industrial-grade Ethernet cards with features like wide temperature tolerance and extended product lifecycles.
Adoption in Emerging Economies
As broadband infrastructure continues to develop in emerging economies, there is significant potential for market penetration. The ongoing digitalization of businesses and the establishment of new data centers in these regions will fuel demand for networking hardware, including LAN cards, over the coming years.
Lan Card Market Trends
Sustained Growth Driven by Network Infrastructure Expansion
The global Lan Card market is on a steady growth trajectory, with its valuation projected to increase from US$ 8426 million in 2024 to US$ 10410 million by 2032, representing a compound annual growth rate (CAGR) of 3.1%. This consistent expansion is primarily fueled by the ongoing global demand for robust and reliable network connectivity across both residential and commercial sectors. As businesses continue to digitize operations and remote work models persist, the need for stable wired connections provided by LAN cards in desktop and personal computers remains strong. The market’s stability is further underscored by the maturity of the technology and its critical role in local area network infrastructure.
Other Trends
Market Dominance by Speed and Geography
The market is segmented by connection speed, with 1000 Mbps (Gigabit Ethernet) cards holding a dominant share, as they offer the ideal balance of performance and cost for most modern applications. The adoption of 10 Gbps cards is growing within data centers and high-performance computing environments. Geographically, China is the largest market, accounting for approximately 36% of the global share, driven by its massive manufacturing base and IT industry. North America follows as the second-largest market with a 23% share, supported by advanced IT infrastructure and high technology adoption rates.
Consolidated Competitive Landscape
The competitive environment is highly concentrated, with the top three companies—Intel, TP-Link, and D-Link—collectively holding about 78% of the total market share. This high level of consolidation indicates significant barriers to entry, including brand reputation, extensive distribution networks, and technological expertise. Other key players such as Asus, Netgear, Netcore, FAST, B-Link, and Mercury compete by focusing on specific segments, offering value-oriented products or specialized solutions for gaming and small office/home office (SOHO) applications.
Segmentation by Application and Future Outlook
Application-wise, the market is divided between desktop computers, personal computers, and other uses. The demand from the desktop computer segment remains robust, particularly in corporate and industrial settings where wired connectivity is preferred for its reliability and security. The market’s future development will be influenced by factors such as the integration of more advanced network interface controllers (NICs) on motherboards, which could impact the demand for discrete add-in cards, and the evolving needs of emerging technologies that require high-speed, low-latency connections.
COMPETITIVE LANDSCAPE
Key Industry Players
A Market Dominated by Networking Giants and Specialized Vendors
The global LAN Card market is characterized by a high level of concentration, with the top three players collectively commanding approximately 78% of the total market share. Intel stands as the undisputed leader, leveraging its significant brand recognition and technological expertise in networking and connectivity chipsets. The market structure is oligopolistic, where a few major companies, including TP-Link and D-Link, compete intensely on factors such as price, product performance, and brand reputation. These leading players benefit from extensive distribution networks, strong R&D capabilities allowing for a diverse portfolio spanning from basic Ethernet cards to high-speed 10 Gbps solutions, and economies of scale that present significant barriers to entry for new competitors. The market’s growth, projected to reach US$ 10,410 million by 2032, is driven by these key players who continuously innovate to meet the evolving demands of both desktop and personal computer applications.
Beyond the dominant players, the market features several other significant companies that have carved out successful niches. Vendors like Asus and Netgear focus on the premium and gaming segments, offering high-performance, low-latency cards with advanced features. Regional players, particularly in the Asia-Pacific market which is the largest globally, have a strong foothold. Companies such as Netcore, FAST (a brand under TP-Link), B-Link, and Mercury compete effectively by offering cost-competitive products tailored to local market demands, especially in China which accounts for about 36% of the market. These companies often focus on specific speed segments, like 100 Mbps and 1000 Mbps, which represent substantial market portions, allowing them to maintain relevance against the broader portfolios of the industry leaders.
List of Key Lan Card Companies Profiled
- Intel
- TP-Link
- D-Link
- Asus
- Netgear
- Netcore
- FAST
- B-Link
- Mercury
- TRENDnet
- Zyxel
- StarTech.com
- Ugreen
- StarTech
- Edimax
Segment Analysis:
| Segment Category | Sub-Segments | Key Insights |
| By Type |
|
1000 Mbps (Gigabit Ethernet) represents a significant technological sweet spot, offering the optimal balance between cost-effectiveness and the high-speed performance demanded by modern networks for everyday business and high-bandwidth home applications. While 10 Gbps cards cater to premium enterprise and data center environments requiring extreme throughput, their adoption is moderated by higher costs and complexity. The enduring relevance of 10/100 Mbps cards is primarily sustained by legacy systems and cost-sensitive applications where speed is not a critical factor, indicating a bifurcated market. |
| By Application |
|
Desktop Computer applications are the primary driver for discrete LAN cards, as these systems often require add-in cards to enable or upgrade network connectivity, especially in corporate environments, gaming rigs, and workstations where stable, high-speed wired connections are paramount. Personal computers, which largely include laptops, typically rely on integrated network interfaces, but the market for external USB LAN adapters remains relevant for devices with faulty or outdated built-in components. The “Other” segment encompasses specialized uses in servers, network storage devices, and industrial computing, where reliability and performance specifications are critically stringent. |
| By End User |
|
Commercial & Enterprise sector constitutes the most substantial and consistent demand base, driven by the continuous need to build, maintain, and upgrade vast corporate IT infrastructures. This segment prioritizes reliability, security features, and vendor support. The Individual & Residential segment shows steady demand linked to gaming, home office setups, and media streaming, often favoring well-known consumer brands. The Industrial & Government segment, while smaller in volume, demands highly robust and sometimes specialized products for harsh environments or secure communications, representing a niche but high-value market. |
| By Connectivity |
|
Wired (Ethernet) connectivity remains the dominant and most reliable method for network access, prized for its superior stability, low latency, and high security, making it indispensable for business-critical applications and high-performance computing. Wireless LAN cards cater to the growing mobility trend, offering flexibility for laptops and devices where cabling is impractical, though they can be susceptible to interference. USB adapters serve as a versatile and plug-and-play solution for quickly adding network capability to any device with a USB port, bridging the gap for devices lacking built-in options and appealing particularly to non-technical users. |
| By Form Factor |
|
Internal (PCI/PCIe) cards are the traditional choice for desktop computers, offering a permanent, high-performance solution directly connected to the motherboard, which is preferred for systems requiring optimal throughput and stability. External USB adapters provide exceptional convenience and portability, allowing users to easily add network connectivity without opening the computer case, making them ideal for laptops and temporary setups. Integrated on-board LAN is now a standard feature on nearly all motherboards, which has reduced the demand for basic add-in cards but has simultaneously raised expectations for performance, fueling the market for high-end discrete cards that offer advanced features beyond the capabilities of standard integrated controllers. |
Regional Analysis: Lan Card Market
Asia-Pacific
The primary drivers are the massive investments in digital infrastructure, including the deployment of fiber optics and 5G, which necessitate compatible and high-performance Lan Cards. The expansion of the IT & telecom sector, along with the growth of SMEs requiring reliable office networks, creates a consistent, high-volume demand. Government initiatives promoting digitalization and the ‘Make in Asia’ trend for electronics manufacturing are also significant catalysts for market growth in the region.
Key consumers of Lan Cards in Asia-Pacific include the IT & telecommunications industry, large enterprise corporations, the rapidly growing data center sector, and the gaming industry. The manufacturing sector’s shift towards Industry 4.0 and industrial IoT applications also represents a major vertical, requiring robust and reliable wired network connectivity for machinery and control systems, driving demand for industrial-grade Lan Cards.
The market is characterized by fierce competition among both international brands and a multitude of strong local manufacturers, particularly from China and Taiwan. This competition drives rapid technological advancements and price competitiveness. Local players often have an advantage in cost-effectiveness and understanding regional market nuances, while global brands compete on reputation, reliability, and support for cutting-edge standards like multi-gigabit and PoE capabilities.
The future outlook remains exceptionally positive, with growth expected to be sustained by the ongoing digital transformation across all sectors. The advent of Wi-Fi 6E and upcoming Wi-Fi 7 standards will spur demand for compatible internal and external Lan Cards. The continuous expansion of cloud computing and the metaverse concept will further drive the need for high-speed, low-latency wired network interfaces in both consumer and professional settings.
North America
North America represents a highly mature and technologically advanced market for Lan Cards, characterized by early adoption of new networking standards and a strong emphasis on high-performance solutions. The region’s demand is driven by the widespread presence of large enterprises, hyperscale data centers, and a demanding consumer base for gaming and high-definition content streaming. There is a significant focus on upgrading existing infrastructure to support higher bandwidths, such as 2.5GbE, 5GbE, and 10GbE, especially in professional environments. The market is less about volume and more about value, with a preference for branded, feature-rich products that offer reliability, security features, and advanced management capabilities. The push for remote and hybrid work models has also sustained demand for quality home and small office networking equipment, including external USB Lan Cards for laptops.
Europe
The European Lan Card market is steady and growth-oriented, driven by stringent data regulations, a strong industrial base, and continuous enterprise IT modernization. Countries like Germany, the UK, and France are key markets, with demand stemming from the automotive, manufacturing, and financial services sectors that require secure and resilient network infrastructure. The region shows a strong inclination towards energy-efficient and environmentally compliant products. The market is competitive, with a mix of global players and specialized European manufacturers. Growth is supported by initiatives like the EU’s digital decade, which promotes connectivity and digital skills, leading to incremental upgrades in network hardware across businesses and institutions, ensuring a consistent demand for reliable Lan Cards.
South America
The Lan Card market in South America is an emerging market with growth potential, though it faces challenges related to economic volatility and uneven infrastructure development. Brazil and Argentina are the most significant markets. Demand is primarily driven by the gradual expansion of broadband internet services, growth in the IT sector, and increasing digitalization of businesses. The market is price-sensitive, with a higher share of entry-level and mid-range products. Adoption is often tied to necessary replacements and upgrades rather than cutting-edge technology adoption. Despite slower growth compared to other regions, the ongoing digital transformation in urban centers and the need for basic network connectivity in a growing number of SMEs provide a stable base for market development.
Middle East & Africa
The Middle East & Africa region presents a diverse landscape for the Lan Card market. The Gulf Cooperation Council (GCC) countries, with their strong oil economies, are investing heavily in smart city projects, tourism infrastructure, and digital government services, creating demand for high-quality networking equipment. In contrast, other parts of Africa are focused on building foundational network infrastructure, where demand is for cost-effective and durable Lan Cards. The market is nascent in many African nations but holds long-term potential as internet penetration increases. Overall, the region’s growth is tied to large-scale government-led infrastructure projects and the gradual expansion of the commercial and industrial sectors.
Report Scope
This market research report provides a comprehensive analysis of the Lan Card Market , covering the forecast period 2025–2032. It offers detailed insights into market dynamics, technological advancements, competitive landscape, and key trends shaping the industry.
Key focus areas of the report include:
- Market Overview: The report begins with an overview outlining its current market scenario, key growth indicators, and industry transformation drivers. It discusses macroeconomic factors, demand–supply balance, regulatory landscape, and the strategic role of semiconductors in powering advancements across industries such as automotive, telecommunications, consumer electronics, and industrial automation.
- Market Size & Forecast: Historical data and future projections for revenue, unit shipments, and market value across major regions and segments.
- Segmentation Analysis: Detailed breakdown by product type, technology, application, and end-user industry to identify high-growth segments and investment opportunities.
- Regional Insights: Insights into market performance across North America, Europe, Asia-Pacific, Latin America, and the Middle East & Africa, including country-level analysis where relevant.
- Competitive Landscape: Profiles of leading market participants, including their product offerings, R&D focus, manufacturing capacity, pricing strategies, and recent developments such as mergers, acquisitions, and partnerships.
- Technology Trends & Innovation: Assessment of emerging technologies, integration of AI/IoT, semiconductor design trends, fabrication techniques, and evolving industry standards.
- Market Drivers & Restraints: Evaluation of factors driving market growth along with challenges, supply chain constraints, regulatory issues, and market-entry barriers.
- Stakeholder Insights: Insights for component suppliers, OEMs, system integrators, investors, and policymakers regarding the evolving ecosystem and strategic opportunities.
Primary and secondary research methods are employed, including interviews with industry experts, data from verified sources, and real-time market intelligence to ensure the accuracy and reliability of the insights presented.
FREQUENTLY ASKED QUESTIONS:
What is the current market size of Lan Card Market?
-> Global Lan Card Market was valued at USD 8426 million in 2024 and is projected to reach USD 10410 million by 2032, growing at a CAGR of 3.1% during the forecast period.
Which key companies operate in Lan Card Market?
-> Key players include Intel, TP-Link, D-Link, Asus, Netgear, Netcore, FAST, B-Link, Mercury, among others, with the top 3 companies occupying about 78% market share.
What are the key growth drivers?
-> Key growth drivers include increasing demand for network connectivity, expansion of IT infrastructure, growth in data centers, and rising adoption of high-speed internet technologies.
Which region dominates the market?
-> China is the largest Lan Card market with about 36% market share, followed by North America accounting for about 23% market share.
What are the emerging trends?
-> Emerging trends include the integration of AI/IoT technologies, development of faster Ethernet standards (10 Gbps), wireless connectivity advancements, and growing demand for network interface cards in desktop and personal computers.

Get Sample Report PDF for Exclusive Insights
Report Sample Includes
- Table of Contents
- List of Tables & Figures
- Charts, Research Methodology, and more...