Ion Exchange Membrane of All-Vanadium Redox Flow Battery Market, Global Business Strategies 2026-2033

Ion Exchange Membrane of All-Vanadium Redox Flow Battery Market was valued at USD 27.1 million in 2025. The market is projected to grow from USD 32.5 million in 2026 to USD 97 million by 2033, exhibiting a CAGR of 20.6% during the forecast period.

PDF Icon Download Sample Report PDF
  • Quick Dispatch

    All Orders

  • Secure Payment

    100% Secure Payment

Price range: $1,500.00 through $4,250.00

Clear

Market Insights

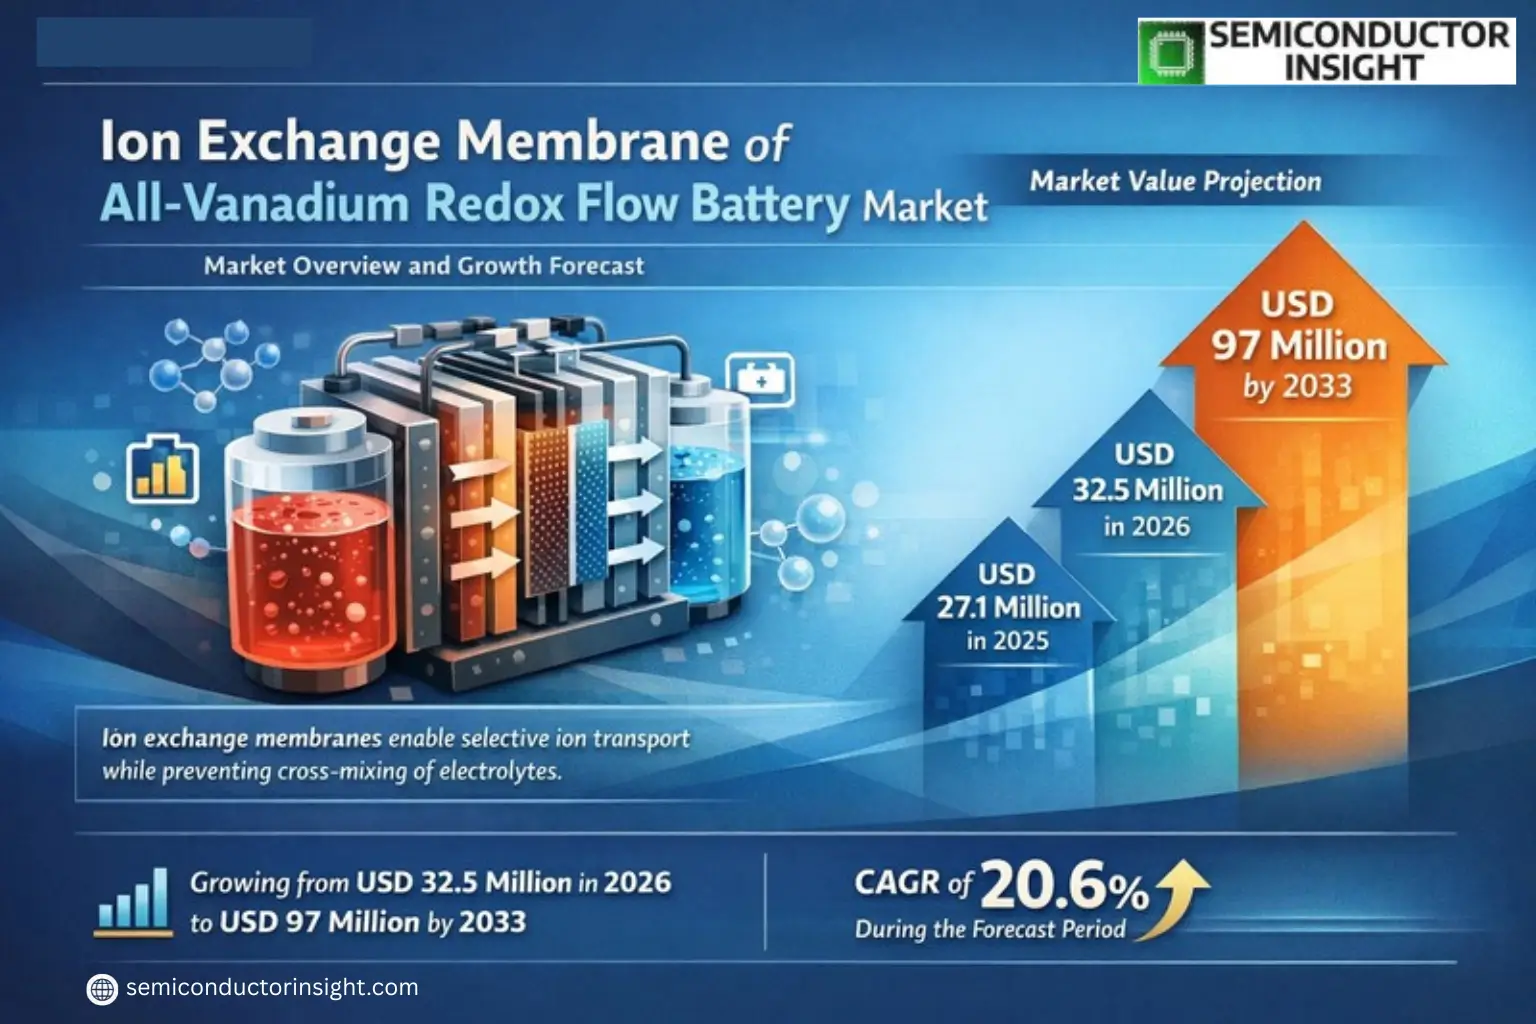
Global Ion Exchange Membrane of All-Vanadium Redox Flow Battery Market was valued at USD 27.1 million in 2025. The market is projected to grow from USD 32.5 million in 2026 to USD 97 million by 2033, exhibiting a CAGR of 20.6% during the forecast period.

Ion exchange membranes are critical components in all-vanadium redox flow batteries (VRFBs), enabling selective ion transport while preventing cross-mixing of electrolytes. These membranes separate the positive and negative chambers of VRFBs, which contain vanadium ions in different oxidation states (VO2+/VO2+ and V2+/V3+). The membrane’s proton conductivity and chemical stability directly impact battery efficiency, lifespan, and energy density.

The market growth is driven by increasing demand for large-scale energy storage solutions, particularly for renewable energy integration and grid stabilization. North America dominates with a 90% market share due to early adoption and strong R&D investments, while Asia-Pacific shows rapid growth potential. Full-fluorinated ion exchange membranes lead the product segment with a 60% share owing to superior durability. Key players like Chemours Company and FuMa-Tech are expanding production capacities to meet rising demand from utilities and industrial applications.

Xyz market size & forecast

MARKET DRIVERS

Growing Demand for Energy Storage Solutions

The increasing adoption of renewable energy sources has propelled demand for efficient energy storage systems, with all-vanadium redox flow batteries emerging as a key solution. The ion exchange membrane segment benefits directly from this trend, as it serves as a critical component determining battery performance and longevity. Market growth is further accelerated by grid modernization initiatives worldwide.

Technological Advancements in Membrane Materials

Recent developments in perfluorinated and hydrocarbon-based ion exchange membranes have significantly improved proton conductivity and chemical stability in vanadium redox flow batteries. These innovations extend membrane lifespans while reducing crossover contamination between electrolytes, making the technology more commercially viable.

Government incentives for clean energy storage and ambitious carbon neutrality targets continue to create favorable conditions for ion exchange membrane manufacturers in this sector.

MARKET CHALLENGES

High Material Costs Limiting Adoption

The premium cost of advanced ion exchange membranes remains a barrier to widespread adoption in the all-vanadium redox flow battery market. Nafion-based membranes, while high-performing, account for approximately 40% of total battery system costs, making alternatives financially attractive despite performance trade-offs.

Other Challenges

Technical Performance Limitations
Membrane degradation and vanadium ion crossover continue to impact battery efficiency, requiring ongoing R&D investments to address these fundamental constraints in ion exchange membrane technology.

MARKET RESTRAINTS

Supply Chain Vulnerabilities for Critical Materials

Geopolitical factors and concentrated production of key membrane materials create supply chain risks for ion exchange membrane manufacturers. The vanadium redox flow battery market faces particular sensitivity to these constraints, as membrane production requires specialized chemical precursors with limited global suppliers.

MARKET OPPORTUNITIES

Emerging Applications in Utility-Scale Storage

The increasing deployment of utility-scale energy storage projects presents significant growth potential for ion exchange membrane producers. Markets in Asia-Pacific and North America are investing heavily in 100+ MWh vanadium redox flow battery installations, each requiring thousands of square meters of high-performance membranes.
Ion Exchange Membrane of All-Vanadium Redox Flow Battery Market Trends

Rapid Market Expansion with 20.6% CAGR Projection

Global Ion Exchange Membrane for All-Vanadium Redox Flow Batteries market was valued at USD 27.1 million in 2025 and is projected to reach USD 97 million by 2033. This growth is primarily driven by increasing adoption of large-scale energy storage solutions and renewable energy integration. The proton exchange membrane plays a critical role in these systems by separating electrolytes while allowing ion transport between battery chambers.

Other Trends

Dominance of Full-Fluorine Membranes

Full-fluorinion Ion Exchange Membranes currently hold 60% market share due to their superior chemical stability and proton conductivity. These membranes are crucial for maintaining battery efficiency across charge-discharge cycles in VRB systems. Manufacturers are focusing on improving membrane durability to extend battery lifespan.

Regional Market Concentration

North America dominates with 90% market share, followed by China and Europe collectively holding about 5%. This distribution reflects regional investments in grid-scale energy storage and differing renewable energy adoption rates. New membrane development programs in Asia show potential for market diversification.

Supply Chain Consolidation

The market exhibits high concentration with the top companies controlling approximately 90% of global supply. Chemours (formerly DuPont) leads the sector, with specialized manufacturers like FuMa-Tech and Golden Energy Fuel Cell expanding their production capacities to meet growing demand for Ion Exchange Membranes in flow battery applications.

Application-Specific Growth Patterns

Large-Scale Energy Storage accounts for the majority of membrane demand (over 75%), with Industrial Grid Adjustment applications showing the strongest growth potential. As utilities increasingly deploy VRFB systems for renewable energy integration, the need for high-performance Ion Exchange Membranes will continue rising proportionally.

COMPETITIVE LANDSCAPE

Key Industry Players

Global ion exchange membrane market for VRB systems is dominated by fluoropolymer specialists

The Chemours Company (formerly DuPont) holds approximately 90% market share in the ion exchange membrane segment for vanadium redox flow batteries, with its Nafion perfluorinated membranes being the industry standard. Their technological leadership in fluoropolymer chemistry and extensive patent portfolio create high barriers to entry. The market structure remains highly concentrated due to the specialized expertise required for membrane production.

Several emerging players are developing alternative membrane technologies to compete with fluorinated options. FuMa-Tech offers cost-effective hydrocarbon-based membranes, while Golden Energy Fuel Cell focuses on composite membrane solutions. Research institutions like Dalian Institute of Chemical Physics are advancing next-generation membrane materials with improved ion selectivity and chemical stability.

List of Key Ion Exchange Membrane Companies Profiled

  • Chemours Company
  • FuMa-Tech GmbH
  • Golden Energy Fuel Cell Co., Ltd.
  • Dalian Institute of Chemical Physics
  • AGC Chemicals
  • Solvay SA
  • W. L. Gore & Associates
  • Shanghai Shangfluor New Material Technology
  • Ionomr Innovations Inc.
  • Fujifilm Holdings Corporation
  • Toyobo Co., Ltd.
  • Sumitomo Chemical Co., Ltd.
  • 3M Company
  • Asahi Kasei Corporation
  • Toray Industries, Inc.

Segment Analysis:

Segment Category Sub-Segments Key Insights
By Type
  • Full-fluorinion Ion Exchange Membrane
  • Non-fluorinion Ion Exchange Membrane
  • Others
Full-fluorinion Ion Exchange Membrane dominates due to superior chemical stability and proton conductivity in harsh acidic environments.

  • Offers exceptional durability against vanadium ion crossover, extending battery lifespan
  • Higher manufacturing cost offset by long-term performance benefits in commercial installations
  • Preferred for grid-scale applications where reliability is critical
By Application
  • Large-Scale Energy Storage
  • Industrial Grid Adjustment and Management
  • Others
Large-Scale Energy Storage drives demand with growing renewable energy integration needs.

  • Critical for stabilizing power grids with intermittent renewable sources like wind and solar
  • Enables multi-hour discharge cycles required for utility-scale applications
  • Scalability advantages make it preferable for megawatt-level installations
By End User
  • Utilities
  • Industrial Facilities
  • Research Institutions
Utilities represent the core adoption channel for ion exchange membranes.

  • Increasing grid modernization projects globally create sustained demand
  • Favorable regulatory policies in North America and Europe accelerate adoption
  • Seeking long-duration storage solutions beyond lithium-ion capabilities
By Chemical Composition
  • Sulfonated Membranes
  • Carboxylated Membranes
  • Composite Membranes
Sulfonated Membranes lead with optimal performance characteristics.

  • Provide excellent proton conductivity while maintaining mechanical strength
  • Widely adopted in commercial VRB systems for balanced performance
  • Ongoing R&D focuses on reducing swelling issues during operation
By Membrane Thickness
  • Thin (≤100μm)
  • Standard (100-200μm)
  • Thick (≥200μm)
Standard Thickness Membranes offer the best compromise for most applications.

  • Balances ion selectivity with mechanical durability in long-term cycling
  • Minimizes crossover while maintaining acceptable proton conductivity
  • Most cost-effective solution for commercial-scale deployments

Regional Analysis: Asia-Pacific Ion Exchange Membrane for All-Vanadium Redox Flow Battery Market

China

China dominates the Asia-Pacific ion exchange membrane market for vanadium redox flow batteries, driven by massive investments in renewable energy storage. The government’s strong policy support and growing demand for large-scale energy storage solutions fuel market growth. Chinese manufacturers lead in cost-effective membrane production, supported by established supply chains for vanadium electrolyte systems. Key industrial zones in Shanghai and Guangdong are becoming innovation hubs for advanced membrane technologies. The market benefits from synergies with China’s world-leading vanadium production capabilities and extensive deployment of flow battery projects for grid stabilization. Local players are making significant R&D breakthroughs in membrane durability and proton conductivity.

Policy & Regulation Advantages
China’s National Energy Administration mandates encourage vanadium flow battery adoption through subsidies and renewable integration policies, creating favorable conditions for ion exchange membrane manufacturers.
Manufacturing Ecosystem
Concentrated industrial clusters in Dalian and Sichuan provide complete supply chains from raw materials to finished membranes, enabling competitive production costs and rapid technology iteration cycles.
Technology Development
Chinese research institutions are pioneering hybrid membrane designs combining perfluorinated and hydrocarbon materials to balance cost and performance for utility-scale applications.
Market Expansion
Strategic partnerships between membrane producers and battery system integrators are accelerating commercial deployments, particularly in renewable microgrid projects across western provinces.

Japan & South Korea
Japan and South Korea represent advanced markets for high-performance ion exchange membranes, with strong emphasis on quality and durability. Japanese manufacturers focus on premium perfluorinated membranes for long-duration storage, while Korean companies excel in cost-optimized solutions. Both countries benefit from established automotive and electronics industries that provide technical expertise in precision membrane manufacturing. Government-funded demonstration projects are driving adoption in commercial and industrial energy storage applications.

India & Southeast Asia
Emerging markets in India and Southeast Asia show growing potential for vanadium flow battery membranes as renewable energy penetration increases. India’s ambitious energy storage targets are creating new opportunities, though local membrane production remains limited. Southeast Asian nations are adopting Chinese membrane technologies through strategic partnerships, with Thailand and Malaysia developing pilot projects for grid stability applications.

Australia & New Zealand
The Oceania region demonstrates strong interest in vanadium flow batteries for remote area power systems and mining operations. Australian research institutions are collaborating with membrane manufacturers to develop customized solutions for harsh environmental conditions. New Zealand’s focus on renewable integration drives demand for membranes with high cycling stability.

Rest of Asia-Pacific
Other Asia-Pacific markets are gradually adopting vanadium flow battery technology, with early-stage deployments in Taiwan and Bangladesh. These regions typically import membranes from established producers while developing local testing and integration capabilities. Pilot projects demonstrate potential for off-grid and microgrid applications using ion exchange membrane technology.

Report Scope

This market research report provides a comprehensive analysis of the Ion Exchange Membrane of All-Vanadium Redox Flow Battery Market , covering the forecast period 2025–2033. It offers detailed insights into market dynamics, technological advancements, competitive landscape, and key trends shaping the industry.

Key focus areas of the report include:

  • Market Overview: The report begins with an overview outlining its current market scenario, key growth indicators, and industry transformation drivers. It discusses macroeconomic factors, demand–supply balance, regulatory landscape, and the strategic role of ion exchange membranes in energy storage solutions across industries such as renewable energy, industrial grid management, and large-scale energy storage.
  • Market Size & Forecast: Historical data and future projections for revenue, unit shipments, and market value across major regions and segments.
  • Segmentation Analysis: Detailed breakdown by product type, technology, application, and end-user industry to identify high-growth segments and investment opportunities.
  • Regional Insights: Insights into market performance across North America, Europe, Asia-Pacific, Latin America, and the Middle East & Africa, including country-level analysis where relevant.
  • Competitive Landscape: Profiles of leading market participants, including their product offerings, R&D focus, manufacturing capacity, pricing strategies, and recent developments such as mergers, acquisitions, and partnerships.
  • Technology Trends & Innovation: Assessment of emerging technologies in flow battery systems, membrane materials, and evolving industry standards.
  • Market Drivers & Restraints: Evaluation of factors driving market growth along with challenges, supply chain constraints, regulatory issues, and market-entry barriers.
  • Stakeholder Insights: Insights for component suppliers, OEMs, system integrators, investors, and policymakers regarding the evolving ecosystem and strategic opportunities.

Primary and secondary research methods are employed, including interviews with industry experts, data from verified sources, and real-time market intelligence to ensure the accuracy and reliability of the insights presented.

FREQUENTLY ASKED QUESTIONS:

What is the current market size of Ion Exchange Membrane of All-Vanadium Redox Flow Battery Market?

-> Ion Exchange Membrane of All-Vanadium Redox Flow Battery Market was valued at USD 27.1 million in 2025. The market is projected to grow from USD 32.5 million in 2026 to USD 97 million by 2033, exhibiting a CAGR of 20.6% during the forecast period.

Which key companies operate in Ion Exchange Membrane of All-Vanadium Redox Flow Battery Market?

-> Key players include Chemours Company, FuMa-Tech, Golden Energy Fuel Cell, and Dalian Institute of Chemical Physics, among others. The top player holds about 90% market share.

What are the key growth drivers?

-> Key growth drivers include increasing demand for large-scale energy storage solutions, growth in renewable energy adoption, and advancements in flow battery technology.

Which region dominates the market?

-> North America is the largest market with about 90% share, followed by China and Europe with a combined 5% share.

What is the largest product segment?

-> Full-fluorinion Ion Exchange Membrane dominates with about 60% market share, followed by Non-fluorinion Ion Exchange Membrane.

What are the major applications?

-> Large-Scale Energy Storage is the largest application segment, followed by Industrial Grid Adjustment and Management.

Ion Exchange Membrane of All-Vanadium Redox Flow Battery Market, Global Business Strategies 2026-2033

Get Sample Report PDF for Exclusive Insights

Report Sample Includes

  • Table of Contents
  • List of Tables & Figures
  • Charts, Research Methodology, and more...
PDF Icon Download Sample Report PDF
License Type

Corporate License, Excel License, PDF and Excel Databook License

Download Sample Report

Table of Content

1 Introduction to Research & Analysis Reports
1.1 Ion Exchange Membrane of All-Vanadium Redox Flow Battery Market Definition
1.2 Market Segments
1.2.1 Segment by Type
1.2.2 Segment by Application
1.3 Global Ion Exchange Membrane of All-Vanadium Redox Flow Battery Market Overview
1.4 Features & Benefits of This Report
1.5 Methodology & Sources of Information
1.5.1 Research Methodology
1.5.2 Research Process
1.5.3 Base Year
1.5.4 Report Assumptions & Caveats
2 Global Ion Exchange Membrane of All-Vanadium Redox Flow Battery Overall Market Size
2.1 Global Ion Exchange Membrane of All-Vanadium Redox Flow Battery Market Size: 2024 VS 2032
2.2 Global Ion Exchange Membrane of All-Vanadium Redox Flow Battery Market Size, Prospects & Forecasts: 2020-2032
2.3 Global Ion Exchange Membrane of All-Vanadium Redox Flow Battery Sales: 2020-2032
3 Company Landscape
3.1 Top Ion Exchange Membrane of All-Vanadium Redox Flow Battery Players in Global Market
3.2 Top Global Ion Exchange Membrane of All-Vanadium Redox Flow Battery Companies Ranked by Revenue
3.3 Global Ion Exchange Membrane of All-Vanadium Redox Flow Battery Revenue by Companies
3.4 Global Ion Exchange Membrane of All-Vanadium Redox Flow Battery Sales by Companies
3.5 Global Ion Exchange Membrane of All-Vanadium Redox Flow Battery Price by Manufacturer (2020-2025)
3.6 Top 3 and Top 5 Ion Exchange Membrane of All-Vanadium Redox Flow Battery Companies in Global Market, by Revenue in 2024
3.7 Global Manufacturers Ion Exchange Membrane of All-Vanadium Redox Flow Battery Product Type
3.8 Tier 1, Tier 2, and Tier 3 Ion Exchange Membrane of All-Vanadium Redox Flow Battery Players in Global Market
3.8.1 List of Global Tier 1 Ion Exchange Membrane of All-Vanadium Redox Flow Battery Companies
3.8.2 List of Global Tier 2 and Tier 3 Ion Exchange Membrane of All-Vanadium Redox Flow Battery Companies
4 Sights by Product
4.1 Overview
4.1.1 Segment by Type – Global Ion Exchange Membrane of All-Vanadium Redox Flow Battery Market Size Markets, 2024 & 2032
4.1.2 Full-fluorinion Ion Exchange Membrane
4.1.3 Non-fluorinion Ion Exchange Membrane
4.1.4 Others
4.2 Segment by Type – Global Ion Exchange Membrane of All-Vanadium Redox Flow Battery Revenue & Forecasts
4.2.1 Segment by Type – Global Ion Exchange Membrane of All-Vanadium Redox Flow Battery Revenue, 2020-2025
4.2.2 Segment by Type – Global Ion Exchange Membrane of All-Vanadium Redox Flow Battery Revenue, 2026-2032
4.2.3 Segment by Type – Global Ion Exchange Membrane of All-Vanadium Redox Flow Battery Revenue Market Share, 2020-2032
4.3 Segment by Type – Global Ion Exchange Membrane of All-Vanadium Redox Flow Battery Sales & Forecasts
4.3.1 Segment by Type – Global Ion Exchange Membrane of All-Vanadium Redox Flow Battery Sales, 2020-2025
4.3.2 Segment by Type – Global Ion Exchange Membrane of All-Vanadium Redox Flow Battery Sales, 2026-2032
4.3.3 Segment by Type – Global Ion Exchange Membrane of All-Vanadium Redox Flow Battery Sales Market Share, 2020-2032
4.4 Segment by Type – Global Ion Exchange Membrane of All-Vanadium Redox Flow Battery Price (Manufacturers Selling Prices), 2020-2032
5 Sights by Application
5.1 Overview
5.1.1 Segment by Application – Global Ion Exchange Membrane of All-Vanadium Redox Flow Battery Market Size, 2024 & 2032
5.1.2 Large-Scale Energy Storage
5.1.3 Industrial Grid Adjustment and Management
5.1.4 Others
5.2 Segment by Application – Global Ion Exchange Membrane of All-Vanadium Redox Flow Battery Revenue & Forecasts
5.2.1 Segment by Application – Global Ion Exchange Membrane of All-Vanadium Redox Flow Battery Revenue, 2020-2025
5.2.2 Segment by Application – Global Ion Exchange Membrane of All-Vanadium Redox Flow Battery Revenue, 2026-2032
5.2.3 Segment by Application – Global Ion Exchange Membrane of All-Vanadium Redox Flow Battery Revenue Market Share, 2020-2032
5.3 Segment by Application – Global Ion Exchange Membrane of All-Vanadium Redox Flow Battery Sales & Forecasts
5.3.1 Segment by Application – Global Ion Exchange Membrane of All-Vanadium Redox Flow Battery Sales, 2020-2025
5.3.2 Segment by Application – Global Ion Exchange Membrane of All-Vanadium Redox Flow Battery Sales, 2026-2032
5.3.3 Segment by Application – Global Ion Exchange Membrane of All-Vanadium Redox Flow Battery Sales Market Share, 2020-2032
5.4 Segment by Application – Global Ion Exchange Membrane of All-Vanadium Redox Flow Battery Price (Manufacturers Selling Prices), 2020-2032
6 Sights by Region
6.1 By Region – Global Ion Exchange Membrane of All-Vanadium Redox Flow Battery Market Size, 2024 & 2032
6.2 By Region – Global Ion Exchange Membrane of All-Vanadium Redox Flow Battery Revenue & Forecasts
6.2.1 By Region – Global Ion Exchange Membrane of All-Vanadium Redox Flow Battery Revenue, 2020-2025
6.2.2 By Region – Global Ion Exchange Membrane of All-Vanadium Redox Flow Battery Revenue, 2026-2032
6.2.3 By Region – Global Ion Exchange Membrane of All-Vanadium Redox Flow Battery Revenue Market Share, 2020-2032
6.3 By Region – Global Ion Exchange Membrane of All-Vanadium Redox Flow Battery Sales & Forecasts
6.3.1 By Region – Global Ion Exchange Membrane of All-Vanadium Redox Flow Battery Sales, 2020-2025
6.3.2 By Region – Global Ion Exchange Membrane of All-Vanadium Redox Flow Battery Sales, 2026-2032
6.3.3 By Region – Global Ion Exchange Membrane of All-Vanadium Redox Flow Battery Sales Market Share, 2020-2032
6.4 North America
6.4.1 By Country – North America Ion Exchange Membrane of All-Vanadium Redox Flow Battery Revenue, 2020-2032
6.4.2 By Country – North America Ion Exchange Membrane of All-Vanadium Redox Flow Battery Sales, 2020-2032
6.4.3 United States Ion Exchange Membrane of All-Vanadium Redox Flow Battery Market Size, 2020-2032
6.4.4 Canada Ion Exchange Membrane of All-Vanadium Redox Flow Battery Market Size, 2020-2032
6.4.5 Mexico Ion Exchange Membrane of All-Vanadium Redox Flow Battery Market Size, 2020-2032
6.5 Europe
6.5.1 By Country – Europe Ion Exchange Membrane of All-Vanadium Redox Flow Battery Revenue, 2020-2032
6.5.2 By Country – Europe Ion Exchange Membrane of All-Vanadium Redox Flow Battery Sales, 2020-2032
6.5.3 Germany Ion Exchange Membrane of All-Vanadium Redox Flow Battery Market Size, 2020-2032
6.5.4 France Ion Exchange Membrane of All-Vanadium Redox Flow Battery Market Size, 2020-2032
6.5.5 U.K. Ion Exchange Membrane of All-Vanadium Redox Flow Battery Market Size, 2020-2032
6.5.6 Italy Ion Exchange Membrane of All-Vanadium Redox Flow Battery Market Size, 2020-2032
6.5.7 Russia Ion Exchange Membrane of All-Vanadium Redox Flow Battery Market Size, 2020-2032
6.5.8 Nordic Countries Ion Exchange Membrane of All-Vanadium Redox Flow Battery Market Size, 2020-2032
6.5.9 Benelux Ion Exchange Membrane of All-Vanadium Redox Flow Battery Market Size, 2020-2032
6.6 Asia
6.6.1 By Region – Asia Ion Exchange Membrane of All-Vanadium Redox Flow Battery Revenue, 2020-2032
6.6.2 By Region – Asia Ion Exchange Membrane of All-Vanadium Redox Flow Battery Sales, 2020-2032
6.6.3 China Ion Exchange Membrane of All-Vanadium Redox Flow Battery Market Size, 2020-2032
6.6.4 Japan Ion Exchange Membrane of All-Vanadium Redox Flow Battery Market Size, 2020-2032
6.6.5 South Korea Ion Exchange Membrane of All-Vanadium Redox Flow Battery Market Size, 2020-2032
6.6.6 Southeast Asia Ion Exchange Membrane of All-Vanadium Redox Flow Battery Market Size, 2020-2032
6.6.7 India Ion Exchange Membrane of All-Vanadium Redox Flow Battery Market Size, 2020-2032
6.7 South America
6.7.1 By Country – South America Ion Exchange Membrane of All-Vanadium Redox Flow Battery Revenue, 2020-2032
6.7.2 By Country – South America Ion Exchange Membrane of All-Vanadium Redox Flow Battery Sales, 2020-2032
6.7.3 Brazil Ion Exchange Membrane of All-Vanadium Redox Flow Battery Market Size, 2020-2032
6.7.4 Argentina Ion Exchange Membrane of All-Vanadium Redox Flow Battery Market Size, 2020-2032
6.8 Middle East & Africa
6.8.1 By Country – Middle East & Africa Ion Exchange Membrane of All-Vanadium Redox Flow Battery Revenue, 2020-2032
6.8.2 By Country – Middle East & Africa Ion Exchange Membrane of All-Vanadium Redox Flow Battery Sales, 2020-2032
6.8.3 Turkey Ion Exchange Membrane of All-Vanadium Redox Flow Battery Market Size, 2020-2032
6.8.4 Israel Ion Exchange Membrane of All-Vanadium Redox Flow Battery Market Size, 2020-2032
6.8.5 Saudi Arabia Ion Exchange Membrane of All-Vanadium Redox Flow Battery Market Size, 2020-2032
6.8.6 UAE Ion Exchange Membrane of All-Vanadium Redox Flow Battery Market Size, 2020-2032
7 Manufacturers & Brands Profiles
7.1 Chemours Company
7.1.1 Chemours Company Company Summary
7.1.2 Chemours Company Business Overview
7.1.3 Chemours Company Ion Exchange Membrane of All-Vanadium Redox Flow Battery Major Product Offerings
7.1.4 Chemours Company Ion Exchange Membrane of All-Vanadium Redox Flow Battery Sales and Revenue in Global (2020-2025)
7.1.5 Chemours Company Key News & Latest Developments
7.2 FuMa-Tech
7.2.1 FuMa-Tech Company Summary
7.2.2 FuMa-Tech Business Overview
7.2.3 FuMa-Tech Ion Exchange Membrane of All-Vanadium Redox Flow Battery Major Product Offerings
7.2.4 FuMa-Tech Ion Exchange Membrane of All-Vanadium Redox Flow Battery Sales and Revenue in Global (2020-2025)
7.2.5 FuMa-Tech Key News & Latest Developments
7.3 Golden Energy Fuel Cell
7.3.1 Golden Energy Fuel Cell Company Summary
7.3.2 Golden Energy Fuel Cell Business Overview
7.3.3 Golden Energy Fuel Cell Ion Exchange Membrane of All-Vanadium Redox Flow Battery Major Product Offerings
7.3.4 Golden Energy Fuel Cell Ion Exchange Membrane of All-Vanadium Redox Flow Battery Sales and Revenue in Global (2020-2025)
7.3.5 Golden Energy Fuel Cell Key News & Latest Developments
7.4 Dalian Institute of Chemical Physics
7.4.1 Dalian Institute of Chemical Physics Company Summary
7.4.2 Dalian Institute of Chemical Physics Business Overview
7.4.3 Dalian Institute of Chemical Physics Ion Exchange Membrane of All-Vanadium Redox Flow Battery Major Product Offerings
7.4.4 Dalian Institute of Chemical Physics Ion Exchange Membrane of All-Vanadium Redox Flow Battery Sales and Revenue in Global (2020-2025)
7.4.5 Dalian Institute of Chemical Physics Key News & Latest Developments
8 Global Ion Exchange Membrane of All-Vanadium Redox Flow Battery Production Capacity, Analysis
8.1 Global Ion Exchange Membrane of All-Vanadium Redox Flow Battery Production Capacity, 2020-2032
8.2 Ion Exchange Membrane of All-Vanadium Redox Flow Battery Production Capacity of Key Manufacturers in Global Market
8.3 Global Ion Exchange Membrane of All-Vanadium Redox Flow Battery Production by Region
9 Key Market Trends, Opportunity, Drivers and Restraints
9.1 Market Opportunities & Trends
9.2 Market Drivers
9.3 Market Restraints
10 Ion Exchange Membrane of All-Vanadium Redox Flow Battery Supply Chain Analysis
10.1 Ion Exchange Membrane of All-Vanadium Redox Flow Battery Industry Value Chain
10.2 Ion Exchange Membrane of All-Vanadium Redox Flow Battery Upstream Market
10.3 Ion Exchange Membrane of All-Vanadium Redox Flow Battery Downstream and Clients
10.4 Marketing Channels Analysis
10.4.1 Marketing Channels
10.4.2 Ion Exchange Membrane of All-Vanadium Redox Flow Battery Distributors and Sales Agents in Global
11 Conclusion
12 Appendix
12.1 Note
12.2 Examples of Clients
12.3 DisclaimerList of Tables
Table 1. Key Players of Ion Exchange Membrane of All-Vanadium Redox Flow Battery in Global Market
Table 2. Top Ion Exchange Membrane of All-Vanadium Redox Flow Battery Players in Global Market, Ranking by Revenue (2024)
Table 3. Global Ion Exchange Membrane of All-Vanadium Redox Flow Battery Revenue by Companies, (US$, Mn), 2020-2025
Table 4. Global Ion Exchange Membrane of All-Vanadium Redox Flow Battery Revenue Share by Companies, 2020-2025
Table 5. Global Ion Exchange Membrane of All-Vanadium Redox Flow Battery Sales by Companies, (Sqm), 2020-2025
Table 6. Global Ion Exchange Membrane of All-Vanadium Redox Flow Battery Sales Share by Companies, 2020-2025
Table 7. Key Manufacturers Ion Exchange Membrane of All-Vanadium Redox Flow Battery Price (2020-2025) & (USD/sqm)
Table 8. Global Manufacturers Ion Exchange Membrane of All-Vanadium Redox Flow Battery Product Type
Table 9. List of Global Tier 1 Ion Exchange Membrane of All-Vanadium Redox Flow Battery Companies, Revenue (US$, Mn) in 2024 and Market Share
Table 10. List of Global Tier 2 and Tier 3 Ion Exchange Membrane of All-Vanadium Redox Flow Battery Companies, Revenue (US$, Mn) in 2024 and Market Share
Table 11. Segment by Type – Global Ion Exchange Membrane of All-Vanadium Redox Flow Battery Revenue, (US$, Mn), 2024 & 2032
Table 12. Segment by Type – Global Ion Exchange Membrane of All-Vanadium Redox Flow Battery Revenue (US$, Mn), 2020-2025
Table 13. Segment by Type – Global Ion Exchange Membrane of All-Vanadium Redox Flow Battery Revenue (US$, Mn), 2026-2032
Table 14. Segment by Type – Global Ion Exchange Membrane of All-Vanadium Redox Flow Battery Sales (Sqm), 2020-2025
Table 15. Segment by Type – Global Ion Exchange Membrane of All-Vanadium Redox Flow Battery Sales (Sqm), 2026-2032
Table 16. Segment by Application – Global Ion Exchange Membrane of All-Vanadium Redox Flow Battery Revenue, (US$, Mn), 2024 & 2032
Table 17. Segment by Application – Global Ion Exchange Membrane of All-Vanadium Redox Flow Battery Revenue, (US$, Mn), 2020-2025
Table 18. Segment by Application – Global Ion Exchange Membrane of All-Vanadium Redox Flow Battery Revenue, (US$, Mn), 2026-2032
Table 19. Segment by Application – Global Ion Exchange Membrane of All-Vanadium Redox Flow Battery Sales, (Sqm), 2020-2025
Table 20. Segment by Application – Global Ion Exchange Membrane of All-Vanadium Redox Flow Battery Sales, (Sqm), 2026-2032
Table 21. By Region – Global Ion Exchange Membrane of All-Vanadium Redox Flow Battery Revenue, (US$, Mn), 2025-2032
Table 22. By Region – Global Ion Exchange Membrane of All-Vanadium Redox Flow Battery Revenue, (US$, Mn), 2020-2025
Table 23. By Region – Global Ion Exchange Membrane of All-Vanadium Redox Flow Battery Revenue, (US$, Mn), 2026-2032
Table 24. By Region – Global Ion Exchange Membrane of All-Vanadium Redox Flow Battery Sales, (Sqm), 2020-2025
Table 25. By Region – Global Ion Exchange Membrane of All-Vanadium Redox Flow Battery Sales, (Sqm), 2026-2032
Table 26. By Country – North America Ion Exchange Membrane of All-Vanadium Redox Flow Battery Revenue, (US$, Mn), 2020-2025
Table 27. By Country – North America Ion Exchange Membrane of All-Vanadium Redox Flow Battery Revenue, (US$, Mn), 2026-2032
Table 28. By Country – North America Ion Exchange Membrane of All-Vanadium Redox Flow Battery Sales, (Sqm), 2020-2025
Table 29. By Country – North America Ion Exchange Membrane of All-Vanadium Redox Flow Battery Sales, (Sqm), 2026-2032
Table 30. By Country – Europe Ion Exchange Membrane of All-Vanadium Redox Flow Battery Revenue, (US$, Mn), 2020-2025
Table 31. By Country – Europe Ion Exchange Membrane of All-Vanadium Redox Flow Battery Revenue, (US$, Mn), 2026-2032
Table 32. By Country – Europe Ion Exchange Membrane of All-Vanadium Redox Flow Battery Sales, (Sqm), 2020-2025
Table 33. By Country – Europe Ion Exchange Membrane of All-Vanadium Redox Flow Battery Sales, (Sqm), 2026-2032
Table 34. By Region – Asia Ion Exchange Membrane of All-Vanadium Redox Flow Battery Revenue, (US$, Mn), 2020-2025
Table 35. By Region – Asia Ion Exchange Membrane of All-Vanadium Redox Flow Battery Revenue, (US$, Mn), 2026-2032
Table 36. By Region – Asia Ion Exchange Membrane of All-Vanadium Redox Flow Battery Sales, (Sqm), 2020-2025
Table 37. By Region – Asia Ion Exchange Membrane of All-Vanadium Redox Flow Battery Sales, (Sqm), 2026-2032
Table 38. By Country – South America Ion Exchange Membrane of All-Vanadium Redox Flow Battery Revenue, (US$, Mn), 2020-2025
Table 39. By Country – South America Ion Exchange Membrane of All-Vanadium Redox Flow Battery Revenue, (US$, Mn), 2026-2032
Table 40. By Country – South America Ion Exchange Membrane of All-Vanadium Redox Flow Battery Sales, (Sqm), 2020-2025
Table 41. By Country – South America Ion Exchange Membrane of All-Vanadium Redox Flow Battery Sales, (Sqm), 2026-2032
Table 42. By Country – Middle East & Africa Ion Exchange Membrane of All-Vanadium Redox Flow Battery Revenue, (US$, Mn), 2020-2025
Table 43. By Country – Middle East & Africa Ion Exchange Membrane of All-Vanadium Redox Flow Battery Revenue, (US$, Mn), 2026-2032
Table 44. By Country – Middle East & Africa Ion Exchange Membrane of All-Vanadium Redox Flow Battery Sales, (Sqm), 2020-2025
Table 45. By Country – Middle East & Africa Ion Exchange Membrane of All-Vanadium Redox Flow Battery Sales, (Sqm), 2026-2032
Table 46. Chemours Company Company Summary
Table 47. Chemours Company Ion Exchange Membrane of All-Vanadium Redox Flow Battery Product Offerings
Table 48. Chemours Company Ion Exchange Membrane of All-Vanadium Redox Flow Battery Sales (Sqm), Revenue (US$, Mn) and Average Price (USD/sqm) & (2020-2025)
Table 49. Chemours Company Key News & Latest Developments
Table 50. FuMa-Tech Company Summary
Table 51. FuMa-Tech Ion Exchange Membrane of All-Vanadium Redox Flow Battery Product Offerings
Table 52. FuMa-Tech Ion Exchange Membrane of All-Vanadium Redox Flow Battery Sales (Sqm), Revenue (US$, Mn) and Average Price (USD/sqm) & (2020-2025)
Table 53. FuMa-Tech Key News & Latest Developments
Table 54. Golden Energy Fuel Cell Company Summary
Table 55. Golden Energy Fuel Cell Ion Exchange Membrane of All-Vanadium Redox Flow Battery Product Offerings
Table 56. Golden Energy Fuel Cell Ion Exchange Membrane of All-Vanadium Redox Flow Battery Sales (Sqm), Revenue (US$, Mn) and Average Price (USD/sqm) & (2020-2025)
Table 57. Golden Energy Fuel Cell Key News & Latest Developments
Table 58. Dalian Institute of Chemical Physics Company Summary
Table 59. Dalian Institute of Chemical Physics Ion Exchange Membrane of All-Vanadium Redox Flow Battery Product Offerings
Table 60. Dalian Institute of Chemical Physics Ion Exchange Membrane of All-Vanadium Redox Flow Battery Sales (Sqm), Revenue (US$, Mn) and Average Price (USD/sqm) & (2020-2025)
Table 61. Dalian Institute of Chemical Physics Key News & Latest Developments
Table 62. Ion Exchange Membrane of All-Vanadium Redox Flow Battery Capacity of Key Manufacturers in Global Market, 2023-2025 (Sqm)
Table 63. Global Ion Exchange Membrane of All-Vanadium Redox Flow Battery Capacity Market Share of Key Manufacturers, 2023-2025
Table 64. Global Ion Exchange Membrane of All-Vanadium Redox Flow Battery Production by Region, 2020-2025 (Sqm)
Table 65. Global Ion Exchange Membrane of All-Vanadium Redox Flow Battery Production by Region, 2026-2032 (Sqm)
Table 66. Ion Exchange Membrane of All-Vanadium Redox Flow Battery Market Opportunities & Trends in Global Market
Table 67. Ion Exchange Membrane of All-Vanadium Redox Flow Battery Market Drivers in Global Market
Table 68. Ion Exchange Membrane of All-Vanadium Redox Flow Battery Market Restraints in Global Market
Table 69. Ion Exchange Membrane of All-Vanadium Redox Flow Battery Raw Materials
Table 70. Ion Exchange Membrane of All-Vanadium Redox Flow Battery Raw Materials Suppliers in Global Market
Table 71. Typical Ion Exchange Membrane of All-Vanadium Redox Flow Battery Downstream
Table 72. Ion Exchange Membrane of All-Vanadium Redox Flow Battery Downstream Clients in Global Market
Table 73. Ion Exchange Membrane of All-Vanadium Redox Flow Battery Distributors and Sales Agents in Global Market

List of Figures
Figure 1. Ion Exchange Membrane of All-Vanadium Redox Flow Battery Product Picture
Figure 2. Ion Exchange Membrane of All-Vanadium Redox Flow Battery Segment by Type in 2024
Figure 3. Ion Exchange Membrane of All-Vanadium Redox Flow Battery Segment by Application in 2024
Figure 4. Global Ion Exchange Membrane of All-Vanadium Redox Flow Battery Market Overview: 2024
Figure 5. Key Caveats
Figure 6. Global Ion Exchange Membrane of All-Vanadium Redox Flow Battery Market Size: 2024 VS 2032 (US$, Mn)
Figure 7. Global Ion Exchange Membrane of All-Vanadium Redox Flow Battery Revenue: 2020-2032 (US$, Mn)
Figure 8. Ion Exchange Membrane of All-Vanadium Redox Flow Battery Sales in Global Market: 2020-2032 (Sqm)
Figure 9. The Top 3 and 5 Players Market Share by Ion Exchange Membrane of All-Vanadium Redox Flow Battery Revenue in 2024
Figure 10. Segment by Type – Global Ion Exchange Membrane of All-Vanadium Redox Flow Battery Revenue, (US$, Mn), 2024 & 2032
Figure 11. Segment by Type – Global Ion Exchange Membrane of All-Vanadium Redox Flow Battery Revenue Market Share, 2020-2032
Figure 12. Segment by Type – Global Ion Exchange Membrane of All-Vanadium Redox Flow Battery Sales Market Share, 2020-2032
Figure 13. Segment by Type – Global Ion Exchange Membrane of All-Vanadium Redox Flow Battery Price (USD/sqm), 2020-2032
Figure 14. Segment by Application – Global Ion Exchange Membrane of All-Vanadium Redox Flow Battery Revenue, (US$, Mn), 2024 & 2032
Figure 15. Segment by Application – Global Ion Exchange Membrane of All-Vanadium Redox Flow Battery Revenue Market Share, 2020-2032
Figure 16. Segment by Application – Global Ion Exchange Membrane of All-Vanadium Redox Flow Battery Sales Market Share, 2020-2032
Figure 17. Segment by Application -Global Ion Exchange Membrane of All-Vanadium Redox Flow Battery Price (USD/sqm), 2020-2032
Figure 18. By Region – Global Ion Exchange Membrane of All-Vanadium Redox Flow Battery Revenue, (US$, Mn), 2025 & 2032
Figure 19. By Region – Global Ion Exchange Membrane of All-Vanadium Redox Flow Battery Revenue Market Share, 2020 VS 2024 VS 2032
Figure 20. By Region – Global Ion Exchange Membrane of All-Vanadium Redox Flow Battery Revenue Market Share, 2020-2032
Figure 21. By Region – Global Ion Exchange Membrane of All-Vanadium Redox Flow Battery Sales Market Share, 2020-2032
Figure 22. By Country – North America Ion Exchange Membrane of All-Vanadium Redox Flow Battery Revenue Market Share, 2020-2032
Figure 23. By Country – North America Ion Exchange Membrane of All-Vanadium Redox Flow Battery Sales Market Share, 2020-2032
Figure 24. United States Ion Exchange Membrane of All-Vanadium Redox Flow Battery Revenue, (US$, Mn), 2020-2032
Figure 25. Canada Ion Exchange Membrane of All-Vanadium Redox Flow Battery Revenue, (US$, Mn), 2020-2032
Figure 26. Mexico Ion Exchange Membrane of All-Vanadium Redox Flow Battery Revenue, (US$, Mn), 2020-2032
Figure 27. By Country – Europe Ion Exchange Membrane of All-Vanadium Redox Flow Battery Revenue Market Share, 2020-2032
Figure 28. By Country – Europe Ion Exchange Membrane of All-Vanadium Redox Flow Battery Sales Market Share, 2020-2032
Figure 29. Germany Ion Exchange Membrane of All-Vanadium Redox Flow Battery Revenue, (US$, Mn), 2020-2032
Figure 30. France Ion Exchange Membrane of All-Vanadium Redox Flow Battery Revenue, (US$, Mn), 2020-2032
Figure 31. U.K. Ion Exchange Membrane of All-Vanadium Redox Flow Battery Revenue, (US$, Mn), 2020-2032
Figure 32. Italy Ion Exchange Membrane of All-Vanadium Redox Flow Battery Revenue, (US$, Mn), 2020-2032
Figure 33. Russia Ion Exchange Membrane of All-Vanadium Redox Flow Battery Revenue, (US$, Mn), 2020-2032
Figure 34. Nordic Countries Ion Exchange Membrane of All-Vanadium Redox Flow Battery Revenue, (US$, Mn), 2020-2032
Figure 35. Benelux Ion Exchange Membrane of All-Vanadium Redox Flow Battery Revenue, (US$, Mn), 2020-2032
Figure 36. By Region – Asia Ion Exchange Membrane of All-Vanadium Redox Flow Battery Revenue Market Share, 2020-2032
Figure 37. By Region – Asia Ion Exchange Membrane of All-Vanadium Redox Flow Battery Sales Market Share, 2020-2032
Figure 38. China Ion Exchange Membrane of All-Vanadium Redox Flow Battery Revenue, (US$, Mn), 2020-2032
Figure 39. Japan Ion Exchange Membrane of All-Vanadium Redox Flow Battery Revenue, (US$, Mn), 2020-2032
Figure 40. South Korea Ion Exchange Membrane of All-Vanadium Redox Flow Battery Revenue, (US$, Mn), 2020-2032
Figure 41. Southeast Asia Ion Exchange Membrane of All-Vanadium Redox Flow Battery Revenue, (US$, Mn), 2020-2032
Figure 42. India Ion Exchange Membrane of All-Vanadium Redox Flow Battery Revenue, (US$, Mn), 2020-2032
Figure 43. By Country – South America Ion Exchange Membrane of All-Vanadium Redox Flow Battery Revenue Market Share, 2020-2032
Figure 44. By Country – South America Ion Exchange Membrane of All-Vanadium Redox Flow Battery Sales, Market Share, 2020-2032
Figure 45. Brazil Ion Exchange Membrane of All-Vanadium Redox Flow Battery Revenue, (US$, Mn), 2020-2032
Figure 46. Argentina Ion Exchange Membrane of All-Vanadium Redox Flow Battery Revenue, (US$, Mn), 2020-2032
Figure 47. By Country – Middle East & Africa Ion Exchange Membrane of All-Vanadium Redox Flow Battery Revenue, Market Share, 2020-2032
Figure 48. By Country – Middle East & Africa Ion Exchange Membrane of All-Vanadium Redox Flow Battery Sales, Market Share, 2020-2032
Figure 49. Turkey Ion Exchange Membrane of All-Vanadium Redox Flow Battery Revenue, (US$, Mn), 2020-2032
Figure 50. Israel Ion Exchange Membrane of All-Vanadium Redox Flow Battery Revenue, (US$, Mn), 2020-2032
Figure 51. Saudi Arabia Ion Exchange Membrane of All-Vanadium Redox Flow Battery Revenue, (US$, Mn), 2020-2032
Figure 52. UAE Ion Exchange Membrane of All-Vanadium Redox Flow Battery Revenue, (US$, Mn), 2020-2032
Figure 53. Global Ion Exchange Membrane of All-Vanadium Redox Flow Battery Production Capacity (Sqm), 2020-2032
Figure 54. The Percentage of Production Ion Exchange Membrane of All-Vanadium Redox Flow Battery by Region, 2024 VS 2032
Figure 55. Ion Exchange Membrane of All-Vanadium Redox Flow Battery Industry Value Chain
Figure 56. Marketing Channels