Internet of Things Sensors Market Overview
This report studies the IoT Sensors market, a smart sensor is a device that takes input from the physical environment and uses built-in compute resources to perform predefined functions upon detection of specific input and then process data before passing it on. IoT platforms function and deliver valorous kind of intelligence and data using a variety of sensors. They serve to collect data, pushing it and sharing it with a whole network of connected devices. All this collected data makes it possible for devices to autonomously function. By combining a set of sensors and a communication network, devices share information with one another and are improving their effectiveness and functionality.
This report provides a deep insight into the global Internet of Things Sensors market covering all its essential aspects. This ranges from a macro overview of the market to micro details of the market size, competitive landscape, development trend, niche market, key market drivers and challenges, SWOT analysis, value chain analysis, etc.
The analysis helps the reader to shape the competition within the industries and strategies for the competitive environment to enhance the potential profit. Furthermore, it provides a simple framework for evaluating and accessing the position of the business organization. The report structure also focuses on the competitive landscape of the Global Internet of Things Sensors Market, this report introduces in detail the market share, market performance, product situation, operation situation, etc. of the main players, which helps the readers in the industry to identify the main competitors and deeply understand the competition pattern of the market.
In a word, this report is a must-read for industry players, investors, researchers, consultants, business strategists, and all those who have any kind of stake or are planning to foray into the Internet of Things Sensors market in any manner.
Internet of Things Sensors Market Analysis:
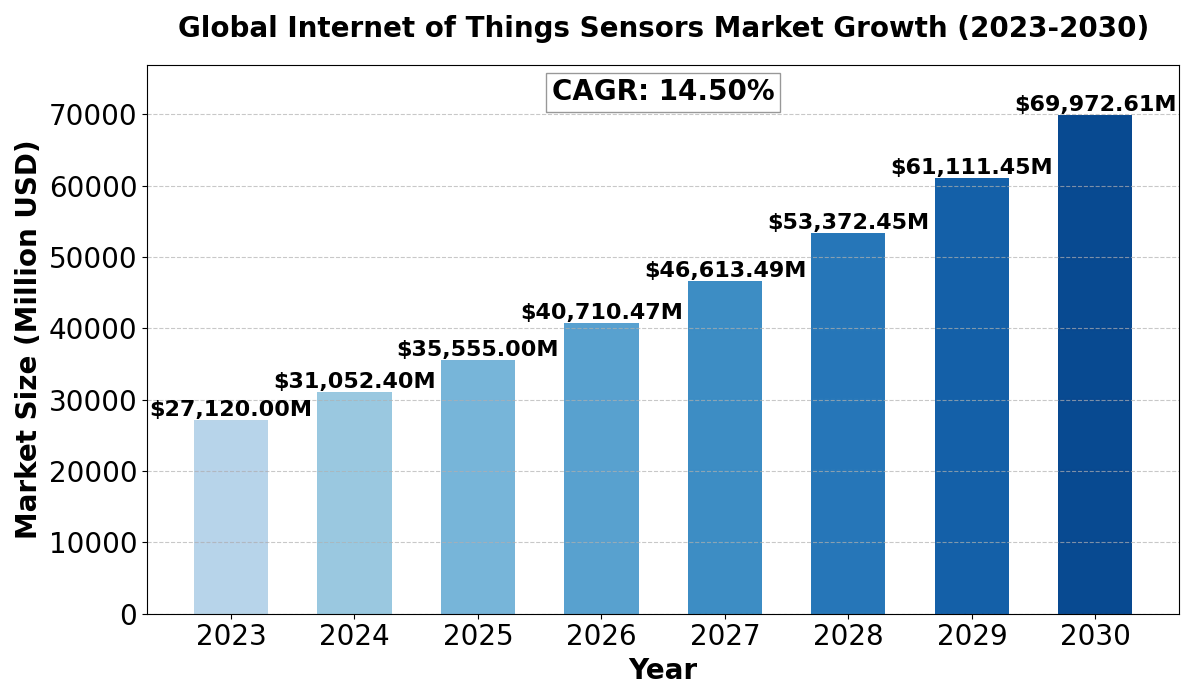
The global Internet of Things Sensors Market size was estimated at USD 27120 million in 2023 and is projected to reach USD 69972.61 million by 2030, exhibiting a CAGR of 14.50% during the forecast period.
North America Internet of Things Sensors market size was USD 7066.70 million in 2023, at a CAGR of 12.43% during the forecast period of 2025 through 2030.
Internet of Things Sensors Key Market Trends :
- Rise in Smart Home & Wearables – The demand for IoT-enabled devices, such as smart thermostats and fitness trackers, is driving sensor adoption.
- Advancements in AI & Edge Computing – AI-powered sensors are improving real-time data processing and decision-making.
- Growing Use in Healthcare – IoT sensors are playing a crucial role in remote monitoring, patient tracking, and smart medical devices.
- Expansion of Smart Cities – IoT sensors are enhancing traffic management, waste disposal, and energy optimization in urban areas.
- Industrial IoT (IIoT) Growth – The manufacturing sector is increasingly integrating IoT sensors for automation, predictive maintenance, and efficiency improvements.
Internet of Things Sensors Market Regional Analysis :

North America:
Strong demand driven by EVs, 5G infrastructure, and renewable energy, with the U.S. leading the market.
Europe:
Growth fueled by automotive electrification, renewable energy, and strong regulatory support, with Germany as a key player.
Asia-Pacific:
Dominates the market due to large-scale manufacturing in China and Japan, with growing demand from EVs, 5G, and semiconductors.
South America:
Emerging market, driven by renewable energy and EV adoption, with Brazil leading growth.
Middle East & Africa:
Gradual growth, mainly due to investments in renewable energy and EV infrastructure, with Saudi Arabia and UAE as key contributors.
Internet of Things Sensors Market Segmentation :
The research report includes specific segments by region (country), manufacturers, Type, and Application. Market segmentation creates subsets of a market based on product type, end-user or application, Geographic, and other factors. By understanding the market segments, the decision-maker can leverage this targeting in the product, sales, and marketing strategies. Market segments can power your product development cycles by informing how you create product offerings for different segments.
Key Company
- Bosch
- Honeywell
- NXP
- Infineon
- Analog Devices
- Panasonic
- InvenSense
- TI
- Silicon Laboratories
- ABB
- STM
- TE Connectivity
- Huagong Tech
- Sensirion
- Zhonghang Electronic Measuring Instruments
- Vishay
- Hanwei Electronics
- Semtech
- Omron
Market Segmentation (by Type)
- Pressure Sensor
- Environmental Sensor
- Optical Sensor
- Chemical Sensor
- Motion Sensor
- Others
Market Segmentation (by Application)
- Smart Home & Wearables
- Smart Energy
- Smart Security
- Manufacturing
- Transportation & Logistics
- Healthcare
- Others
Market Drivers
Rapid Adoption of Smart Devices – The increasing penetration of smart home devices, wearables, and connected appliances is fueling IoT sensor demand.
Growth in Industrial Automation – Industries are leveraging IoT sensors for predictive maintenance, remote monitoring, and real-time analytics.
Advancements in Wireless Technologies – The expansion of 5G and LPWAN networks is enhancing IoT connectivity, enabling seamless sensor integration.
Market Restraints
High Implementation Costs – The initial investment required for IoT sensor deployment, including infrastructure and security measures, can be expensive.
Data Security & Privacy Concerns – Growing cybersecurity threats and potential data breaches pose challenges to IoT sensor adoption.
Interoperability Issues – Lack of standardization among IoT sensors and platforms creates compatibility challenges for businesses.
Market Opportunities
Growth in Smart Healthcare – Increasing adoption of IoT-enabled medical devices presents opportunities for sensor manufacturers.
Expansion of Smart Agriculture – IoT sensors are being used for precision farming, monitoring soil health, and optimizing water usage.
Government Initiatives for Smart Cities – Investments in urban digital transformation are driving demand for IoT sensors in infrastructure and energy management.
Market Challenges
Power Consumption & Battery Life – Many IoT sensors require low power consumption, posing challenges for long-term operation.
Scalability & Network Congestion – As the number of connected devices grows, managing large-scale IoT networks becomes complex.
Complex Data Processing Requirements – Handling massive amounts of sensor data in real-time requires advanced computing capabilities.
Key Benefits of This Market Research:
- Industry drivers, restraints, and opportunities covered in the study
- Neutral perspective on the market performance
- Recent industry trends and developments
- Competitive landscape & strategies of key players
- Potential & niche segments and regions exhibiting promising growth covered
- Historical, current, and projected market size, in terms of value
- In-depth analysis of the Internet of Things Sensors Market
- Overview of the regional outlook of the Internet of Things Sensors Market:
Key Reasons to Buy this Report:
- Access to date statistics compiled by our researchers. These provide you with historical and forecast data, which is analyzed to tell you why your market is set to change
- This enables you to anticipate market changes to remain ahead of your competitors
- You will be able to copy data from the Excel spreadsheet straight into your marketing plans, business presentations, or other strategic documents
- The concise analysis, clear graph, and table format will enable you to pinpoint the information you require quickly
- Provision of market value (USD Billion) data for each segment and sub-segment
- Indicates the region and segment that is expected to witness the fastest growth as well as to dominate the market
- Provides insight into the market through Value Chain
- Market dynamics scenario, along with growth opportunities of the market in the years to come
- 6-month post-sales analyst support
Customization of the Report
In case of any queries or customization requirements, please connect with our sales team, who will ensure that your requirements are met.
FAQs
Q: What are the key driving factors and opportunities in the IoT Sensors Market?
A: Key drivers include the rising adoption of smart devices, industrial automation, and advancements in wireless connectivity. Opportunities lie in healthcare, smart cities, and precision agriculture.
Q: Which region is projected to have the largest market share?
A: The Asia-Pacific region is expected to lead the market due to large-scale manufacturing, high IoT adoption, and strong investments in smart technologies.
Q: Who are the top players in the global IoT Sensors Market?
A: Leading companies include Bosch, Honeywell, NXP, Infineon, Analog Devices, Panasonic, InvenSense, Texas Instruments, and ABB.
Q: What are the latest technological advancements in the industry?
A: Innovations in AI-driven sensors, edge computing, energy-efficient sensor technology, and 5G-based IoT connectivity are driving industry growth.
Q: What is the current size of the global IoT Sensors Market?
A: The market was valued at USD 27,120 million in 2023 and is projected to reach USD 69,972.61 million by 2030, growing at a CAGR of 14.50%.

Get Sample Report PDF for Exclusive Insights
Report Sample Includes
- Table of Contents
- List of Tables & Figures
- Charts, Research Methodology, and more...


