InGaAs PIN Photodiode Array Market Trends, Business Strategies 2026-2036

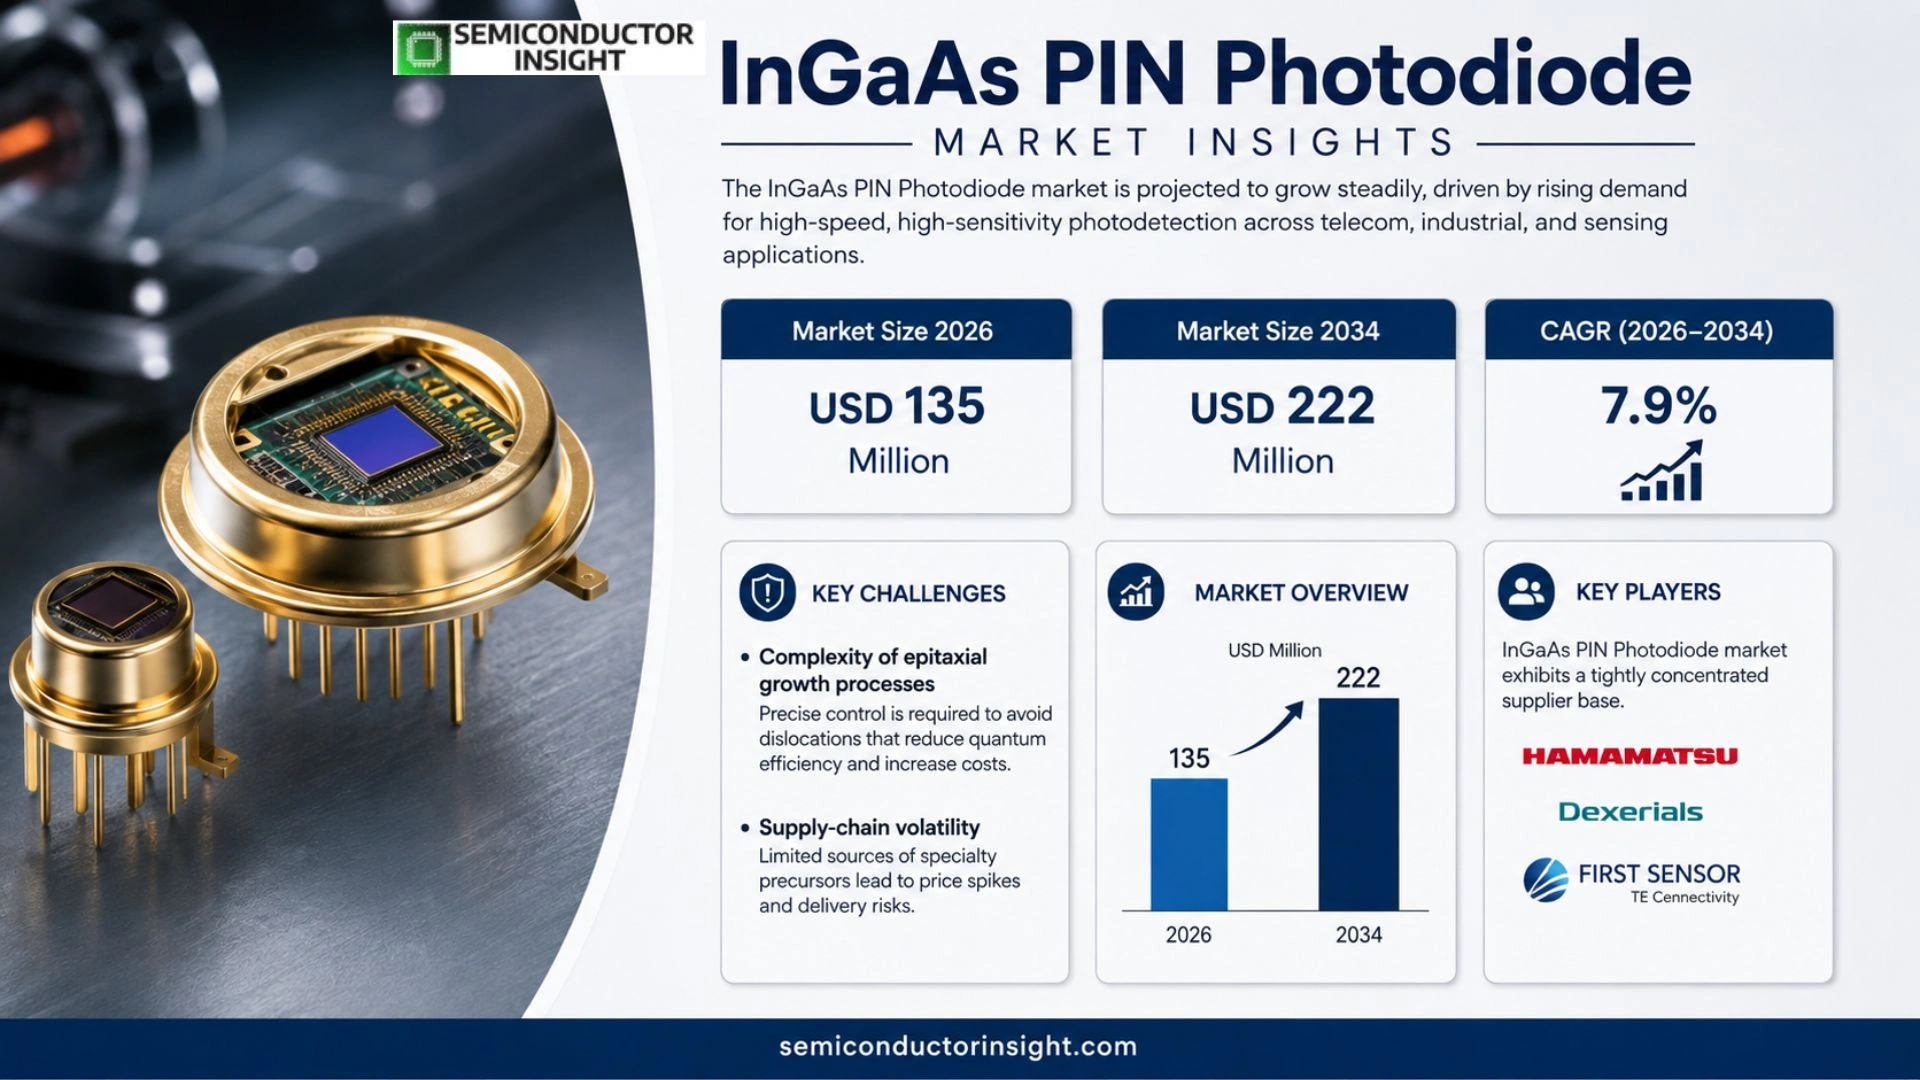
InGaAs PIN Photodiode market is projected to grow from USD 135 million in 2026 to USD 222 million by 2034, exhibiting a CAGR of 7.9% during the forecast period.

PDF Icon Download Sample Report PDF
  • Quick Dispatch

    All Orders

  • Secure Payment

    100% Secure Payment

Price range: $1,500.00 through $4,250.00

Clear

InGaAs PIN Photodiode Market Insights

InGaAs PIN Photodiode market is projected to grow from USD 135 million in 2026 to USD 222 million by 2034, exhibiting a CAGR of 7.9% during the forecast period.

An InGaAs PIN photodiode is a semiconductor light detector made from indium gallium arsenide (InGaAs) with a P‑I‑N structure (p‑type layer, intrinsic layer, n‑type layer) that converts incoming light into an electrical current. It is especially sensitive in the near‑infrared to short‑wave infrared (SWIR) range,typically covering wavelengths from 0.9 µm to 1.7 µm, including the key telecom bands at 1310 nm and 1550 nm. When photons are absorbed in the intrinsic region, charge carriers are generated and swept by an electric field, producing a fast, linear photocurrent.

The market is experiencing rapid growth due to several factors, including expanding fiber‑optic communication networks, rising demand for LiDAR and autonomous‑driving sensors, and increasing adoption of spectroscopy and industrial sensing solutions. Moreover, advances in epitaxial growth techniques and cost reductions for InP substrates are enhancing product performance while lowering entry barriers. Recent collaborations among leading manufacturers such as Hamamatsu, Dexerials Corporation and First Sensor have accelerated new product introductions targeting high‑speed optical modules and defense applications.
InGaAs PIN Photodiode Array Market Share

MARKET DRIVERS

Rising demand for high‑speed optical links

The surge in data‑center interconnects and 5G backhaul has compelled network operators to adopt components that can sustain gigabit‑per‑second rates. InGaAs PIN Photodiode Market participants are capitalising on the material’s intrinsic bandwidth, allowing them to meet the latency expectations of cloud‑based services.

Expansion of Lidar deployments

Automotive manufacturers are integrating Lidar arrays into advanced driver‑assistance systems, and the detector’s sensitivity in the 1.55 µm window aligns perfectly with eye‑safe emission standards. This alignment drives procurement cycles that favour InGaAs PIN devices over alternative semiconductor options.

➤ Industry surveys reveal that >60% of optical equipment suppliers plan to increase their inventory of InGaAs PIN sensors within the next twelve months.

Beyond telecommunications, medical imaging equipment that relies on near‑infrared illumination benefits from the low dark‑current characteristics of the photodiode, prompting manufacturers to source larger volumes for next‑generation scanners.

MARKET CHALLENGES

Complexity of epitaxial growth processes

Producing high‑quality InGaAs layers demands precise control over temperature gradients and gas flow ratios. Even minor deviations can introduce dislocations that impair quantum efficiency, inflating production costs and extending lead times.

Other Challenges

Supply‑chain volatility

The reliance on specialty precursors, many of which are sourced from a limited number of vendors, creates exposure to geopolitical disruptions. Buyers frequently encounter price spikes that ripple through the downstream market.

Regulatory scrutiny surrounding the use of arsenic‑based compounds adds another layer of compliance, compelling manufacturers to invest in waste‑management infrastructure that erodes profit margins.

MARKET RESTRAINTS

High production cost relative to silicon alternatives

Although InGaAs delivers superior performance in the near‑infrared spectrum, its material expense remains considerably higher than silicon‑based counterparts. End‑users weighing cost versus benefit often opt for silicon photodiodes when performance margins are acceptable, limiting market penetration.

Stringent reliability expectations

Mission‑critical deployments in aerospace and defense impose rigorous lifetime testing. Achieving the required mean‑time‑between‑failures (MTBF) can necessitate additional packaging steps, further compounding the cost structure.

MARKET OPPORTUNITIES

Emerging quantum communication networks

Quantum key distribution (QKD) systems rely on single‑photon detection at wavelengths where InGaAs PIN photodiodes excel. Vendors that can certify low‑noise operation under cryogenic conditions are positioned to capture a niche yet lucrative segment of InGaAs PIN Photodiode Market.

Integration with silicon photonics platforms

Hybrid integration schemes that mount InGaAs detectors onto silicon waveguides are gaining traction, offering a pathway to combine the best of both material systems. Such architectures promise to reduce overall system footprints while preserving high‑speed detection capabilities.

InGaAs PIN Photodiode Market Trends

Shift Toward Near‑Infrared Communications

The adoption of 1310 nm and 1550 nm bands in data‑center interconnects has accelerated demand for detectors that preserve signal integrity beyond the silicon cutoff. InGaAs PIN photodiodes deliver quantum efficiencies above 80 % across the 0.9‑1.7 µm window, allowing network operators to increase link distances without repeaters. This technical advantage translates into lower capital expenditure for operators and creates a compelling value proposition for equipment manufacturers. As a result, manufacturers are re‑engineering their product lines to prioritize high‑speed, low‑dark‑current variants that can be integrated into transceiver modules targeting 100 Gb/s and beyond.

Other Trends

Supply‑Chain Realignment

Raw‑material dependency on InP substrates has historically concentrated production in a handful of suppliers. Recent investments by Asian firms in epitaxial wafer fabs have diversified the upstream base, reducing lead times and cushioning price volatility. The broadened supplier pool also enables smaller players to negotiate better terms, thereby narrowing the cost gap between premium and mass‑market devices. This shift augments the overall resilience of InGaAs PIN Photodiode Market, especially as downstream demand from LiDAR and spectroscopy continues to rise.

Regional Production Dynamics

Asia‑Pacific now hosts over 45 % of global capacity, driven by a dense ecosystem of fabs, component assemblers, and end‑user OEMs. The region’s ability to produce mid‑to‑high‑end devices at competitive cost has attracted a wave of new entrants, intensifying price competition in the low‑mid segment. Meanwhile, North America retains leadership in high‑performance, defense‑grade modules, where stringent reliability requirements justify higher margins. Europe’s niche focus on customized spectral‑analysis solutions sustains premium pricing for specialized form factors.

COMPETITIVE LANDSCAPE

Key Industry Players

InGaAs PIN Photodiode market exhibits a tightly concentrated supplier base with clear tiered segmentation

Hamamatsu, Dexerials Corporation and First Sensor (TE Connectivity) dominate the high‑end segment, where control of InP substrate quality and epitaxial material purity differentiates winners from followers. These firms have invested heavily in automated wafer‑scale processing and proprietary packaging solutions, enabling them to secure long‑term contracts with flagship customers such as Coherent and Broadcom. Their ability to deliver low‑dark‑current, high‑speed devices for 1310 nm and 1550 nm telecom modules translates into premium pricing and margins that hover near the upper end of the 35‑45 % range. The concentration of revenue in the top five manufacturers,approximately half of global sales in 2025,creates an implicit barrier for new entrants seeking to serve demanding data‑center and defense applications.

Beyond the elite tier, a diverse set of niche players address mid‑range and volume‑driven markets. Companies such as OSI Optoelectronics, GCS, Laser Components, Fermionics Opto‑Technology and Teledyne Judson specialize in customizable detector formats for LiDAR, spectroscopy and industrial sensing, where cost‑per‑unit and rapid turnaround are decisive. European firms like ALPHALAS GmbH and AC Photonics leverage localized supply chains to offer application‑specific modules for analytical instruments, while Asian manufacturers,including LD‑PD Pte. Ltd., Go!Foton and Ushio,capitalize on scale advantages to supply standardized parts at competitive prices. This stratification ensures that end‑users can select solutions that match both performance requirements and budget constraints, fostering a resilient ecosystem that balances innovation with mass adoption.

List of Key InGaAs PIN Photodiode Companies Profiled

  • Hamamatsu
  • Dexerials Corporation
  • First Sensor (TE Connectivity)
  • Excelitas
  • OSI Optoelectronics
  • GCS
  • Laser Components
  • Fermionics Opto‑Technology
  • Teledyne Judson
  • Lumentum
  • Go!Foton
  • Ushio
  • Qphotonics
  • ALPHALAS GmbH
  • LD‑PD Pte. Ltd.
  • CLPT
  • Optoway
  • MACOM
  • Beijing Lightsensing Technologies

Segment Analysis:

Segment Category Sub-Segments Key Insights
By Type
  • Standard PIN with moderate active area
  • High‑speed PIN optimized for telecom bands
  • Extended‑range PIN covering beyond 1.7 µm
  • Custom‑package PIN for niche applications
High‑speed PIN

  • Delivers sub‑nanosecond response, essential for high‑capacity fiber links.
  • Offers low dark current, enhancing signal integrity in long‑haul telecom.
  • Favored by network equipment OEMs for next‑generation 100 Gbps modules.

Extended‑range PIN

  • Enables detection in the short‑wave infrared beyond 1.7 µm, supporting emerging LiDAR and spectroscopy.
  • Provides robust performance under varied temperature conditions, appealing to automotive and defense sectors.
  • Facilitates system integration where single‑detector solutions are preferred.
By Application
  • Fiber‑optic communications
  • Optical power monitoring
  • LiDAR and range‑finding
  • Spectroscopy & analytical instruments
  • Industrial sensing & test‑and‑measurement
Fiber‑optic communications

  • Provides high quantum efficiency at 1310 nm and 1550 nm, critical for low‑loss transmission.
  • Supports rapid data‑center interconnects with minimal latency.
  • Integrates smoothly with existing transceiver platforms, shortening time‑to‑market.

LiDAR & range‑finding

  • High responsivity at 1550 nm enables longer detection ranges while maintaining eye‑safety.
  • Fast response speeds accommodate high‑frequency pulse modulation for precise distance measurement.
  • Robust packaging tolerates automotive environmental stresses.
By End User
  • Telecom equipment manufacturers
  • Automotive LiDAR suppliers
  • Industrial instrumentation vendors
Telecom equipment manufacturers

  • Prioritize detectors with ultra‑low jitter for coherent optical communication.
  • Require scalable supply chains to match rapid rollout of 5G/6G infrastructure.
  • Seek long‑term reliability to minimize field maintenance costs.

Automotive LiDAR suppliers

  • Demand detectors that combine high sensitivity with ruggedized packaging.
  • Value cost‑effective designs that can be produced at volume for mass‑market vehicles.
  • Emphasize low dark current to improve detection accuracy under varying ambient light.
By Wavelength Range
  • 800‑1100 nm (Silicon‑compatible band)
  • 1100‑1700 nm (Core InGaAs band)
  • 1700‑2000 nm (Extended SWIR)
  • Beyond 2000 nm (Specialized IR)
1100‑1700 nm

  • Dominant range for telecom and data‑center optics, delivering the highest quantum efficiency.
  • Supports emerging quantum communication protocols that rely on low‑noise detection.
  • Attracts strong R&D investment from both academia and industry due to its versatile application set.

1700‑2000 nm

  • Enables advanced LiDAR and free‑space optical links that benefit from reduced atmospheric scattering.
  • Provides a strategic foothold for defense and space‑based sensing markets.
  • Challenges include material growth complexity, driving innovation in epitaxial techniques.
By Responsivity
  • ≤ 1 A/W (Standard performance)
  • > 1 A/W (High‑gain designs)
  • Ultra‑high responsivity (Emerging architectures)
High‑gain designs (> 1 A/W)

  • Offer superior signal‑to‑noise ratio for low‑power optical sources.
  • Enable compact system designs by reducing the need for external amplification.
  • Widely adopted in spectroscopy where weak absorption signals must be captured.

Ultra‑high responsivity

  • Leverages advanced avalanche structures to push responsivity beyond conventional limits.
  • Targets niche markets such as quantum imaging and deep‑space optical communication.
  • Requires meticulous thermal management, influencing packaging choices.

Regional Analysis: InGaAs PIN Photodiode Market

North America

North America retains its pre‑eminence in InGaAs PIN Photodiode Market thanks to a confluence of research intensity, supply‑chain depth, and end‑user demand. A cluster of academic institutions and semiconductor firms in the United States creates a feedback loop where breakthroughs in epitaxial growth rapidly translate into commercial product upgrades. This cycle fuels a preference among defense contractors and data‑center equipment manufacturers for devices that combine high bandwidth with low noise. Meanwhile, Canada’s photonics hubs contribute niche expertise in infrared sensing, enabling broader application for automotive Lidar and environmental monitoring. The region’s regulatory environment, which emphasizes reliability and long‑term support, discourages price‑only competition and instead rewards performance‑centric differentiation. Consequently, manufacturers prioritize engineering margins, invest heavily in custom packaging, and forge strategic alliances with system integrators to embed InGaAs PIN Photodiodes within next‑generation optical transceivers. The prevailing business implication is a shift toward value‑added services,design‑for‑manufacture assistance, firmware updates, and field‑level reliability testing,rather than simple component sales. Companies that can orchestrate these services across the North American ecosystem are positioned to capture premium contracts, while pure‑play component suppliers may experience margin pressure unless they expand their offering scope. This dynamic also nudges global players to establish R&D outposts or joint ventures within the region, seeking proximity to the innovation pipeline and the ability to co‑develop application‑specific solutions. Overall, the North American landscape illustrates how a mature market can evolve from price competition to a service‑oriented model driven by sophisticated end‑user requirements.

R&D Concentration
The concentration of university‑driven research in the Northeast and Silicon Valley accelerates material quality improvements, prompting manufacturers to iterate device architectures more rapidly than peers elsewhere.
Supply‑Chain Integration
A vertically integrated supply chain,from wafer fabs to test equipment,reduces lead times and enhances traceability, allowing customers to align component deliveries tightly with production schedules.
End‑User Diversification
Beyond traditional telecom, emerging demand from autonomous vehicles, aerospace, and quantum communications widens the market’s application base, encouraging firms to tailor device specifications.
Regulatory Landscape
Stringent safety and reliability standards, especially in defense contracts, push suppliers toward comprehensive testing regimes and long‑term support agreements.

Europe
European manufacturers benefit from a coordinated approach to photonics standards, which streamlines certification for cross‑border projects. The region’s emphasis on sustainable production encourages firms to adopt low‑temperature epitaxy, subtly reshaping cost structures. Telecommunications operators in Germany and France demand devices that sustain high data rates under tight power budgets, prompting vendors to prioritize quantum efficiency enhancements. Meanwhile, Scandinavian research institutes focus on integrating InGaAs PIN Photodiodes with silicon photonics platforms, a move that could unlock compact, cost‑effective modules for data‑center interconnects. Companies that align product roadmaps with these standard‑driven and sustainability‑oriented trends are likely to solidify market share across the European Union.

Asia‑Pacific
In the Asia‑Pacific arena, rapid expansion of 5G infrastructure and a burgeoning consumer electronics sector create a fertile backdrop for InGaAs PIN Photodiode adoption. Nations such as Japan and South Korea leverage deep expertise in heterostructure growth to supply high‑performance devices at competitive volumes. Chinese OEMs are increasingly integrating photodiodes into LiDAR arrays for autonomous‑driving pilots, accelerating demand for ruggedized packages. The region’s investment in semiconductor fabs, coupled with government incentives for advanced materials, lowers entry barriers for niche players. Strategic implication: firms that can navigate diverse regulatory environments while offering localized engineering support will extract growth from this heterogeneous market.

South America
South American markets exhibit modest but steady interest, driven mainly by telecommunications upgrades in Brazil and Argentina. Limited local fab capacity forces import reliance, which elevates the importance of after‑sales service networks. Emerging academic collaborations in Brazil’s Federal Universities target low‑cost InGaAs solutions for remote sensing, hinting at a potential niche in environmental monitoring. Companies establishing regional technical centers stand to gain trust among operators seeking reliable component performance in harsh climatic conditions.

Middle East & Africa
In the Middle East & Africa, satellite communication initiatives and defense modernization programs shape demand for high‑speed photodetectors. Gulf Cooperation Council states prioritize secure, high‑capacity links, prompting procurement of premium InGaAs PIN Photodiodes for ground‑station arrays. African telecom operators, however, focus on cost‑effective deployment, favoring devices that balance performance with price. This dichotomy encourages suppliers to adopt a tiered offering strategy: premium, fully supported units for strategic partners and streamlined, volume‑oriented parts for broader market penetration.

Report Scope

This market research report provides a comprehensive analysis of the InGaAs PIN Photodiode Market , covering the forecast period 2026–2034. It offers detailed insights into market dynamics, technological advancements, competitive landscape, and key trends shaping the industry.

Key focus areas of the report include:

  • Market Overview: The report begins with an overview outlining its current market scenario, key growth indicators, and industry transformation drivers. It discusses macroeconomic factors, demand–supply balance, regulatory landscape, and the strategic role of semiconductors in powering advancements across industries such as automotive, telecommunications, consumer electronics, and industrial automation.
  • Market Size & Forecast: Historical data and future projections for revenue, unit shipments, and market value across major regions and segments.
  • Segmentation Analysis: Detailed breakdown by product type, technology, application, and end-user industry to identify high-growth segments and investment opportunities.
  • Regional Insights: Insights into market performance across North America, Europe, Asia-Pacific, Latin America, and the Middle East & Africa, including country-level analysis where relevant.
  • Competitive Landscape: Profiles of leading market participants, including their product offerings, R&D focus, manufacturing capacity, pricing strategies, and recent developments such as mergers, acquisitions, and partnerships.
  • Technology Trends & Innovation: Assessment of emerging technologies, integration of AI/IoT, semiconductor design trends, fabrication techniques, and evolving industry standards.
  • Market Drivers & Restraints: Evaluation of factors driving market growth along with challenges, supply chain constraints, regulatory issues, and market-entry barriers.
  • Stakeholder Insights: Insights for component suppliers, OEMs, system integrators, investors, and policymakers regarding the evolving ecosystem and strategic opportunities.

Primary and secondary research methods are employed, including interviews with industry experts, data from verified sources, and real-time market intelligence to ensure the accuracy and reliability of the insights presented.

FREQUENTLY ASKED QUESTIONS:

What is the current market size of InGaAs PIN Photodiode Market?

-> InGaAs PIN Photodiode market is projected to grow from USD 135 million in 2026 to USD 222 million by 2034, exhibiting a CAGR of 7.9%

Which key companies operate in InGaAs PIN Photodiode Market?

-> Key players include Hamamatsu, Dexerials Corporation, First Sensor (TE Connectivity), Excelitas, OSI Optoelectronics, GCS, Laser Components, Fermionics Opto-Technology, Teledyne Judson, Lumentum, Go!Foton, Ushio, Qphotonics, N.E.P., Albis Optoelectronics, AC Photonics, ALPHALAS GmbH, LD-PD Pte. Ltd., CLPT, among others.

What are the key growth drivers?

-> Key growth drivers include accelerated digital transformation, rising demand for optical communication and data‑center interconnects, expanding autonomous‑driving LiDAR applications, industrial sensing, spectral analysis, and ongoing advancements in semiconductor materials and domestic substitution.

Which region dominates the market?

-> Asia‑Pacific holds the largest market share, projected to exceed 45% by 2025, driven by a robust supply chain, cost advantages, and growing demand from communications, LiDAR, and emerging technologies.

What are the emerging trends?

-> Emerging trends include development of 6G‑related photodiodes, quantum sensing solutions, space optical communication devices, and increased customization of high‑end InGaAs PIN photodiodes for specialized applications.

InGaAs PIN Photodiode Array Market Trends, Business Strategies 2026-2036

Get Sample Report PDF for Exclusive Insights

Report Sample Includes

  • Table of Contents
  • List of Tables & Figures
  • Charts, Research Methodology, and more...

PDF Icon Download Sample Report PDF

Download Sample Report

Table of Content

Table of Contents
1 Research Methodology and Statistical Scope
1.1 Market Definition and Statistical Scope of InGaAs PIN Photodiode Array
1.2 Key Market Segments
1.2.1 InGaAs PIN Photodiode Array Segment by Type
1.2.2 InGaAs PIN Photodiode Array Segment by Application
1.3 Methodology & Sources of Information
1.3.1 Research Methodology
1.3.2 Research Process
1.3.3 Market Breakdown and Data Triangulation
1.3.4 Base Year
1.3.5 Report Assumptions & Caveats
2 InGaAs PIN Photodiode Array Market Overview
2.1 Global Market Overview
2.1.1 Global InGaAs PIN Photodiode Array Market Size (M USD) Estimates and Forecasts (2019-2032)
2.1.2 Global InGaAs PIN Photodiode Array Sales Estimates and Forecasts (2019-2032)
2.2 Market Segment Executive Summary
2.3 Global Market Size by Region
3 InGaAs PIN Photodiode Array Market Competitive Landscape
3.1 Global InGaAs PIN Photodiode Array Sales by Manufacturers (2019-2025)
3.2 Global InGaAs PIN Photodiode Array Revenue Market Share by Manufacturers (2019-2025)
3.3 InGaAs PIN Photodiode Array Market Share by Company Type (Tier 1, Tier 2, and Tier 3)
3.4 Global InGaAs PIN Photodiode Array Average Price by Manufacturers (2019-2025)
3.5 Manufacturers InGaAs PIN Photodiode Array Sales Sites, Area Served, Product Type
3.6 InGaAs PIN Photodiode Array Market Competitive Situation and Trends
3.6.1 InGaAs PIN Photodiode Array Market Concentration Rate
3.6.2 Global 5 and 10 Largest InGaAs PIN Photodiode Array Players Market Share by Revenue
3.6.3 Mergers & Acquisitions, Expansion
4 InGaAs PIN Photodiode Array Industry Chain Analysis
4.1 InGaAs PIN Photodiode Array Industry Chain Analysis
4.2 Market Overview of Key Raw Materials
4.3 Midstream Market Analysis
4.4 Downstream Customer Analysis
5 The Development and Dynamics of InGaAs PIN Photodiode Array Market
5.1 Key Development Trends
5.2 Driving Factors
5.3 Market Challenges
5.4 Market Restraints
5.5 Industry News
5.5.1 New Product Developments
5.5.2 Mergers & Acquisitions
5.5.3 Expansions
5.5.4 Collaboration/Supply Contracts
5.6 Industry Policies
6 InGaAs PIN Photodiode Array Market Segmentation by Type
6.1 Evaluation Matrix of Segment Market Development Potential (Type)
6.2 Global InGaAs PIN Photodiode Array Sales Market Share by Type (2019-2025)
6.3 Global InGaAs PIN Photodiode Array Market Size Market Share by Type (2019-2025)
6.4 Global InGaAs PIN Photodiode Array Price by Type (2019-2025)
7 InGaAs PIN Photodiode Array Market Segmentation by Application
7.1 Evaluation Matrix of Segment Market Development Potential (Application)
7.2 Global InGaAs PIN Photodiode Array Market Sales by Application (2019-2025)
7.3 Global InGaAs PIN Photodiode Array Market Size (M USD) by Application (2019-2025)
7.4 Global InGaAs PIN Photodiode Array Sales Growth Rate by Application (2019-2025)
8 InGaAs PIN Photodiode Array Market Consumption by Region
8.1 Global InGaAs PIN Photodiode Array Sales by Region
8.1.1 Global InGaAs PIN Photodiode Array Sales by Region
8.1.2 Global InGaAs PIN Photodiode Array Sales Market Share by Region
8.2 North America
8.2.1 North America InGaAs PIN Photodiode Array Sales by Country
8.2.2 U.S.
8.2.3 Canada
8.2.4 Mexico
8.3 Europe
8.3.1 Europe InGaAs PIN Photodiode Array Sales by Country
8.3.2 Germany
8.3.3 France
8.3.4 U.K.
8.3.5 Italy
8.3.6 Russia
8.4 Asia Pacific
8.4.1 Asia Pacific InGaAs PIN Photodiode Array Sales by Region
8.4.2 China
8.4.3 Japan
8.4.4 South Korea
8.4.5 India
8.4.6 Southeast Asia
8.5 South America
8.5.1 South America InGaAs PIN Photodiode Array Sales by Country
8.5.2 Brazil
8.5.3 Argentina
8.5.4 Columbia
8.6 Middle East and Africa
8.6.1 Middle East and Africa InGaAs PIN Photodiode Array Sales by Region
8.6.2 Saudi Arabia
8.6.3 UAE
8.6.4 Egypt
8.6.5 Nigeria
8.6.6 South Africa
9 InGaAs PIN Photodiode Array Market Production by Region
9.1 Global Production of InGaAs PIN Photodiode Array by Region (2019-2025)
9.2 Global InGaAs PIN Photodiode Array Revenue Market Share by Region (2019-2025)
9.3 Global InGaAs PIN Photodiode Array Production, Revenue, Price and Gross Margin (2019-2025)
9.4 North America InGaAs PIN Photodiode Array Production
9.4.1 North America InGaAs PIN Photodiode Array Production Growth Rate (2019-2025)
9.4.2 North America InGaAs PIN Photodiode Array Production, Revenue, Price and Gross Margin (2019-2025)
9.5 Europe InGaAs PIN Photodiode Array Production
9.5.1 Europe InGaAs PIN Photodiode Array Production Growth Rate (2019-2025)
9.5.2 Europe InGaAs PIN Photodiode Array Production, Revenue, Price and Gross Margin (2019-2025)
9.6 Japan InGaAs PIN Photodiode Array Production (2019-2025)
9.6.1 Japan InGaAs PIN Photodiode Array Production Growth Rate (2019-2025)
9.6.2 Japan InGaAs PIN Photodiode Array Production, Revenue, Price and Gross Margin (2019-2025)
9.7 China InGaAs PIN Photodiode Array Production (2019-2025)
9.7.1 China InGaAs PIN Photodiode Array Production Growth Rate (2019-2025)
9.7.2 China InGaAs PIN Photodiode Array Production, Revenue, Price and Gross Margin (2019-2025)
10 Key Companies Profile
10.1 Kyoto Semiconductor
10.1.1 Kyoto Semiconductor InGaAs PIN Photodiode Array Basic Information
10.1.2 Kyoto Semiconductor InGaAs PIN Photodiode Array Product Overview
10.1.3 Kyoto Semiconductor InGaAs PIN Photodiode Array Product Market Performance
10.1.4 Kyoto Semiconductor Business Overview
10.1.5 Kyoto Semiconductor InGaAs PIN Photodiode Array SWOT Analysis
10.1.6 Kyoto Semiconductor Recent Developments
10.2 Hamamatsu
10.2.1 Hamamatsu InGaAs PIN Photodiode Array Basic Information
10.2.2 Hamamatsu InGaAs PIN Photodiode Array Product Overview
10.2.3 Hamamatsu InGaAs PIN Photodiode Array Product Market Performance
10.2.4 Hamamatsu Business Overview
10.2.5 Hamamatsu InGaAs PIN Photodiode Array SWOT Analysis
10.2.6 Hamamatsu Recent Developments
10.3 First Sensor (TE Con??nectivity)
10.3.1 First Sensor (TE Con??nectivity) InGaAs PIN Photodiode Array Basic Information
10.3.2 First Sensor (TE Con??nectivity) InGaAs PIN Photodiode Array Product Overview
10.3.3 First Sensor (TE Con??nectivity) InGaAs PIN Photodiode Array Product Market Performance
10.3.4 First Sensor (TE Con??nectivity) InGaAs PIN Photodiode Array SWOT Analysis
10.3.5 First Sensor (TE Con??nectivity) Business Overview
10.3.6 First Sensor (TE Con??nectivity) Recent Developments
10.4 Excelitas
10.4.1 Excelitas InGaAs PIN Photodiode Array Basic Information
10.4.2 Excelitas InGaAs PIN Photodiode Array Product Overview
10.4.3 Excelitas InGaAs PIN Photodiode Array Product Market Performance
10.4.4 Excelitas Business Overview
10.4.5 Excelitas Recent Developments
10.5 OSI Optoelectronics
10.5.1 OSI Optoelectronics InGaAs PIN Photodiode Array Basic Information
10.5.2 OSI Optoelectronics InGaAs PIN Photodiode Array Product Overview
10.5.3 OSI Optoelectronics InGaAs PIN Photodiode Array Product Market Performance
10.5.4 OSI Optoelectronics Business Overview
10.5.5 OSI Optoelectronics Recent Developments
10.6 GCS
10.6.1 GCS InGaAs PIN Photodiode Array Basic Information
10.6.2 GCS InGaAs PIN Photodiode Array Product Overview
10.6.3 GCS InGaAs PIN Photodiode Array Product Market Performance
10.6.4 GCS Business Overview
10.6.5 GCS Recent Developments
10.7 Laser Components
10.7.1 Laser Components InGaAs PIN Photodiode Array Basic Information
10.7.2 Laser Components InGaAs PIN Photodiode Array Product Overview
10.7.3 Laser Components InGaAs PIN Photodiode Array Product Market Performance
10.7.4 Laser Components Business Overview
10.7.5 Laser Components Recent Developments
10.8 Go!Foton
10.8.1 Go!Foton InGaAs PIN Photodiode Array Basic Information
10.8.2 Go!Foton InGaAs PIN Photodiode Array Product Overview
10.8.3 Go!Foton InGaAs PIN Photodiode Array Product Market Performance
10.8.4 Go!Foton Business Overview
10.8.5 Go!Foton Recent Developments
10.9 Ushio
10.9.1 Ushio InGaAs PIN Photodiode Array Basic Information
10.9.2 Ushio InGaAs PIN Photodiode Array Product Overview
10.9.3 Ushio InGaAs PIN Photodiode Array Product Market Performance
10.9.4 Ushio Business Overview
10.9.5 Ushio Recent Developments
10.10 Qphotonics
10.10.1 Qphotonics InGaAs PIN Photodiode Array Basic Information
10.10.2 Qphotonics InGaAs PIN Photodiode Array Product Overview
10.10.3 Qphotonics InGaAs PIN Photodiode Array Product Market Performance
10.10.4 Qphotonics Business Overview
10.10.5 Qphotonics Recent Developments
10.11 N.E.P.
10.11.1 N.E.P. InGaAs PIN Photodiode Array Basic Information
10.11.2 N.E.P. InGaAs PIN Photodiode Array Product Overview
10.11.3 N.E.P. InGaAs PIN Photodiode Array Product Market Performance
10.11.4 N.E.P. Business Overview
10.11.5 N.E.P. Recent Developments
10.12 Albis Optoelectronics
10.12.1 Albis Optoelectronics InGaAs PIN Photodiode Array Basic Information
10.12.2 Albis Optoelectronics InGaAs PIN Photodiode Array Product Overview
10.12.3 Albis Optoelectronics InGaAs PIN Photodiode Array Product Market Performance
10.12.4 Albis Optoelectronics Business Overview
10.12.5 Albis Optoelectronics Recent Developments
10.13 AC Photonics
10.13.1 AC Photonics InGaAs PIN Photodiode Array Basic Information
10.13.2 AC Photonics InGaAs PIN Photodiode Array Product Overview
10.13.3 AC Photonics InGaAs PIN Photodiode Array Product Market Performance
10.13.4 AC Photonics Business Overview
10.13.5 AC Photonics Recent Developments
10.14 Voxtel (Allegro MicroSystems)
10.14.1 Voxtel (Allegro MicroSystems) InGaAs PIN Photodiode Array Basic Information
10.14.2 Voxtel (Allegro MicroSystems) InGaAs PIN Photodiode Array Product Overview
10.14.3 Voxtel (Allegro MicroSystems) InGaAs PIN Photodiode Array Product Market Performance
10.14.4 Voxtel (Allegro MicroSystems) Business Overview
10.14.5 Voxtel (Allegro MicroSystems) Recent Developments
10.15 Fermionics Opto-Technology
10.15.1 Fermionics Opto-Technology InGaAs PIN Photodiode Array Basic Information
10.15.2 Fermionics Opto-Technology InGaAs PIN Photodiode Array Product Overview
10.15.3 Fermionics Opto-Technology InGaAs PIN Photodiode Array Product Market Performance
10.15.4 Fermionics Opto-Technology Business Overview
10.15.5 Fermionics Opto-Technology Recent Developments
10.16 PHOGRAIN
10.16.1 PHOGRAIN InGaAs PIN Photodiode Array Basic Information
10.16.2 PHOGRAIN InGaAs PIN Photodiode Array Product Overview
10.16.3 PHOGRAIN InGaAs PIN Photodiode Array Product Market Performance
10.16.4 PHOGRAIN Business Overview
10.16.5 PHOGRAIN Recent Developments
10.17 Thorlabs
10.17.1 Thorlabs InGaAs PIN Photodiode Array Basic Information
10.17.2 Thorlabs InGaAs PIN Photodiode Array Product Overview
10.17.3 Thorlabs InGaAs PIN Photodiode Array Product Market Performance
10.17.4 Thorlabs Business Overview
10.17.5 Thorlabs Recent Developments
10.18 Shengshi Optical
10.18.1 Shengshi Optical InGaAs PIN Photodiode Array Basic Information
10.18.2 Shengshi Optical InGaAs PIN Photodiode Array Product Overview
10.18.3 Shengshi Optical InGaAs PIN Photodiode Array Product Market Performance
10.18.4 Shengshi Optical Business Overview
10.18.5 Shengshi Optical Recent Developments
10.19 CLPT
10.19.1 CLPT InGaAs PIN Photodiode Array Basic Information
10.19.2 CLPT InGaAs PIN Photodiode Array Product Overview
10.19.3 CLPT InGaAs PIN Photodiode Array Product Market Performance
10.19.4 CLPT Business Overview
10.19.5 CLPT Recent Developments
10.20 Optoway
10.20.1 Optoway InGaAs PIN Photodiode Array Basic Information
10.20.2 Optoway InGaAs PIN Photodiode Array Product Overview
10.20.3 Optoway InGaAs PIN Photodiode Array Product Market Performance
10.20.4 Optoway Business Overview
10.20.5 Optoway Recent Developments
11 InGaAs PIN Photodiode Array Market Forecast by Region
11.1 Global InGaAs PIN Photodiode Array Market Size Forecast
11.2 Global InGaAs PIN Photodiode Array Market Forecast by Region
11.2.1 North America Market Size Forecast by Country
11.2.2 Europe InGaAs PIN Photodiode Array Market Size Forecast by Country
11.2.3 Asia Pacific InGaAs PIN Photodiode Array Market Size Forecast by Region
11.2.4 South America InGaAs PIN Photodiode Array Market Size Forecast by Country
11.2.5 Middle East and Africa Forecasted Consumption of InGaAs PIN Photodiode Array by Country
12 Forecast Market by Type and by Application (2025-2032)
12.1 Global InGaAs PIN Photodiode Array Market Forecast by Type (2025-2032)
12.1.1 Global Forecasted Sales of InGaAs PIN Photodiode Array by Type (2025-2032)
12.1.2 Global InGaAs PIN Photodiode Array Market Size Forecast by Type (2025-2032)
12.1.3 Global Forecasted Price of InGaAs PIN Photodiode Array by Type (2025-2032)
12.2 Global InGaAs PIN Photodiode Array Market Forecast by Application (2025-2032)
12.2.1 Global InGaAs PIN Photodiode Array Sales (K Units) Forecast by Application
12.2.2 Global InGaAs PIN Photodiode Array Market Size (M USD) Forecast by Application (2025-2032)
13 Conclusion and Key FindingsList of Tables
Table 1. Introduction of the Type
Table 2. Introduction of the Application
Table 3. Market Size (M USD) Segment Executive Summary
Table 4. InGaAs PIN Photodiode Array Market Size Comparison by Region (M USD)
Table 5. Global InGaAs PIN Photodiode Array Sales (K Units) by Manufacturers (2019-2025)
Table 6. Global InGaAs PIN Photodiode Array Sales Market Share by Manufacturers (2019-2025)
Table 7. Global InGaAs PIN Photodiode Array Revenue (M USD) by Manufacturers (2019-2025)
Table 8. Global InGaAs PIN Photodiode Array Revenue Share by Manufacturers (2019-2025)
Table 9. Company Type (Tier 1, Tier 2, and Tier 3) & (based on the Revenue in InGaAs PIN Photodiode Array as of 2022)
Table 10. Global Market InGaAs PIN Photodiode Array Average Price (USD/Unit) of Key Manufacturers (2019-2025)
Table 11. Manufacturers InGaAs PIN Photodiode Array Sales Sites and Area Served
Table 12. Manufacturers InGaAs PIN Photodiode Array Product Type
Table 13. Global InGaAs PIN Photodiode Array Manufacturers Market Concentration Ratio (CR5 and HHI)
Table 14. Mergers & Acquisitions, Expansion Plans
Table 15. Industry Chain Map of InGaAs PIN Photodiode Array
Table 16. Market Overview of Key Raw Materials
Table 17. Midstream Market Analysis
Table 18. Downstream Customer Analysis
Table 19. Key Development Trends
Table 20. Driving Factors
Table 21. InGaAs PIN Photodiode Array Market Challenges
Table 22. Global InGaAs PIN Photodiode Array Sales by Type (K Units)
Table 23. Global InGaAs PIN Photodiode Array Market Size by Type (M USD)
Table 24. Global InGaAs PIN Photodiode Array Sales (K Units) by Type (2019-2025)
Table 25. Global InGaAs PIN Photodiode Array Sales Market Share by Type (2019-2025)
Table 26. Global InGaAs PIN Photodiode Array Market Size (M USD) by Type (2019-2025)
Table 27. Global InGaAs PIN Photodiode Array Market Size Share by Type (2019-2025)
Table 28. Global InGaAs PIN Photodiode Array Price (USD/Unit) by Type (2019-2025)
Table 29. Global InGaAs PIN Photodiode Array Sales (K Units) by Application
Table 30. Global InGaAs PIN Photodiode Array Market Size by Application
Table 31. Global InGaAs PIN Photodiode Array Sales by Application (2019-2025) & (K Units)
Table 32. Global InGaAs PIN Photodiode Array Sales Market Share by Application (2019-2025)
Table 33. Global InGaAs PIN Photodiode Array Sales by Application (2019-2025) & (M USD)
Table 34. Global InGaAs PIN Photodiode Array Market Share by Application (2019-2025)
Table 35. Global InGaAs PIN Photodiode Array Sales Growth Rate by Application (2019-2025)
Table 36. Global InGaAs PIN Photodiode Array Sales by Region (2019-2025) & (K Units)
Table 37. Global InGaAs PIN Photodiode Array Sales Market Share by Region (2019-2025)
Table 38. North America InGaAs PIN Photodiode Array Sales by Country (2019-2025) & (K Units)
Table 39. Europe InGaAs PIN Photodiode Array Sales by Country (2019-2025) & (K Units)
Table 40. Asia Pacific InGaAs PIN Photodiode Array Sales by Region (2019-2025) & (K Units)
Table 41. South America InGaAs PIN Photodiode Array Sales by Country (2019-2025) & (K Units)
Table 42. Middle East and Africa InGaAs PIN Photodiode Array Sales by Region (2019-2025) & (K Units)
Table 43. Global InGaAs PIN Photodiode Array Production (K Units) by Region (2019-2025)
Table 44. Global InGaAs PIN Photodiode Array Revenue (US$ Million) by Region (2019-2025)
Table 45. Global InGaAs PIN Photodiode Array Revenue Market Share by Region (2019-2025)
Table 46. Global InGaAs PIN Photodiode Array Production (K Units), Revenue (US$ Million), Price (USD/Unit) and Gross Margin (2019-2025)
Table 47. North America InGaAs PIN Photodiode Array Production (K Units), Revenue (US$ Million), Price (USD/Unit) and Gross Margin (2019-2025)
Table 48. Europe InGaAs PIN Photodiode Array Production (K Units), Revenue (US$ Million), Price (USD/Unit) and Gross Margin (2019-2025)
Table 49. Japan InGaAs PIN Photodiode Array Production (K Units), Revenue (US$ Million), Price (USD/Unit) and Gross Margin (2019-2025)
Table 50. China InGaAs PIN Photodiode Array Production (K Units), Revenue (US$ Million), Price (USD/Unit) and Gross Margin (2019-2025)
Table 51. Kyoto Semiconductor InGaAs PIN Photodiode Array Basic Information
Table 52. Kyoto Semiconductor InGaAs PIN Photodiode Array Product Overview
Table 53. Kyoto Semiconductor InGaAs PIN Photodiode Array Sales (K Units), Revenue (M USD), Price (USD/Unit) and Gross Margin (2019-2025)
Table 54. Kyoto Semiconductor Business Overview
Table 55. Kyoto Semiconductor InGaAs PIN Photodiode Array SWOT Analysis
Table 56. Kyoto Semiconductor Recent Developments
Table 57. Hamamatsu InGaAs PIN Photodiode Array Basic Information
Table 58. Hamamatsu InGaAs PIN Photodiode Array Product Overview
Table 59. Hamamatsu InGaAs PIN Photodiode Array Sales (K Units), Revenue (M USD), Price (USD/Unit) and Gross Margin (2019-2025)
Table 60. Hamamatsu Business Overview
Table 61. Hamamatsu InGaAs PIN Photodiode Array SWOT Analysis
Table 62. Hamamatsu Recent Developments
Table 63. First Sensor (TE Con??nectivity) InGaAs PIN Photodiode Array Basic Information
Table 64. First Sensor (TE Con??nectivity) InGaAs PIN Photodiode Array Product Overview
Table 65. First Sensor (TE Con??nectivity) InGaAs PIN Photodiode Array Sales (K Units), Revenue (M USD), Price (USD/Unit) and Gross Margin (2019-2025)
Table 66. First Sensor (TE Con??nectivity) InGaAs PIN Photodiode Array SWOT Analysis
Table 67. First Sensor (TE Con??nectivity) Business Overview
Table 68. First Sensor (TE Con??nectivity) Recent Developments
Table 69. Excelitas InGaAs PIN Photodiode Array Basic Information
Table 70. Excelitas InGaAs PIN Photodiode Array Product Overview
Table 71. Excelitas InGaAs PIN Photodiode Array Sales (K Units), Revenue (M USD), Price (USD/Unit) and Gross Margin (2019-2025)
Table 72. Excelitas Business Overview
Table 73. Excelitas Recent Developments
Table 74. OSI Optoelectronics InGaAs PIN Photodiode Array Basic Information
Table 75. OSI Optoelectronics InGaAs PIN Photodiode Array Product Overview
Table 76. OSI Optoelectronics InGaAs PIN Photodiode Array Sales (K Units), Revenue (M USD), Price (USD/Unit) and Gross Margin (2019-2025)
Table 77. OSI Optoelectronics Business Overview
Table 78. OSI Optoelectronics Recent Developments
Table 79. GCS InGaAs PIN Photodiode Array Basic Information
Table 80. GCS InGaAs PIN Photodiode Array Product Overview
Table 81. GCS InGaAs PIN Photodiode Array Sales (K Units), Revenue (M USD), Price (USD/Unit) and Gross Margin (2019-2025)
Table 82. GCS Business Overview
Table 83. GCS Recent Developments
Table 84. Laser Components InGaAs PIN Photodiode Array Basic Information
Table 85. Laser Components InGaAs PIN Photodiode Array Product Overview
Table 86. Laser Components InGaAs PIN Photodiode Array Sales (K Units), Revenue (M USD), Price (USD/Unit) and Gross Margin (2019-2025)
Table 87. Laser Components Business Overview
Table 88. Laser Components Recent Developments
Table 89. Go!Foton InGaAs PIN Photodiode Array Basic Information
Table 90. Go!Foton InGaAs PIN Photodiode Array Product Overview
Table 91. Go!Foton InGaAs PIN Photodiode Array Sales (K Units), Revenue (M USD), Price (USD/Unit) and Gross Margin (2019-2025)
Table 92. Go!Foton Business Overview
Table 93. Go!Foton Recent Developments
Table 94. Ushio InGaAs PIN Photodiode Array Basic Information
Table 95. Ushio InGaAs PIN Photodiode Array Product Overview
Table 96. Ushio InGaAs PIN Photodiode Array Sales (K Units), Revenue (M USD), Price (USD/Unit) and Gross Margin (2019-2025)
Table 97. Ushio Business Overview
Table 98. Ushio Recent Developments
Table 99. Qphotonics InGaAs PIN Photodiode Array Basic Information
Table 100. Qphotonics InGaAs PIN Photodiode Array Product Overview
Table 101. Qphotonics InGaAs PIN Photodiode Array Sales (K Units), Revenue (M USD), Price (USD/Unit) and Gross Margin (2019-2025)
Table 102. Qphotonics Business Overview
Table 103. Qphotonics Recent Developments
Table 104. N.E.P. InGaAs PIN Photodiode Array Basic Information
Table 105. N.E.P. InGaAs PIN Photodiode Array Product Overview
Table 106. N.E.P. InGaAs PIN Photodiode Array Sales (K Units), Revenue (M USD), Price (USD/Unit) and Gross Margin (2019-2025)
Table 107. N.E.P. Business Overview
Table 108. N.E.P. Recent Developments
Table 109. Albis Optoelectronics InGaAs PIN Photodiode Array Basic Information
Table 110. Albis Optoelectronics InGaAs PIN Photodiode Array Product Overview
Table 111. Albis Optoelectronics InGaAs PIN Photodiode Array Sales (K Units), Revenue (M USD), Price (USD/Unit) and Gross Margin (2019-2025)
Table 112. Albis Optoelectronics Business Overview
Table 113. Albis Optoelectronics Recent Developments
Table 114. AC Photonics InGaAs PIN Photodiode Array Basic Information
Table 115. AC Photonics InGaAs PIN Photodiode Array Product Overview
Table 116. AC Photonics InGaAs PIN Photodiode Array Sales (K Units), Revenue (M USD), Price (USD/Unit) and Gross Margin (2019-2025)
Table 117. AC Photonics Business Overview
Table 118. AC Photonics Recent Developments
Table 119. Voxtel (Allegro MicroSystems) InGaAs PIN Photodiode Array Basic Information
Table 120. Voxtel (Allegro MicroSystems) InGaAs PIN Photodiode Array Product Overview
Table 121. Voxtel (Allegro MicroSystems) InGaAs PIN Photodiode Array Sales (K Units), Revenue (M USD), Price (USD/Unit) and Gross Margin (2019-2025)
Table 122. Voxtel (Allegro MicroSystems) Business Overview
Table 123. Voxtel (Allegro MicroSystems) Recent Developments
Table 124. Fermionics Opto-Technology InGaAs PIN Photodiode Array Basic Information
Table 125. Fermionics Opto-Technology InGaAs PIN Photodiode Array Product Overview
Table 126. Fermionics Opto-Technology InGaAs PIN Photodiode Array Sales (K Units), Revenue (M USD), Price (USD/Unit) and Gross Margin (2019-2025)
Table 127. Fermionics Opto-Technology Business Overview
Table 128. Fermionics Opto-Technology Recent Developments
Table 129. PHOGRAIN InGaAs PIN Photodiode Array Basic Information
Table 130. PHOGRAIN InGaAs PIN Photodiode Array Product Overview
Table 131. PHOGRAIN InGaAs PIN Photodiode Array Sales (K Units), Revenue (M USD), Price (USD/Unit) and Gross Margin (2019-2025)
Table 132. PHOGRAIN Business Overview
Table 133. PHOGRAIN Recent Developments
Table 134. Thorlabs InGaAs PIN Photodiode Array Basic Information
Table 135. Thorlabs InGaAs PIN Photodiode Array Product Overview
Table 136. Thorlabs InGaAs PIN Photodiode Array Sales (K Units), Revenue (M USD), Price (USD/Unit) and Gross Margin (2019-2025)
Table 137. Thorlabs Business Overview
Table 138. Thorlabs Recent Developments
Table 139. Shengshi Optical InGaAs PIN Photodiode Array Basic Information
Table 140. Shengshi Optical InGaAs PIN Photodiode Array Product Overview
Table 141. Shengshi Optical InGaAs PIN Photodiode Array Sales (K Units), Revenue (M USD), Price (USD/Unit) and Gross Margin (2019-2025)
Table 142. Shengshi Optical Business Overview
Table 143. Shengshi Optical Recent Developments
Table 144. CLPT InGaAs PIN Photodiode Array Basic Information
Table 145. CLPT InGaAs PIN Photodiode Array Product Overview
Table 146. CLPT InGaAs PIN Photodiode Array Sales (K Units), Revenue (M USD), Price (USD/Unit) and Gross Margin (2019-2025)
Table 147. CLPT Business Overview
Table 148. CLPT Recent Developments
Table 149. Optoway InGaAs PIN Photodiode Array Basic Information
Table 150. Optoway InGaAs PIN Photodiode Array Product Overview
Table 151. Optoway InGaAs PIN Photodiode Array Sales (K Units), Revenue (M USD), Price (USD/Unit) and Gross Margin (2019-2025)
Table 152. Optoway Business Overview
Table 153. Optoway Recent Developments
Table 154. Global InGaAs PIN Photodiode Array Sales Forecast by Region (2025-2032) & (K Units)
Table 155. Global InGaAs PIN Photodiode Array Market Size Forecast by Region (2025-2032) & (M USD)
Table 156. North America InGaAs PIN Photodiode Array Sales Forecast by Country (2025-2032) & (K Units)
Table 157. North America InGaAs PIN Photodiode Array Market Size Forecast by Country (2025-2032) & (M USD)
Table 158. Europe InGaAs PIN Photodiode Array Sales Forecast by Country (2025-2032) & (K Units)
Table 159. Europe InGaAs PIN Photodiode Array Market Size Forecast by Country (2025-2032) & (M USD)
Table 160. Asia Pacific InGaAs PIN Photodiode Array Sales Forecast by Region (2025-2032) & (K Units)
Table 161. Asia Pacific InGaAs PIN Photodiode Array Market Size Forecast by Region (2025-2032) & (M USD)
Table 162. South America InGaAs PIN Photodiode Array Sales Forecast by Country (2025-2032) & (K Units)
Table 163. South America InGaAs PIN Photodiode Array Market Size Forecast by Country (2025-2032) & (M USD)
Table 164. Middle East and Africa InGaAs PIN Photodiode Array Consumption Forecast by Country (2025-2032) & (Units)
Table 165. Middle East and Africa InGaAs PIN Photodiode Array Market Size Forecast by Country (2025-2032) & (M USD)
Table 166. Global InGaAs PIN Photodiode Array Sales Forecast by Type (2025-2032) & (K Units)
Table 167. Global InGaAs PIN Photodiode Array Market Size Forecast by Type (2025-2032) & (M USD)
Table 168. Global InGaAs PIN Photodiode Array Price Forecast by Type (2025-2032) & (USD/Unit)
Table 169. Global InGaAs PIN Photodiode Array Sales (K Units) Forecast by Application (2025-2032)
Table 170. Global InGaAs PIN Photodiode Array Market Size Forecast by Application (2025-2032) & (M USD)
List of Figures
Figure 1. Product Picture of InGaAs PIN Photodiode Array
Figure 2. Data Triangulation
Figure 3. Key Caveats
Figure 4. Global InGaAs PIN Photodiode Array Market Size (M USD), 2019-2032
Figure 5. Global InGaAs PIN Photodiode Array Market Size (M USD) (2019-2032)
Figure 6. Global InGaAs PIN Photodiode Array Sales (K Units) & (2019-2032)
Figure 7. Evaluation Matrix of Segment Market Development Potential (Type)
Figure 8. Evaluation Matrix of Segment Market Development Potential (Application)
Figure 9. Evaluation Matrix of Regional Market Development Potential
Figure 10. InGaAs PIN Photodiode Array Market Size by Country (M USD)
Figure 11. InGaAs PIN Photodiode Array Sales Share by Manufacturers in 2023
Figure 12. Global InGaAs PIN Photodiode Array Revenue Share by Manufacturers in 2023
Figure 13. InGaAs PIN Photodiode Array Market Share by Company Type (Tier 1, Tier 2 and Tier 3): 2023
Figure 14. Global Market InGaAs PIN Photodiode Array Average Price (USD/Unit) of Key Manufacturers in 2023
Figure 15. The Global 5 and 10 Largest Players: Market Share by InGaAs PIN Photodiode Array Revenue in 2023
Figure 16. Evaluation Matrix of Segment Market Development Potential (Type)
Figure 17. Global InGaAs PIN Photodiode Array Market Share by Type
Figure 18. Sales Market Share of InGaAs PIN Photodiode Array by Type (2019-2025)
Figure 19. Sales Market Share of InGaAs PIN Photodiode Array by Type in 2023
Figure 20. Market Size Share of InGaAs PIN Photodiode Array by Type (2019-2025)
Figure 21. Market Size Market Share of InGaAs PIN Photodiode Array by Type in 2023
Figure 22. Evaluation Matrix of Segment Market Development Potential (Application)
Figure 23. Global InGaAs PIN Photodiode Array Market Share by Application
Figure 24. Global InGaAs PIN Photodiode Array Sales Market Share by Application (2019-2025)
Figure 25. Global InGaAs PIN Photodiode Array Sales Market Share by Application in 2023
Figure 26. Global InGaAs PIN Photodiode Array Market Share by Application (2019-2025)
Figure 27. Global InGaAs PIN Photodiode Array Market Share by Application in 2023
Figure 28. Global InGaAs PIN Photodiode Array Sales Growth Rate by Application (2019-2025)
Figure 29. Global InGaAs PIN Photodiode Array Sales Market Share by Region (2019-2025)
Figure 30. North America InGaAs PIN Photodiode Array Sales and Growth Rate (2019-2025) & (K Units)
Figure 31. North America InGaAs PIN Photodiode Array Sales Market Share by Country in 2023
Figure 32. U.S. InGaAs PIN Photodiode Array Sales and Growth Rate (2019-2025) & (K Units)
Figure 33. Canada InGaAs PIN Photodiode Array Sales (K Units) and Growth Rate (2019-2025)
Figure 34. Mexico InGaAs PIN Photodiode Array Sales (Units) and Growth Rate (2019-2025)
Figure 35. Europe InGaAs PIN Photodiode Array Sales and Growth Rate (2019-2025) & (K Units)
Figure 36. Europe InGaAs PIN Photodiode Array Sales Market Share by Country in 2023
Figure 37. Germany InGaAs PIN Photodiode Array Sales and Growth Rate (2019-2025) & (K Units)
Figure 38. France InGaAs PIN Photodiode Array Sales and Growth Rate (2019-2025) & (K Units)
Figure 39. U.K. InGaAs PIN Photodiode Array Sales and Growth Rate (2019-2025) & (K Units)
Figure 40. Italy InGaAs PIN Photodiode Array Sales and Growth Rate (2019-2025) & (K Units)
Figure 41. Russia InGaAs PIN Photodiode Array Sales and Growth Rate (2019-2025) & (K Units)
Figure 42. Asia Pacific InGaAs PIN Photodiode Array Sales and Growth Rate (K Units)
Figure 43. Asia Pacific InGaAs PIN Photodiode Array Sales Market Share by Region in 2023
Figure 44. China InGaAs PIN Photodiode Array Sales and Growth Rate (2019-2025) & (K Units)
Figure 45. Japan InGaAs PIN Photodiode Array Sales and Growth Rate (2019-2025) & (K Units)
Figure 46. South Korea InGaAs PIN Photodiode Array Sales and Growth Rate (2019-2025) & (K Units)
Figure 47. India InGaAs PIN Photodiode Array Sales and Growth Rate (2019-2025) & (K Units)
Figure 48. Southeast Asia InGaAs PIN Photodiode Array Sales and Growth Rate (2019-2025) & (K Units)
Figure 49. South America InGaAs PIN Photodiode Array Sales and Growth Rate (K Units)
Figure 50. South America InGaAs PIN Photodiode Array Sales Market Share by Country in 2023
Figure 51. Brazil InGaAs PIN Photodiode Array Sales and Growth Rate (2019-2025) & (K Units)
Figure 52. Argentina InGaAs PIN Photodiode Array Sales and Growth Rate (2019-2025) & (K Units)
Figure 53. Columbia InGaAs PIN Photodiode Array Sales and Growth Rate (2019-2025) & (K Units)
Figure 54. Middle East and Africa InGaAs PIN Photodiode Array Sales and Growth Rate (K Units)
Figure 55. Middle East and Africa InGaAs PIN Photodiode Array Sales Market Share by Region in 2023
Figure 56. Saudi Arabia InGaAs PIN Photodiode Array Sales and Growth Rate (2019-2025) & (K Units)
Figure 57. UAE InGaAs PIN Photodiode Array Sales and Growth Rate (2019-2025) & (K Units)
Figure 58. Egypt InGaAs PIN Photodiode Array Sales and Growth Rate (2019-2025) & (K Units)
Figure 59. Nigeria InGaAs PIN Photodiode Array Sales and Growth Rate (2019-2025) & (K Units)
Figure 60. South Africa InGaAs PIN Photodiode Array Sales and Growth Rate (2019-2025) & (K Units)
Figure 61. Global InGaAs PIN Photodiode Array Production Market Share by Region (2019-2025)
Figure 62. North America InGaAs PIN Photodiode Array Production (K Units) Growth Rate (2019-2025)
Figure 63. Europe InGaAs PIN Photodiode Array Production (K Units) Growth Rate (2019-2025)
Figure 64. Japan InGaAs PIN Photodiode Array Production (K Units) Growth Rate (2019-2025)
Figure 65. China InGaAs PIN Photodiode Array Production (K Units) Growth Rate (2019-2025)
Figure 66. Global InGaAs PIN Photodiode Array Sales Forecast by Volume (2019-2032) & (K Units)
Figure 67. Global InGaAs PIN Photodiode Array Market Size Forecast by Value (2019-2032) & (M USD)
Figure 68. Global InGaAs PIN Photodiode Array Sales Market Share Forecast by Type (2025-2032)
Figure 69. Global InGaAs PIN Photodiode Array Market Share Forecast by Type (2025-2032)
Figure 70. Global InGaAs PIN Photodiode Array Sales Forecast by Application (2025-2032)
Figure 71. Global InGaAs PIN Photodiode Array Market Share Forecast by Application (2025-2032)