Key Statistics
Key Takeaways
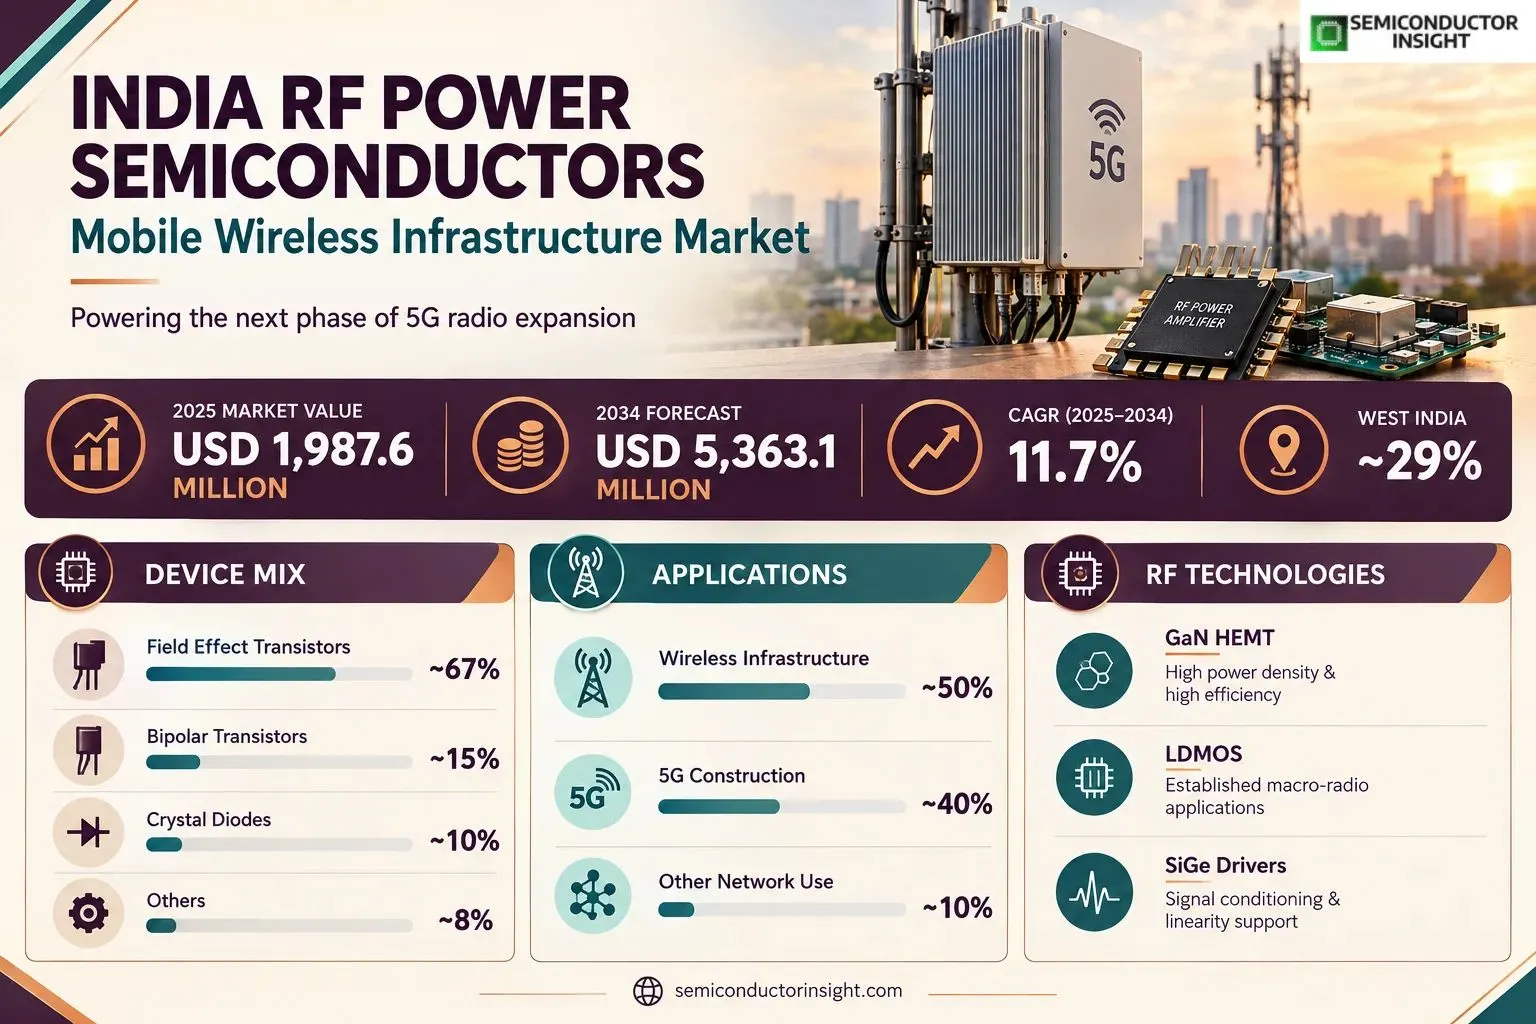
- Market trajectory: The India cellular-infrastructure RF power device market is valued at USD 1,987.558 million for 2025 and projected to reach USD 5,363.132 million in 2034, expanding at the modeled forecast CAGR over nine years as new radio installations, carrier additions and installed-site refreshes shape semiconductor demand.
- Geographic demand: West India leads the domestic allocation at ~29% in 2025, followed by North India at ~27%, South India at ~22%, East India at ~15% and Central & Northeast India at ~7%; these zones describe device procurement and deployment exposure rather than chip-fabrication origin.
- Technology mix: Field Effect Transistors account for an estimated ~67% of 2025 revenue, reflecting GaN HEMT and LDMOS output stages used in radio-frequency power amplifiers; Bipolar Transistors represent ~15%, Crystal Diodes ~10%, and the remaining Others category ~8%.
- Applications: Wireless Infrastructure contributes ~50% of modeled sales, with 5G Construction at ~40% and other telecom-network uses at ~10%; the application split differentiates radio-site maintenance and upgrades from capital-intensive 5G expansion without adding operator service revenue.
- Demand evidence: India reported more than 5.18 lakh deployed 5G base transceiver stations by February 2026, with coverage across 776 of 777 districts; these deployment figures demonstrate addressable network scale but cannot be converted directly into RF semiconductor revenue.
- Product evidence: NXP documents GaN and LDMOS infrastructure portfolios; Qorvo lists a 45 W GaN-on-SiC RF transistor and 39 GHz front-end components; MACOM offers 70 W, 125 W and higher-output cellular power-amplifier products for specific frequency bands.
- Commercial bottlenecks: Radio-vendor design qualification, efficiency at backed-off power, thermal dissipation and local supply-chain support determine which suppliers secure multi-year socket positions; the device market is not equivalent to the value of the finished base station or tower.
- Coverage: The analysis spans 2025–2034, compares Crystal Diode, Bipolar Transistor, Field Effect Transistor and Others, and distinguishes Wireless Infrastructure, 5G Construction and Others across five India domestic zones using estimated segment allocations.
India RF Power Semiconductor Devices for Mobile Wireless Infrastructure Market Overview
India RF power semiconductor devices for mobile wireless infrastructure market reached USD 1,987.558 million in 2025 and is projected to total USD 5,363.132 million by 2034, representing a 11.7% CAGR during 2025–2034. West India accounts for the largest modeled 2025 share at ~29%, followed by North India at ~27%, while Field Effect Transistors are the dominant device type at ~67% of revenue.
The revenue boundary comprises RF power semiconductor transistors, power-amplifier semiconductor modules and supporting RF power-driver devices bought for Indian cellular radio infrastructure. It covers macro base stations, active antenna systems, massive-MIMO radio units, small cells and their associated RF output stages, regardless of whether the chip is fabricated domestically or imported. Smartphones and their front-end power amplifiers, finished base stations, passive tower structures, telecom operator subscription receipts, standalone semiconductor substrates and radar-only or satellite-only components are outside this definition. The distinction prevents telecom capital expenditure from being mistaken for component sales.
The technical demand center is the power amplifier between a transceiver and an antenna. In an active antenna array, dozens of signal paths may require tightly controlled gain, linearity and efficiency, so the number of semiconductor power stages can rise even when the number of physical towers is unchanged. Modern base-station radios use devices suited to different frequency bands, output levels and efficiency targets: GaN HEMTs provide attractive power density, LDMOS remains established in many macro-radio applications, and SiGe drivers help condition signals before the final RF stage. A single radio bill of materials therefore combines different semiconductor technologies.
India’s February 2026 communications disclosure recorded more than 518,000 installed 5G base transceiver stations and 5G availability in 776 of 777 districts, demonstrating a large installed network that requires upgrades and replacement over its service life. Maharashtra alone had 54,261 5G BTS by the end of December 2025, including 8,260 in Pune district, according to the same government release. These infrastructure counts are indicators of potential RF hardware demand rather than measurements of semiconductor invoices; site architectures, number of antenna paths, radio configurations and inventory timing vary substantially.
The product evidence shows why a one-device-per-tower model would misstate the market. Qorvo specifies the QPD0030 as a 45 W GaN-on-SiC HEMT operating from DC to 5 GHz and suitable for cellular base-station power-amplifier output or driver stages. MACOM lists cellular devices such as the WSDC2642 at 125 W for 2.496–2.690 GHz and the MAPC-C38075-AD at 70 W for 3.400–3.800 GHz. Those catalogue ratings represent component specifications, not India sales, but they explain how a network expansion can shift demand toward higher-value RF power devices.
A 5G rollout progresses through several procurement cycles rather than one uniform order. Initial network coverage favors complete radio deployments; later phases add spectrum carriers, sector capacity, rural coverage and indoor densification, each changing the RF power device mix. The modeled 2025 application distribution assigns ~40% of device revenue to 5G Construction, ~50% to the broader Wireless Infrastructure installed base and ~10% to other network use. These are analytical allocations of the title-specific India market, not official market shares reported by the Department of Telecommunications or a vendor.
The five-zone demand profile follows radio-site density, telecom equipment procurement, manufacturing ecosystems and the pace of network extension. West India leads at ~29%, while North India contributes ~27% and South India ~22%; East India and Central & Northeast India account for ~15% and ~7% respectively. Domestic location here refers to the end-use and procurement ecosystem, not the geographic origin of GaN epitaxy, LDMOS wafer fabrication or finished semiconductor packaging. International chip manufacturers and Indian radio-system integrators therefore occupy distinct positions in the value chain.
Endpoint-reconciled growth is used for the market outlook: the India-specific 2024 value of USD 1,780 million and the 2030 endpoint of USD 3,450 million imply an annual rate of roughly 11.66%, consistent with the rounded headline CAGR. Applying the same trajectory produces a 2025 base value, a 2026 estimate of USD 2,219.319 million and the 2034 endpoint-reconciled projection. The growth profile depends on sustained cellular equipment procurement and mix improvement, while pricing competition and radio-platform qualification limit the pace at which higher unit demand becomes higher device revenue.
Segment Analysis: By Type
Field Effect Transistors lead the 2025 India cellular infrastructure RF power market at an estimated ~67% share and about ~12.4% modeled CAGR, with Bipolar Transistors at ~15%, Crystal Diodes at ~10% and Others at ~8%. The dominance of GaN and LDMOS output-stage devices is consistent with 5G radio requirements for high power density, efficient operation and linearized transmission under changing traffic loads.
| Type | Technical role in cellular radios | Commercial position and growth outlook |
|---|---|---|
| Field Effect Transistor | GaN HEMT and LDMOS power stages dominate high-efficiency cellular transmitters. Radio designers use FET architectures to manage heat, drain efficiency and output linearity across frequency bands from sub-1 GHz coverage to multi-GHz capacity layers. Qorvo QPD0030 and NXP macro-radio portfolios show the range of transistor-level choices; qualification for 5G active antennas can keep a winning device in the same radio platform for several procurement years. | Estimated ~67% of 2025 revenue and ~12.4% modeled CAGR. High-power FET device value is concentrated in radio output stages that demand both efficiency and a compact thermal path; vendor qualification is especially important when a 5G active antenna integrates many separate amplifier chains. The modeled share is a revenue allocation, not a census of physical packages or a disclosed India shipment count. |
| Bipolar Transistor | Bipolar technologies remain relevant in RF driver functions and established radio designs, even as GaN and LDMOS account for most of the output-power value. The segment is influenced by the installed base of older macro-radio architectures and by suppliers seeking predictable linearity and manufacturability. A lower modeled CAGR than FET reflects substitution in new high-power output stages, not an immediate disappearance of bipolar devices from radio electronics. | Estimated ~15% of 2025 revenue and ~10.7% modeled CAGR. Bipolar device procurement is influenced by legacy radio families and lower-power gain stages where design continuity can outweigh a new process node. Because a change in driver architecture alters board matching and linearity testing, purchasing can remain steady even as GaN gains final-stage sockets in new massive-MIMO systems. |
| Crystal Diode | The crystal-diode category captures specialist semiconductor junction functions in RF power circuits, including detection and control support, rather than treating every diode as the principal output amplifier. The contribution is smaller than FET because cellular output stages need gain and power conversion rather than only rectification or detection. Growth follows radio-board volumes and maintenance, with a modeled ~9.8% annual trajectory compared with faster GaN-rich active-antenna spending. | Estimated ~10% of 2025 revenue and ~9.8% modeled CAGR. Crystal diode revenue follows supporting RF detection, protection and control functions rather than the main gain-producing output path. Designers compare switching behavior, temperature stability and package compatibility, which creates a narrower value pool than for active transistors even when a complex radio board contains multiple semiconductor junctions. |
| Others | Other RF power semiconductor devices include qualifying integrated RF stages and supporting device architectures not separately named in the three principal publisher categories. This residual grouping is deliberately restricted to components serving cellular infrastructure, excluding digital baseband processors, tower power supplies and handset radio chips. Demand remains tied to board redesigns, integration decisions and maintenance of radio families with specialized power and frequency requirements. | Estimated ~8% of 2025 revenue and ~9.0% modeled CAGR. The residual group captures specialized semiconductor stages whose commercial role depends on the exact radio design and qualification package. It does not include digital baseband processors, passive antennas or unrelated consumer electronics; its slower modeled expansion reflects gradual integration and limited high-value socket opportunities relative to the primary FET category. |
RF transistor selection and the amplifier chain
A cellular RF power amplifier is designed as a chain rather than a stand-alone transistor. Small-signal conditioning, pre-driver gain, driver gain and final-stage output each impose different noise, linearity and thermal requirements, while predistortion algorithms correct nonlinearity at the system level. At 3.3–4.2 GHz, a SiGe driver such as Infineon BGAP2S30A may occupy a different socket from the GaN output device, so the supplier portfolio must be interpreted by device function rather than by an undifferentiated list of RF parts.
The relevant commercial benchmark is qualification in a radio architecture. A device that delivers 70 W or 125 W on a data sheet may not substitute directly for another with a different supply rail, package or efficiency profile. Buyers test gain flatness, spectral regrowth, error vector magnitude and lifetime under high temperature; these tests create barriers to rapid supplier substitution. The FET share of ~67% therefore reflects the value of the high-power output chain and does not imply that 67% of all individual semiconductor packages in a base station are transistors.
Segment Analysis: By Application
The application model separates installed-network Wireless Infrastructure at ~50% of 2025 device revenue from new 5G Construction at ~40% and other telecom radio uses at ~10%. The division recognizes that base-station modernization and capacity additions can generate RF power semiconductor purchases without a new tower being erected; site counts and procurement timing therefore measure related but different activity.
| Application | Demand characteristics |
|---|---|
| Wireless Infrastructure | Estimated ~50% share in 2025, with ~10.9% modeled CAGR. Radio replacements, carrier additions, rural network maintenance and sector upgrades sustain demand across mature 4G and growing 5G infrastructure. The category covers RF power transistors and semiconductor amplifier modules inside radio equipment, not the total radio equipment invoice or operator operating expenditure. Device sourcing often follows long platform qualification cycles. |
| 5G Construction | Estimated ~40% share and ~13.1% modeled CAGR. New macro radios, massive-MIMO panels, small cells and high-band capacity layers require power amplification at the antenna interface. The 5G rollout reaches 776 of 777 Indian districts, but subsequent traffic-driven densification changes the number of transmit chains per site and can raise semiconductor value even where coverage maps are nearly complete. |
| Others | Estimated ~10% share and ~9.1% modeled CAGR. The residual includes qualifying cellular network specialty radios, test-driven replacements and ancillary telecom RF power applications that are not fully captured by the main categories. It excludes satellite-only terminals, military radar, consumer handsets and unrelated industrial RF heating, preserving a revenue boundary linked to India mobile wireless infrastructure. |
The application mix depends on whether spending is driven by geographic coverage, network quality or a platform transition. The same physical cell site can support 4G and 5G equipment, several bands and multiple antenna sectors, so counting sites does not establish the number or value of RF semiconductor sockets. Radio vendors specify exact amplifier configurations, and operator orders are translated into semiconductor purchases through component distributors, contract manufacturers and board suppliers with their own lead times.
In the 2025 baseline, the 5G Construction category grows faster than the established Wireless Infrastructure segment because radio architectures are changing as coverage extends and operators add capacity. The modeled ~13.1% CAGR for new construction compares with ~10.9% for installed-network demand, while Others grow near ~9.1%. These assumptions explain the revenue mix over 2025–2034 without suggesting that a government rollout count has been converted into a semiconductor shipment forecast.
Regional Analysis
Within India, modeled 2025 demand is led by West India at ~29%, North India at ~27% and South India at ~22%, with East India contributing ~15% and Central & Northeast India ~7%. The ranking describes where cellular RF power devices are consumed through installed radio networks, not the location of semiconductor wafer production. South India is modeled to grow fastest at ~12.4% CAGR, reflecting engineering-intensive radio upgrades and capacity deployment.
How do Indian domestic zones differ in RF power semiconductor demand?
The geographic allocation balances metropolitan traffic, manufacturing and engineering activity, transport networks and rural coverage requirements. Device revenue depends on the number of radio paths and the mix of frequency bands, which means a district with fewer BTS can still buy higher-value GaN devices if it upgrades active antenna systems. Official DoT and TRAI datasets support network deployment patterns, but the five-zone shares and growth rates are modeled rather than direct official revenue observations.
| Region | Position | Growth outlook | Demand profile | What decides supplier selection |
|---|---|---|---|---|
| West India | ~29% of 2025 market | ~11.2% CAGR | commercial procurement and high-density metropolitan networks | Radio-vendor qualification, operating efficiency and local service economics across Maharashtra, Gujarat, Goa |
| North India | ~27% of 2025 market | ~11.5% CAGR | metro densification, government networks and northern transport corridors | Radio-vendor qualification, operating efficiency and local service economics across Delhi NCR, Haryana, Uttar Pradesh, Punjab, Rajasthan |
| South India | ~22% of 2025 market | ~12.4% CAGR | engineering clusters and rapid capacity refresh | Radio-vendor qualification, operating efficiency and local service economics across Karnataka, Telangana, Tamil Nadu, Kerala, Andhra Pradesh |
| East India | ~15% of 2025 market | ~11.9% CAGR | coverage extension and selective urban capacity | Radio-vendor qualification, operating efficiency and local service economics across West Bengal, Odisha, Bihar, Jharkhand |
| Central & Northeast India | ~7% of 2025 market | ~11.2% CAGR | connectivity extension and difficult-site reliability | Radio-vendor qualification, operating efficiency and local service economics across Madhya Pradesh, Chhattisgarh, Assam, other northeastern states |
India RF Power Semiconductor Competitive Landscape
Competition is organized around international RF semiconductor portfolios and the telecom equipment manufacturers that qualify them. NXP, Qorvo, MACOM and Infineon document relevant cellular RF power products, while local procurement is commonly mediated through radio equipment vendors, design partners and authorized component channels. Product specifications establish technical participation, not India-specific shipment volume or supplier market share.
NXP offers a broad cellular-infrastructure RF portfolio including GaN-on-SiC and LDMOS power devices for macro remote radio heads and active antenna systems. The company’s 3.2–6 GHz active antenna category addresses frequencies used in high-capacity radio networks, where gain, linearity and operating efficiency determine amplifier-chain performance. Catalogue breadth can shorten a radio vendor’s design search, but each qualified socket still requires board-level verification and lifecycle support; a supplier’s total RF portfolio revenue cannot be assigned to India from product-page availability.
Qorvo has multiple RF power architectures relevant to base stations, including its QPD0030 GaN transistor, a 45 W part specified for DC–5 GHz, and QPF4005 and QPF4006 devices for 39 GHz active antenna applications. These offerings illustrate a range from discrete final-stage devices to more integrated high-frequency front ends. They should not be conflated with radar-only or satellite-only parts in the same corporate portfolio, nor should a technical-document revision date be represented as a new commercial launch.
MACOM’s cellular power portfolio includes high-output amplifiers such as WGC18630 at 610 W across 1.805–1.880 GHz, WGC27630 at 600 W across 2.620–2.690 GHz and the 70 W MAPC-C38075-AD for 3.4–3.8 GHz. These figures describe output capability and operating bands, not national revenue or shipments. The competitive implication is that network architecture and spectrum band define which semiconductor modules can be qualified, while RF efficiency, ruggedness and support determine repeat orders.
Infineon participates through RF drivers such as BGAP2S20A for 2.3–2.7 GHz and BGAP2S30A for 3.3–4.2 GHz, emphasizing that driver and final-output roles need different comparisons. A SiGe driver may be essential in a GaN output chain without being the high-power final transistor. Indian radio vendors, systems integrators and telecom operators shape qualification and purchasing, but those downstream organizations should not be relabeled as independent producers of RF power semiconductors without device-level evidence.
Tier structure
| Tier | Companies | Basis of competition |
|---|---|---|
| Core cellular RF device suppliers | NXP Semiconductors; Qorvo; MACOM | Documented macro-radio, massive-MIMO and base-station GaN or LDMOS power transistor and amplifier portfolios; competition centers on output power, frequency coverage, drain efficiency and OEM qualification rather than publicly established India-only market shares. |
| RF driver and supporting semiconductor suppliers | Infineon Technologies; NXP Semiconductors | Driver stages and related RF semiconductors for 2.3–2.7 GHz, 3.3–4.2 GHz and wider infrastructure applications, where integration into radio-board designs can secure repeat demand but is not identical to final-output transistor revenue. |
| Downstream qualification ecosystem | Radio equipment OEMs; Indian electronics design houses; authorized distributors | These participants integrate or purchase RF devices rather than necessarily fabricating the power semiconductors. Their purchasing specifications determine supplier access, qualification timing, field reliability obligations and after-sales support for national telecom projects. |
Key companies profiled
- NXP Semiconductors
- Qorvo
- MACOM Technology Solutions
- Infineon Technologies
RF Power Semiconductor Manufacturing and Supply Analysis for India
Indian demand is served through a global semiconductor supply chain and domestic telecom equipment integration. Crystal growth, GaN and LDMOS wafer processing, advanced RF packaging, final radio-board assembly and operator installation can take place in different countries, so installed radio-site growth does not establish local RF transistor fabrication. The principal commercial constraint is obtaining reliable, qualified power stages at competitive landed cost.
The upstream chain begins with GaN-on-SiC and silicon-based RF device processes, followed by fabrication, die attach, thermal packaging and electrical test. At output powers such as 45 W, 70 W or 125 W, package thermal resistance and drain-bias requirements materially affect radio-board design, while 600 W-class modules require different mechanical and heat-spreading arrangements. Import-dependent supply exposes Indian radio integrators to foreign manufacturing lead times and currency movements, although the location of the wafer fab is not a measure of the domestic market value.
The manufacturing interface in India is often the radio equipment system, not the semiconductor wafer. Engineers choose transistors and driver amplifiers alongside filters, power supplies, antennas and predistortion software; design changes can require thermal and electromagnetic compatibility requalification. Equipment vendors therefore value long production lifetimes and predictable documentation. The presence of a 5G tower in a state does not prove that its amplifier module was designed or assembled there, and component demand should be attributed to procurement rather than inferred manufacturing capacity.
A qualified RF power device typically remains embedded in a radio product for multiple purchasing cycles, but capacity additions can change the demand profile rapidly when operators deploy new frequency layers. Procurement planning must track the radio vendor’s order book, component inventory, alternative-source approvals and field failure rates. Distributors can help bridge lead times for replacement units, while high-power GaN packages often require closer supplier engineering involvement than commodity control semiconductors. These differences support a supply-chain analysis centered on qualification and lifecycle availability.
India RF Power Semiconductor Market Dynamics, Drivers and Opportunities
The 2025–2034 outlook reflects 5G radio densification, upgrades of existing base stations, increasing RF power-device content per antenna system, and procurement for new spectrum and coverage layers. These drivers are tempered by semiconductor price negotiation, design qualification time, thermal-management costs and radio-platform concentration. The modeled positive contributions total +17.20 percentage points, offset by −5.50 points of restraints, yielding the headline 11.7% annual growth rate.
MARKET DRIVERS
Drivers Impact Analysis*
| Market Drivers | Impact Rank | CAGR Contribution (%) | 2026–2028 | 2029–2031 | 2032–2034 |
|---|---|---|---|---|---|
| 5G radio expansion and capacity densification | High | +5.20% | High | High | Medium |
| Massive-MIMO and higher RF device content per radio | High | +4.10% | High | High | High |
| Legacy network upgrades and replacement cycles | Medium-High | +3.20% | Medium | High | High |
| Higher-efficiency GaN and LDMOS output-stage adoption | Medium | +2.70% | Medium | High | High |
| New spectrum bands and small-cell deployment | Low-Medium | +1.20% | Low | Medium | High |
| Others (private-network-adjacent radio demand and service spares) | Low | +0.80% | Low | Medium | Medium |
5G radio deployment extends semiconductor demand
India’s 5G network reached more than 518,000 base transceiver stations by February 2026, and service was reported in 776 of 777 districts. The next phase is not simply first-time coverage: operators can densify high-traffic locations, add sectors and install higher-capacity active antennas. Each change affects RF amplifier configurations and may increase the semiconductor value of a site without producing a proportional increase in the count of towers.
Massive-MIMO raises component value per antenna
A massive-MIMO radio divides transmitted energy across many antenna paths, each with its own amplification and signal-conditioning needs. This favors RF power devices offering efficiency under backed-off operation, repeatable linearity and thermal robustness. The modeled +4.10-point driver contribution reflects higher content per radio rather than a claim that every site installs the same number of GaN devices, and it can persist after nationwide 5G geographic coverage matures.
Replacement spending supports the installed base
Telecom radios have finite service lives and can be replaced because of component failures, band changes, energy costs or equipment-vendor refresh programmes. RF output devices are purchased through these equipment cycles, not only when an operator adds a new base station. The large 2025 installed network supports recurring demand for LDMOS, GaN and driver components, although replacement intensity differs between dense cities and low-traffic rural sites.
GaN power density changes the amplifier bill of materials
GaN devices can reduce the physical area needed for high-power RF stages and support demanding high-frequency radio designs, while established LDMOS devices remain competitive for some bands and power levels. The transition is therefore a selective substitution process, not a universal replacement. NXP, Qorvo and MACOM product portfolios show that output power, gain and package choices vary substantially, so supplier revenue growth depends on winning qualified applications with meaningful device value.
MARKET RESTRAINTS
Restraints Impact Analysis*
| Market Restraints | Impact Rank | CAGR Contribution (%) | 2026–2028 | 2029–2031 | 2032–2034 |
|---|---|---|---|---|---|
| Radio-vendor qualification and design lock-in | High | -2.10% | High | Medium | Medium |
| RF thermal design and power-efficiency costs | Medium-High | -1.60% | High | High | Medium |
| Import dependence and tender price pressure | Medium | -1.10% | High | Medium | Medium |
| Others (site power limitations and inventory cycles) | Low | -0.70% | Medium | Medium | Low |
Qualification cycles limit rapid supplier switching
RF power devices are integrated into radio designs with detailed tests for distortion, spectral emissions, temperature and long-term reliability. Replacing a 45 W GaN transistor with another catalogue part can require changes to matching networks, biasing and cooling, followed by renewed validation. These costs can delay product adoption even when a technically attractive alternative is available, particularly when a radio vendor has a mature, deployed amplifier platform.
Thermal management creates hidden system cost
A device’s rated output wattage does not indicate the full energy consumed by its radio board. Drain efficiency, backed-off operation, heat-sink requirements and environmental temperature affect operating expense and failure risk. Indian sites in hot or humid regions can impose demanding conditions on outdoor radio units, and radio vendors may favor an established part with verified field reliability over a lower-priced device lacking long-term performance data.
Tender economics pressure device selling prices
Large telecom procurement contracts are negotiated through a small number of equipment platforms, giving buyers leverage over semiconductor pricing and delivery terms. Imported components also expose suppliers and integrators to exchange-rate changes and logistics costs. Unit volumes can therefore grow faster than device revenue, and broad vendor product-line sales cannot be used as a substitute for the value of qualified RF power components sold into Indian networks.
MARKET OPPORTUNITIES
Efficient radio retrofits and platform redesigns
Existing macro sites provide an installed base for energy-efficiency upgrades, especially where operators add capacity without acquiring a new tower location. Semiconductor vendors able to demonstrate lower power loss at relevant backed-off output levels can win sockets in redesigned amplifiers. The commercial opening depends on proving system-level savings under Indian field conditions rather than comparing peak datasheet efficiency alone.
Localized application engineering and test support
Indian radio equipment developers and integrators benefit from nearby engineering assistance for impedance matching, thermal modeling, linearization and production test. Global semiconductor suppliers can improve access by supporting evaluation boards, reference designs and authorized distribution in domestic engineering clusters. Such localization is a service and qualification opportunity, not proof of local GaN wafer fabrication or independent device revenue from those service activities.
Band-specific GaN and driver portfolio expansion
The coexistence of lower-frequency coverage radios and 3.3–4.2 GHz capacity layers creates room for multiple RF technologies. Vendors offering interoperable drivers and final-stage devices can address more radio designs than suppliers limited to one band. Qorvo’s 39 GHz front-end products are technically relevant to high-band radio architectures, but their presence in a catalogue does not establish a specific Indian commercial deployment volume.
Network expansion outside top metropolitan areas
Coverage and capacity upgrades across eastern, central and northeastern states require rugged, efficient radio designs that tolerate difficult maintenance conditions. Suppliers that maintain long product availability and strong field support can benefit from these deployments even when absolute regional demand is below that of West or North India. Procurement opportunities arise through telecom OEM qualification rather than direct purchases by tower owners.
India Cellular RF Power Semiconductor Supply Chain
The supply chain links compound-semiconductor materials and silicon RF processing to packaged power devices, radio-board integration, telecom equipment qualification and operator deployment. RF transistor specifications determine performance, but radio vendors control the immediate purchasing relationship for most deployments. India’s role includes radio engineering, procurement and installation alongside internationally sourced semiconductor devices.
Upstream materials and device fabrication. GaN-on-SiC HEMTs and silicon-based LDMOS structures require different epitaxial and device processing steps, with performance influenced by defect control, breakdown voltage and heat dissipation. Suppliers may package the resulting die into discrete RF transistors or larger amplifier modules. The Indian market measures devices incorporated into domestic cellular networks regardless of manufacturing origin, so a foreign wafer-fab expansion is a supply-side signal rather than India-specific device revenue.
Power-amplifier production and testing. Packaged RF output stages must meet target frequency, output power, efficiency, gain and linearity under temperature variation. MACOM’s listed 70 W and 125 W cellular products and Qorvo’s 45 W GaN transistor illustrate different design envelopes; no single specification can stand in for all base-station radios. Production tests and radio-vendor validation add cost but protect operators from high maintenance expense once radios are installed on towers.
Equipment procurement and channel structure. Most device demand is transmitted through radio equipment manufacturers, component distributors and contract assemblers rather than by direct semiconductor purchases from mobile subscribers or tower landlords. A supplier that wins a radio-board design can see repeat purchases over several years, while losing qualification can exclude it from a large installed platform. Procurement records and installed BTS counts are therefore complementary but not interchangeable indicators.
Downstream network use. India’s reported 5G coverage across 776 of 777 districts and its base-station expansion create a substantial installed population of radio amplifiers. Operators then invest in maintenance, traffic capacity and energy efficiency, which generate device demand over a different timetable from first-time network launches. The supply chain ends with functioning cellular radio hardware, while telecom subscription fees and spectrum payments remain outside the semiconductor revenue boundary.
Recent Developments Affecting India RF Power Semiconductor Demand
- 12 October 2026 Published
TRAI released its April–June 2026 Indian Telecom Services Performance Indicators, adding an official quarterly view of network adoption and operator activity. The update provides a fresh demand-context checkpoint for radio upgrades and equipment investment, but it does not report revenue from GaN, LDMOS or other RF power semiconductor components. Network indicators must therefore be combined with qualified radio architecture assumptions. Source - 5 October 2026 Published
TRAI listed the 2025–2026 annual performance indicators for the Indian telecommunications sector, offering an updated national reference for mobile network scale and service activity. This annual dataset is useful for comparing demand across procurement periods and for distinguishing network deployment from component-level sales, which remain separately modeled in the semiconductor market. Source - 22 June 2026 Published
TRAI released January–March 2026 telecom performance indicators, extending the quarterly record used to track mobile network evolution. For RF power device suppliers, the significance is visibility into a changing installed radio base and demand for capacity upgrades; the release itself is a regulator’s sector report, not a manufacturer announcement of new power transistors. Source - 9 June 2026 Reported
The Press Information Bureau published a national 5G infrastructure update describing more than 5.08 lakh base transceiver stations and the spread of service availability. Such deployment evidence supports a larger addressable base for power-amplifier devices and replacement parts, while the precise semiconductor revenue per site depends on radio type, antenna paths and component procurement schedules. Source - 6 February 2026 Reported
The Department of Telecommunications reported more than 5.18 lakh 5G BTS and coverage in 776 of 777 districts, with Maharashtra recording 54,261 5G BTS as of 31 December 2025. This detailed geographic evidence helps frame regional radio demand, but the installed counts do not specify the number of qualified GaN or LDMOS output stages purchased. Source - 3 December 2025 Published
TRAI issued the July–September 2025 telecom performance indicators, documenting the mobile sector during a period of 5G coverage consolidation. The figures help assess whether operator activity is shifting toward additional traffic capacity and radio modernization; they should not be interpreted as a new RF semiconductor launch or an audited estimate of India’s amplifier-chip revenue. Source - 3 September 2025 Published
TRAI published the April–June 2025 telecom performance indicators, giving a mid-year baseline for network-service development and later radio-site comparisons. Device suppliers can use this timing to understand infrastructure demand cycles, while maintaining the distinction between network installations and component procurement. The update is regulatory evidence adjacent to RF power semiconductors rather than a direct manufacturer sales disclosure. Source
REPORT SCOPE & SEGMENTATION
| Attribute | Details |
|---|---|
| Study Period | 2021–2034 |
| Base Year | 2025 |
| Estimate Year | 2026 |
| Forecast Period | 2025–2034 |
| Historical Period | 2021–2024 |
| 2025 Market Size | USD 1,987.558 million |
| 2026 Market Estimate | USD 2,219.319 million |
| 2034 Forecast | USD 5,363.132 million |
| Growth Rate | CAGR 11.7% over 2025–2034 |
| Unit | Revenue in USD million; market shares modeled for 2025 |
| Market Boundary | RF power semiconductors and RF power modules supplied into India mobile wireless infrastructure; excludes handset chips and finished base stations |
| By Type | Crystal Diode · Bipolar Transistor · Field Effect Transistor · Others |
| By Application | Wireless Infrastructure · 5G Construction · Others |
| By Region | Five India domestic demand zones; zone shares are modeled 2025 revenue allocations rather than chip manufacturing origin West IndiaMaharashtra, Gujarat, Goa North IndiaDelhi NCR, Haryana, Uttar Pradesh, Punjab, Rajasthan South IndiaKarnataka, Telangana, Tamil Nadu, Kerala, Andhra Pradesh East IndiaWest Bengal, Odisha, Bihar, Jharkhand Central & Northeast IndiaMadhya Pradesh, Chhattisgarh, Assam and other northeastern states |
| Key Companies Profiled | NXP Semiconductors; Qorvo; MACOM Technology Solutions; Infineon Technologies |
| Customization Scope | Country-zone detail, technology splits by GaN and LDMOS, 5G band architecture, OEM qualification and additional operator deployment scenarios can be tailored to research requirements. |
Frequently Asked Questions
How large is India’s RF power semiconductor market for mobile wireless infrastructure?
The market is valued at USD 1,987.558 million for 2025 and projected to reach USD 5,363.132 million by 2034, representing a 11.7% annual growth rate. The definition covers RF power devices and integrated RF power modules used in Indian cellular radio infrastructure. It excludes the finished base station, tower construction and mobile service receipts, so the forecast describes a semiconductor-level opportunity rather than telecom industry spending.
Which Indian zone has the highest modeled RF power device demand?
West India leads with an estimated ~29% of 2025 market value, supported by large radio networks and high-capacity metropolitan demand in Maharashtra and Gujarat. North India follows at ~27% and South India at ~22%, with East India ~15% and Central & Northeast India ~7%. These are modeled demand allocations and do not claim that semiconductor wafer fabrication occurs in the zone where a radio is deployed.
What is the leading RF power semiconductor type in this market?
Field Effect Transistors are the largest category at an estimated ~67% of 2025 revenue, reflecting the role of GaN HEMT and LDMOS devices in cellular power-amplifier output stages. Bipolar Transistors contribute ~15%, Crystal Diodes ~10% and Others ~8%. The allocation describes device revenue across publisher categories, not the count of individual semiconductor packages inside every radio board.
How are Wireless Infrastructure and 5G Construction distinguished?
Wireless Infrastructure covers installed-network upgrades, replacement and continuing radio-equipment procurement and accounts for ~50% of modeled 2025 demand. The 5G Construction category represents new radio deployments and capacity expansion at ~40%, while Others account for ~10%. A tower can be upgraded without being newly built, and equipment vendors can buy components months before installation, so these application categories cannot be inferred solely from BTS counts.
Which semiconductor manufacturers have relevant cellular RF portfolios?
NXP, Qorvo, MACOM and Infineon document cellular-infrastructure RF semiconductor offerings. NXP provides GaN and LDMOS macro-radio devices, Qorvo lists GaN base-station transistors and high-band front ends, MACOM specifies high-output cellular amplifiers, and Infineon supplies RF drivers. Catalogue availability establishes technical relevance but not the supplier’s India market share, domestic manufacturing status or sales revenue in the forecast period.
How do GaN and LDMOS technologies compete in cellular base stations?
GaN offers high power density and attractive performance in demanding RF output stages, while LDMOS remains established for many macro-radio frequency bands and legacy designs. Selection depends on power, frequency, linearity, thermal behavior and vendor qualification rather than a universal technology ranking. Driver semiconductors such as SiGe components may be used alongside either output-stage architecture, making a complete amplifier-chain view more useful than a single-chip comparison.
Does the 5G BTS count equal the number of RF power semiconductor devices sold?
No. India reported more than 518,000 5G base transceiver stations by February 2026, but one site can have multiple sectors, carriers and antenna paths, while component orders may precede installation. Different radio platforms use different transistor quantities and prices, and maintenance can generate purchases without adding a site. BTS statistics are demand context, not audited RF device unit shipments or semiconductor revenue.
What is the principal restraint on market growth?
Design qualification and platform lock-in are the strongest modeled restraint, with a −2.10-percentage-point contribution to the growth bridge. Radio vendors must verify gain, spectral emissions, efficiency, heat dissipation and field reliability before approving a power device. Tender price pressure, import dependence and site-power constraints further limit revenue conversion from rising radio deployments, particularly when mature amplifier designs remain in service for several years.
How does the Indian geographic forecast account for chip imports?
The five-zone model allocates revenue by the location of Indian radio demand and procurement exposure, not by the wafer fabrication plant. A GaN device made abroad and installed in a radio serving Maharashtra counts within the Indian end-use market, while foreign semiconductor production for unrelated networks is excluded. This distinction is essential because telecom equipment integration, RF packaging and semiconductor crystal growth may occur in different jurisdictions.
What years, categories and regions are included in the study?
The study uses 2025 as its base year, estimates 2026 demand and projects 2034 value, with the stated 2025–2034 annual growth rate. It covers four device types, three application categories and five domestic zones: West, North, South, East and Central & Northeast India. The revenue boundary is cellular-infrastructure RF power semiconductors and associated modules rather than consumer devices, general-purpose chips or complete telecom systems.
Research Sources & Evidence Base
Get Sample Report PDF for Exclusive Insights
Report Sample Includes
- Table of Contents
- List of Tables & Figures
- Charts, Research Methodology, and more...
 Download Sample Report PDF