MARKET INSIGHTS
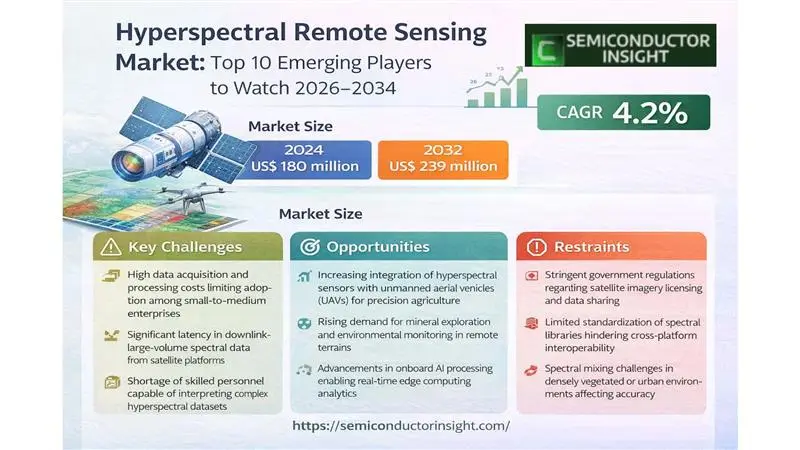
Global Hyperspectral Remote Sensing Market was valued at 180 million in 2024 and is projected to reach USD 239 million by 2032, at a CAGR of 4.2% during the forecast period.
Hyperspectral remote sensing, also known as imaging spectroscopy, is an advanced analytical technique that captures and processes information across the electromagnetic spectrum. Unlike traditional remote sensing, which collects data in a few broad bands, hyperspectral sensors acquire data in hundreds of contiguous narrow spectral bands. This high spectral resolution enables the precise detection and identification of materials based on their unique spectral signatures, making it invaluable for applications in mineralogy, agriculture, environmental monitoring, and defense.
The market’s growth is primarily driven by increasing adoption in precision agriculture for crop health monitoring and soil analysis, alongside expanding applications in environmental surveillance and military intelligence. However, the high cost of systems and data complexity present challenges to wider adoption. Key technological advancements, such as the miniaturization of sensors and the integration of artificial intelligence for data analysis, are creating new opportunities. Leading players like Headwall Photonics, SPECIM, and Corning Incorporated are continuously innovating to enhance sensor capabilities and reduce costs, further propelling the market forward.
Hyperspectral Remote Sensing Market MARKET DYNAMICS
Hyperspectral Remote Sensing Market MARKET DRIVERS
Advancements in Precision Agriculture to Drive Market Expansion
Hyperspectral remote sensing is revolutionizing precision agriculture by enabling detailed crop health monitoring, soil analysis, and resource optimization. This technology captures data across hundreds of narrow spectral bands, providing unprecedented insights into plant physiology, nutrient deficiencies, and water stress that are invisible to conventional imaging systems. Global precision agriculture market, valued at over D 9 billion in 2024, is experiencing robust growth due to increasing food security concerns and the need for sustainable farming practices. Recent deployments have demonstrated yield improvements of 15-20% through targeted interventions based on hyperspectral data analysis. Furthermore, integration with artificial intelligence and machine learning algorithms has enhanced the predictive capabilities of these systems, allowing farmers to make data-driven decisions that optimize inputs and maximize outputs.
Growing Defense and Security Applications to Boost Market Growth
The defense sector represents a significant growth driver for hyperspectral remote sensing, with applications ranging from surveillance and target detection to environmental monitoring and disaster response. Military organizations worldwide are investing in advanced intelligence, surveillance, and reconnaissance (ISR) capabilities, with hyperspectral imaging providing critical advantages in camouflage detection, material identification, and terrain analysis. Defense budgets allocated to ISR technologies have increased by approximately 8% annually over the past five years, reflecting the strategic importance of these capabilities. The technology’s ability to distinguish between natural and man-made materials with high accuracy makes it invaluable for border security, mine detection, and monitoring of critical infrastructure.
Environmental Monitoring and Climate Change Initiatives to Fuel Adoption
Increasing global focus on environmental conservation and climate change mitigation is driving substantial investments in earth observation technologies. Hyperspectral remote sensing provides unparalleled capabilities for monitoring carbon sequestration, detecting pollution sources, assessing ecosystem health, and tracking changes in land use patterns. Government agencies and research institutions are deploying these systems to meet international environmental commitments and regulations. The technology has proven particularly valuable in monitoring methane emissions from industrial facilities, detecting oil spills in marine environments, and assessing the health of coral reefs and forests. These applications are supported by growing public and private funding for environmental research and compliance monitoring.
Hyperspectral Remote Sensing Market MARKET RESTRAINTS
High System Costs and Complexity to Limit Market Penetration
The sophisticated nature of hyperspectral imaging systems creates significant cost barriers that restrain market growth. These systems require specialized sensors, precise calibration equipment, and advanced data processing capabilities, resulting in total costs that can exceed D 500,000 for high-performance airborne systems. The expense is further compounded by the need for specialized aircraft, trained operators, and complex data analysis software. While prices have decreased approximately 30% over the past decade due to technological advancements and increased competition, hyperspectral systems remain substantially more expensive than multispectral alternatives. This cost structure limits adoption primarily to well-funded government agencies, large research institutions, and major corporations, while smaller organizations and developing regions face accessibility challenges.
Data Processing and Storage Challenges to Hinder Operational Efficiency
Hyperspectral imaging generates enormous data volumes that present substantial processing and storage challenges. A single flight mission can produce several terabytes of data requiring specialized computing infrastructure and advanced algorithms for meaningful analysis. The computational intensity of processing hundreds of spectral bands often necessitates high-performance computing systems and specialized software expertise. Many organizations struggle with the infrastructure requirements and technical expertise needed to effectively utilize hyperspectral data, leading to delays in analysis and decision-making. Additionally, the storage and management of these large datasets require significant investment in data infrastructure and cloud computing resources, creating operational bottlenecks and increased total cost of ownership.
Regulatory and Airspace Restrictions to Constrain Deployment
Operational deployment of hyperspectral systems faces regulatory challenges related to airspace access, data privacy, and export controls. Airborne data collection is subject to complex aviation regulations that vary significantly across jurisdictions, creating compliance burdens for organizations operating internationally. Additionally, many countries have implemented strict data privacy and security regulations that affect how hyperspectral data can be collected, processed, and shared. Export control regulations further complicate international collaborations and technology transfer, particularly for dual-use applications with both civilian and military potential. These regulatory frameworks require substantial legal expertise and compliance resources, adding complexity and cost to hyperspectral remote sensing operations.
Hyperspectral Remote Sensing Market MARKET CHALLENGES
Technical Complexity and Integration Difficulties to Challenge Market Adoption
The integration of hyperspectral systems into existing operational frameworks presents significant technical challenges that hinder widespread adoption. These systems require specialized expertise in spectroscopy, remote sensing, and data science that is not readily available in many organizations. The complexity of calibrating sensors, processing spectral data, and interpreting results creates substantial barriers to entry for new users. Many potential customers lack the internal capabilities to effectively utilize hyperspectral technology and must rely on external consultants or service providers, increasing operational costs and reducing flexibility. Furthermore, integrating hyperspectral data with other geospatial information and enterprise systems requires sophisticated technical infrastructure and interoperability standards that are still evolving within the industry.
Other Challenges
Standardization and Interoperability Issues
The absence of universally accepted standards for data formats, calibration procedures, and quality metrics creates interoperability challenges across different hyperspectral systems. This lack of standardization complicates data sharing, comparative analysis, and system integration efforts. Organizations using equipment from multiple vendors often face compatibility issues that require custom solutions and additional processing steps. The industry’s relatively fragmented nature, with numerous small and medium-sized manufacturers developing proprietary solutions, exacerbates these standardization challenges and slows the development of cohesive ecosystem-wide solutions.
Atmospheric Interference and Environmental Limitations
Environmental factors significantly impact hyperspectral data quality and reliability. Atmospheric conditions, including cloud cover, humidity, and particulate matter, can distort spectral signatures and reduce data accuracy. Variations in solar illumination angles, seasonal changes, and weather conditions further complicate data collection and interpretation. These environmental challenges require sophisticated atmospheric correction algorithms and often necessitate multiple data collection attempts to obtain usable information. The operational limitations imposed by weather and atmospheric conditions reduce system reliability and increase the cost and complexity of obtaining high-quality hyperspectral data.
Hyperspectral Remote Sensing Market MARKET OPPORTUNITIES
Emerging Miniaturization and UAV Integration to Create New Application Areas
Recent advancements in sensor miniaturization and unmanned aerial vehicle (UAV) technology are creating significant growth opportunities for hyperspectral remote sensing. The development of compact, lightweight hyperspectral sensors weighing less than 2 kilograms has enabled deployment on small UAVs, dramatically reducing operational costs and expanding accessibility. This technological evolution has opened new application areas in precision agriculture, infrastructure inspection, and environmental monitoring where traditional airborne systems were previously cost-prohibitive. The UAV-based hyperspectral market segment has grown at approximately 25% annually over the past three years, representing the fastest-growing deployment platform category. This trend is expected to continue as sensor technology advances and regulatory frameworks for commercial drone operations mature.
Integration with Artificial Intelligence and Machine Learning to Enhance Value Proposition
The convergence of hyperspectral imaging with artificial intelligence and machine learning technologies presents substantial opportunities for market expansion. Advanced algorithms can automate the analysis of complex spectral data, reducing the need for specialized expertise and enabling real-time decision-making. Machine learning models trained on large hyperspectral datasets can identify patterns and anomalies that are imperceptible to human analysts, creating new insights across various applications. The integration of these technologies has demonstrated accuracy improvements of up to 40% in material classification and anomaly detection tasks. This technological synergy is particularly valuable for applications requiring rapid analysis of large areas, such as disaster response, agricultural monitoring, and security screening.
Expansion into New Industrial and Commercial Applications to Drive Growth
Beyond traditional applications in agriculture and defense, hyperspectral remote sensing is finding new opportunities in industrial quality control, healthcare, and consumer applications. Manufacturing industries are adopting hyperspectral technology for product inspection, material sorting, and process monitoring, leveraging its ability to detect subtle material variations and contaminants. The healthcare sector is exploring medical imaging applications that utilize spectral signatures for disease detection and tissue analysis. Even consumer applications are emerging, with potential uses in food quality assessment and personal health monitoring. These diverse applications represent significant growth potential as technology costs decrease and awareness of hyperspectral capabilities increases across various industry sectors.
HYPERSPECTRAL REMOTE SENSING MARKET TRENDS
Advancements in Artificial Intelligence and Machine Learning Integration
The integration of Artificial Intelligence (AI) and Machine Learning (ML) algorithms is revolutionizing hyperspectral data processing and analysis. While traditional methods for interpreting the vast data cubes generated by hyperspectral sensors were often time-consuming and required extensive expert knowledge, AI-driven automation is dramatically accelerating this process. Sophisticated neural networks can now be trained to identify subtle spectral signatures associated with specific materials, from mineral deposits to crop stress indicators, with a high degree of accuracy. This is unlocking new applications in precision agriculture, where algorithms can detect nutrient deficiencies or disease outbreaks before they become visible to the naked eye, and in environmental monitoring, enabling the rapid mapping of pollutants or changes in ecosystems. The ability to process terabytes of data in near-real-time is a key driver, making hyperspectral insights actionable for time-sensitive decision-making across various industries.
Other Trends
Miniaturization and Unmanned Aerial Vehicle (UAV) Deployment
The ongoing miniaturization of hyperspectral imaging sensors is a pivotal trend, directly enabling their widespread deployment on Unmanned Aerial Vehicles (UAVs) or drones. This shift is democratizing access to high-fidelity spectral data by significantly reducing the cost and logistical complexity previously associated with airborne or satellite-based systems. Drones equipped with compact hyperspectral cameras can capture data at extremely high spatial resolutions, often at a sub-centimeter level, which is unattainable for larger platforms. This capability is proving transformative for sectors like agriculture, where farmers can conduct frequent, on-demand scans of individual fields, and for infrastructure inspection, allowing for the detailed assessment of materials and structural integrity. Global commercial drone market’s expansion, which continues to see double-digit growth, is a strong tailwind for this specific application of hyperspectral technology.
Expansion into New Commercial and Industrial Applications
Beyond its established uses in defense, research, and earth sciences, hyperspectral remote sensing is rapidly expanding into a diverse array of new commercial and industrial applications. This trend is fueled by the decreasing cost of sensors and the improved accessibility of data analytics. In the food processing and pharmaceutical industries, for instance, hyperspectral imaging is being adopted for quality control and product sorting, capable of detecting foreign materials, contaminants, or inconsistencies in composition that are invisible to conventional RGB cameras. Similarly, the recycling industry is leveraging this technology to improve the accuracy and efficiency of sorting different types of plastics and materials based on their unique spectral fingerprints. This cross-industry adoption is creating new revenue streams and driving innovation, moving the technology from a specialized research tool to a integral component of industrial automation and supply chain management.
COMPETITIVE LANDSCAPE
Key Industry Players
Companies Strive to Strengthen their Product Portfolio to Sustain Competition
Global Hyperspectral Remote Sensing Market exhibits a semi-consolidated competitive structure, characterized by a mix of established multinational corporations and specialized niche players. SPECIM, Spectral Imaging Ltd. (Finland) is widely recognized as a dominant force, largely because of its pioneering work in pushbroom hyperspectral imaging technology and its extensive global distribution network. The company holds an estimated market share of over 15%, a testament to its robust product offerings across VNIR and SWIR ranges, which are critical for applications in precision agriculture and environmental monitoring.
Headwall Photonics, Inc. (U.S.) and Resonon Inc. (U.S.) also command significant portions of the market. Their growth is propelled by continuous innovation in high-performance hyperspectral sensors and software solutions, catering strongly to the defense and research sectors. Furthermore, these companies are actively engaging in strategic collaborations with system integrators and software developers to enhance application-specific solutions, which is expected to further solidify their market positions.
Meanwhile, other notable players like Corning Incorporated (through its advanced optics segment) and Norsk Elektro Optikk AS (Norway) are strengthening their foothold through substantial investments in research and development. They are focusing on improving sensor resolution, data processing speeds, and miniaturization of systems to tap into emerging applications such as UAV-based remote sensing and real-time industrial sorting. This focus on technological advancement and strategic market expansion is crucial for navigating the competitive pressures and capturing growth in a market projected to reach D 239 million by 2032.
List of Key Hyperspectral Remote Sensing Companies Profiled
- SPECIM, Spectral Imaging Ltd. (Finland)
- Headwall Photonics, Inc. (U.S.)
- Resonon Inc. (U.S.)
- Corning Incorporated (U.S.)
- ITRES Research Limited (Canada)
- Norsk Elektro Optikk AS (Norway)
- Surface Optics Corporation (U.S.)
- Telops Inc. (Canada)
- Brimrose Corporation of America (U.S.)
- BaySpec, Inc. (U.S.)
- XIMEA GmbH (Germany)
- RIKOLA Ltd. (Finland)
- CI Systems (Israel) Ltd. (Israel)
- Cubert GmbH (Germany)
Segment Analysis:
By Type
VNIR Segment Dominates the Market Due to Widespread Adoption in Vegetation and Environmental Monitoring
The market is segmented based on type into:
- VNIR (Visible and Near-Infrared)
- Subtypes: Pushbroom scanners, Whiskbroom scanners, and others
- SWIR (Short-Wave Infrared)
- Subtypes: Cooled detectors, Uncooled detectors, and others
- Thermal LWIR (Long-Wave Infrared)
- Subtypes: Microbolometer arrays, Quantum well infrared photodetectors, and others
By Application
Research Institutions Segment Leads Due to Extensive Use in Scientific Studies and Academic Projects
The market is segmented based on application into:
- Research Institutions
- Defense Organizations
- Commercial Enterprises
By Platform
Airborne Systems Segment Holds Significant Share Due to High-Resolution Data Collection Capabilities
The market is segmented based on platform into:
- Airborne Systems
- Subtypes: Manned aircraft, Unmanned aerial vehicles (UAVs), and others
- Spaceborne Systems
- Subtypes: Satellites, Space stations, and others
- Ground-based Systems
- Subtypes: Portable systems, Fixed installations, and others
By End-User Industry
Agriculture and Environmental Monitoring Segment Shows Strong Growth Due to Precision Farming Applications
The market is segmented based on end-user industry into:
- Agriculture and Environmental Monitoring
- Defense and Security
- Mining and Geology
- Healthcare and Life Sciences
- Others
Regional Analysis: Hyperspectral Remote Sensing Market
North America
North America is the leading market for hyperspectral remote sensing, driven by substantial government and private investment in defense, environmental monitoring, and precision agriculture. The United States, in particular, accounts for a significant portion of the global market share, with agencies like NASA and the Department of Defense being major end-users. The region’s strong technological infrastructure and the presence of key industry players, such as Headwall Photonics and Corning Incorporated, foster continuous innovation. Recent developments include the integration of hyperspectral imaging into next-generation Earth observation satellites and unmanned aerial vehicles (UAVs), enhancing capabilities in mineral exploration and climate change research. Stringent regulatory frameworks also support the adoption of advanced remote sensing technologies for compliance and monitoring purposes.
Europe
Europe represents a mature and technologically advanced market, characterized by robust research initiatives and significant applications in agriculture, environmental science, and defense. The European Space Agency (ESA) and national space programs in countries like Germany, France, and the UK are pivotal in driving demand. The region’s focus on sustainable development and climate action has led to increased use of hyperspectral sensing for monitoring carbon sequestration, soil health, and water quality. Collaborative projects, such as the Copernicus program, utilize hyperspectral data for land and marine services. However, market growth is tempered by high costs and the complexity of data analysis, which require specialized expertise and infrastructure.
Asia-Pacific
The Asia-Pacific region is experiencing rapid growth in the Hyperspectral Remote Sensing Market, fueled by expanding industrial applications, urbanization, and increased government spending on infrastructure and defense. China and Japan are the key contributors, with China aggressively advancing its space-based hyperspectral capabilities through programs like the Gaofen series of satellites. The region’s agriculture sector is a major adopter, using the technology for crop health monitoring and yield prediction to support food security. Additionally, mining and oil & gas industries leverage hyperspectral imaging for resource exploration. While cost sensitivity remains a challenge, the declining price of sensors and growing awareness of the technology’s benefits are driving broader adoption across emerging economies.
South America
South America’s market is emerging, with growth primarily driven by applications in agriculture, mining, and environmental conservation. Brazil and Argentina are the frontrunners, utilizing hyperspectral remote sensing for monitoring vast agricultural lands and natural resources. The Amazon rainforest’s conservation efforts also rely on this technology for deforestation tracking and biodiversity assessment. However, the market faces constraints due to limited technological infrastructure, economic volatility, and lower investment in research and development compared to more developed regions. Despite these challenges, increasing awareness of the benefits of hyperspectral imaging and gradual infrastructure improvements are expected to support future growth.
Middle East & Africa
The Middle East & Africa region is in the nascent stages of adopting hyperspectral remote sensing, with potential applications in oil and gas exploration, agriculture, and water resource management. Countries like Israel, Saudi Arabia, and the UAE are leading the way, driven by defense and security applications as well as initiatives to combat desertification and improve agricultural productivity. The region’s harsh climatic conditions and vast arid landscapes make hyperspectral technology particularly valuable for environmental monitoring. However, market expansion is hindered by high costs, limited local expertise, and political instability in certain areas. Long-term growth prospects are tied to increased investment in technology infrastructure and international collaborations.
Report Scope
This market research report provides a comprehensive analysis of the global and regional Hyperspectral Remote Sensing markets, covering the forecast period 2025–2032. It offers detailed insights into market dynamics, technological advancements, competitive landscape, and key trends shaping the industry.
Key focus areas of the report include:
- Market Size & Forecast: Historical data and future projections for revenue, unit shipments, and market value across major regions and segments.
- Segmentation Analysis: Detailed breakdown by product type, technology, application, and end-user industry to identify high-growth segments and investment opportunities.
- Regional Outlook: Insights into market performance across North America, Europe, Asia-Pacific, Latin America, and the Middle East & Africa, including country-level analysis where relevant.
- Competitive Landscape: Profiles of leading market participants, including their product offerings, R&D focus, manufacturing capacity, pricing strategies, and recent developments such as mergers, acquisitions, and partnerships.
- Technology Trends & Innovation: Assessment of emerging technologies, integration of AI/IoT, semiconductor design trends, fabrication techniques, and evolving industry standards.
- Market Drivers & Restraints: Evaluation of factors driving market growth along with challenges, supply chain constraints, regulatory issues, and market-entry barriers.
- Stakeholder Analysis: Insights for component suppliers, OEMs, system integrators, investors, and policymakers regarding the evolving ecosystem and strategic opportunities.
Primary and secondary research methods are employed, including interviews with industry experts, data from verified sources, and real-time market intelligence to ensure the accuracy and reliability of the insights presented.
FREQUENTLY ASKED QUESTIONS:
What is the current market size of Global Hyperspectral Remote Sensing Market?
-> Hyperspectral Remote Sensing Market was valued at 180 million in 2024 and is projected to reach USD 239 million by 2032, at a CAGR of 4.2% during the forecast period.
Which key companies operate in Global Hyperspectral Remote Sensing Market?
-> Key players include SPECIM, Resonon, Headwall Photonics, Corning Incorporated, ITRES, Norsk Elektro Optikk, Surface Optics Corp, Telops, Brimrose Corporation, BaySpec, XIMEA, RIKOLA, CI Systems, and Cubert GmbH, among others.
What are the key growth drivers?
-> Key growth drivers include increasing defense and surveillance applications, growing environmental monitoring needs, advancements in precision agriculture, and expanding mineral exploration activities.
Which region dominates the market?
-> North America is the largest consumer market, while Asia-Pacific is expected to be the fastest-growing region during the forecast period.
What are the emerging trends?
-> Emerging trends include miniaturization of hyperspectral sensors, integration with AI and machine learning for data analysis, development of UAV-based systems, and increasing adoption in healthcare and food quality assessment.
Get Sample Report PDF for Exclusive Insights
Report Sample Includes
- Table of Contents
- List of Tables & Figures
- Charts, Research Methodology, and more...


