Key Statistics
Key Takeaways
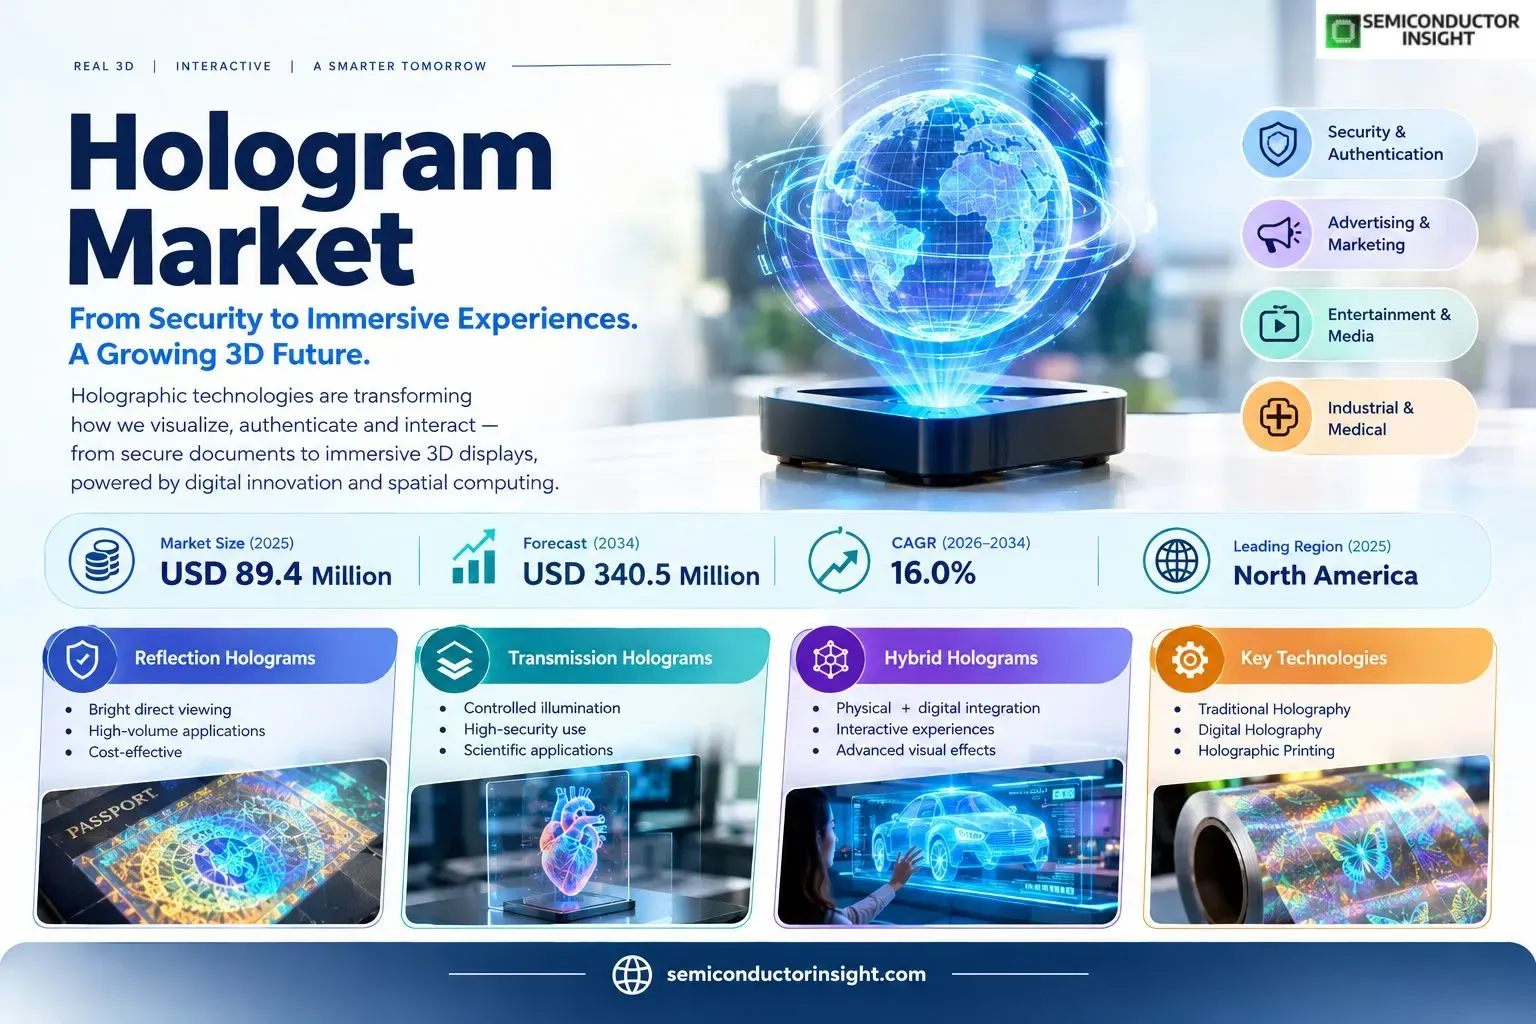
- Market size and growth: the market is valued at USD 89.4 million in 2025 and is projected to reach USD 340.5 million by 2034, representing a 16.0% CAGR across 2026–2034.
- Reflection Holograms leads the type mix because bright, directly viewable images are well suited to consumer, commercial and exhibition environments.
- Security & Authentication is the leading application, supported by currency, identity documents and high-value goods create recurring demand for difficult-to-replicate optical security features.
- North America is the largest geographic market, while Asia Pacific offers the strongest incremental growth profile.
- Primary driver: security authentication, medical visualization and immersive digital experiences are widening the commercial use of holographic technologies
- Principal restraint: high system cost, content-production complexity and limited interoperability slow adoption outside high-value use cases
Market Overview
The hologram market was valued at USD 89.4 million in 2025 and is projected to reach USD 340.5 million by 2034, expanding at a 16.0% CAGR during 2026–2034. North America leads in 2025, while the competitive landscape is being reshaped by digital holography, interactive 3D visualization, medical imaging and convergence with AR and spatial computing..
Holographic technologies create, reconstruct or display three-dimensional optical information through interference, diffraction or digitally processed wavefronts. Commercial systems span security holograms, digital holographic microscopy, projection and display hardware, software and visualization services. The market therefore combines mature high-volume authentication applications with emerging interactive medical, education and entertainment systems that can command much higher value per installation.
Security and authentication remain foundational because holographic features are difficult to duplicate with ordinary printing and can be inspected visually without electronics. Growth is increasingly coming from digital applications where holographic or holography-derived systems enable interactive 3D visualization. RealView Imaging, for example, is developing live medical holography for interventional procedures, while zSpace uses stereoscopic spatial visualization and tracking to create immersive learning environments without head-mounted displays.
The competitive landscape is fragmented because the underlying technologies are very different. A security hologram supplier competes on mastering and replication, while medical and scientific systems depend on optical hardware, cameras, computation and specialized software. This diversity supports strong growth but also makes standards, interoperability and content creation important adoption barriers for new interactive-display applications.
Segment Analysis: By Type
By type, the market is segmented into Reflection Holograms, Transmission Holograms, Hybrid Holograms. Reflection Holograms leads because its performance, integration and cost profile aligns most closely with current high-volume applications.
| Type | Function / role | Market position |
|---|---|---|
| Reflection Holograms | Viewed using reflected light and designed for bright direct viewing. | Leading type in commercial display and branded applications because viewing conditions are relatively convenient. |
| Transmission Holograms | Viewed with light transmitted through the holographic medium. | Important in high-security, scientific and specialized optical applications requiring controlled illumination. |
| Hybrid Holograms | Combine multiple optical or digital techniques to achieve specific visual or security effects. | Growing as suppliers integrate physical holography with digital content, projection and interactive systems. |
Commercial implications by type
Type selection is dictated by viewing geometry and the intended economic function. Reflection formats are easier to present to consumers, transmission formats retain value in security and scientific settings, and hybrid architectures enable more complex interactive experiences. Suppliers can differentiate through brightness, viewing angle, color fidelity, optical efficiency and how easily content can be produced or updated.
Segment Analysis: By Application
By application, demand is segmented into Security & Authentication, Advertising & Marketing, Entertainment & Media, Industrial & Medical. Security & Authentication is the largest application because it connects the underlying technology to a direct operational, safety, productivity or user-experience benefit.
| Application | Demand characteristics |
|---|---|
| Security & Authentication | Currency, identity documents, certificates and branded goods use holographic features for anti-counterfeiting and visual verification. |
| Advertising & Marketing | Retail displays and product launches use holographic effects to create attention and premium brand experiences. |
| Entertainment & Media | Concerts, museums, gaming and events use immersive 3D visuals to differentiate audience experiences. |
| Industrial & Medical | Medical visualization, scientific imaging, design review and training use holographic or spatial 3D systems to improve understanding of complex structures. |
By End User
| End User | Commercial relevance |
|---|---|
| Government & Defense | Document security, identification and specialized visualization create high-value demand. |
| Retail & Consumer Goods | Brand protection and experiential marketing drive volume and display applications. |
| Healthcare & Industrial | Medical imaging, laboratory visualization and engineering use cases require high precision and system integration. |
By Technology
| Technology | Commercial relevance |
|---|---|
| Traditional Holography | Physical interference patterns support security, display and archival optical applications. |
| Digital Holography | Cameras and computation reconstruct optical fields for microscopy, metrology and dynamic content. |
| Holographic Printing | Mass-replication processes serve authentication, packaging and promotional markets. |
Regional Analysis
North America leads the market because the detailed regional analysis on the controlling market page identifies North America as the leading commercial market, supported by medical, entertainment and technology-development demand. Asia Pacific has the strongest growth profile as demand expands through electronics manufacturing, display development and large consumer markets in China, Japan, South Korea and India.
How does regional demand differ across this market?
North America leads in high-value medical, entertainment and venture-backed display applications, while Asia Pacific offers the strongest manufacturing scale and fastest demand expansion. Europe combines security printing, automotive and scientific holography. South America and the Middle East & Africa are smaller, with demand concentrated in authentication, events, museums and imported visualization systems. The market’s diversity means regional leadership varies by use case even when one region leads total commercial value.
| Region | Position | Growth outlook | Demand profile | Supplier selection |
|---|---|---|---|---|
| North America | Largest | Strong | Medical, entertainment and R&D | Visualization quality, ecosystem, support |
| Asia Pacific | Second | Fastest | Manufacturing and consumer scale | Cost, display integration, localization |
| Europe | Third | Strong | Security, automotive and scientific | Precision, compliance, optical quality |
| South America | Smaller | Moderate | Authentication and events | Cost, local integration |
| Middle East & Africa | Emerging | Strong | Premium events and security | Reliability, integration, visual impact |
Competitive Landscape
Competition spans security holography, scientific imaging, spatial visualization and interactive display companies, making technical specialization the defining feature of the competitive landscape.
Lyncee Tec, Nanolive, Phase Holographic Imaging and other scientific-imaging companies compete on non-invasive 3D imaging and quantitative analysis, while RealView Imaging focuses on live medical holography. zSpace and EON Reality address immersive learning and training with spatial visualization platforms. These vendors compete for different budgets even though they all monetize 3D optical information.
Security-focused holography has different economics, emphasizing high-volume replication, durability and resistance to counterfeiting. Commercial-display players compete on brightness, viewing angle, content creation and installation complexity. As a result, the market is best viewed as several adjacent holographic technology segments rather than a single standardized hardware category.
Software is becoming a stronger differentiator in dynamic systems. Reconstruction algorithms, content authoring, interaction tracking and visualization tools determine how easily customers can create useful 3D experiences. Companies that simplify workflow can expand demand beyond specialist optical engineers and into healthcare, education, retail and enterprise training.
| Competitive tier | Representative participants | Competitive focus |
|---|---|---|
| Scientific and medical specialists | Nanolive, Phase Holographic Imaging, RealView Imaging, Lyncee Tec | Quantitative imaging, medical visualization and optical precision |
| Immersive visualization platforms | zSpace, EON Reality, Leia | Interactive spatial display, education and enterprise visualization |
| Industrial / optical specialists | HoloTec Switzerland, Vision Optics, Fraunhofer IPM, Jasper Display | Optical engineering, display components and specialized holography |
Companies Profiled
Lyncee Tec, zSpace, Inc., Mach7 Technologies, HoloTec Switzerland AG, Vision Optics GmbH, EON Reality, Inc., Nanolive SA, Leia, Inc., Ovizio Imaging Systems NV/SA, RealView Imaging, Phase Holographic Imaging, 4Deep inwater imaging, Geola, Fraunhofer IPM, Jasper Display Corporation
Production Capacity Analysis
Production capacity varies sharply by technology, ranging from high-volume holographic replication to low-volume precision optical systems with cameras, lasers, spatial light modulators and calibration-intensive assembly.
Security holograms can be replicated at industrial scale once mastering is complete, making tooling and secure production control more important than unit assembly. Scientific and medical holographic systems have a different bottleneck: optical alignment, cameras, lasers, vibration control and calibration must work as an integrated system, which limits the speed at which high-end installations can be manufactured and commissioned.
Dynamic and interactive systems also depend on compute hardware, display components and software content. Capacity therefore includes not only factories but also engineering teams that can create content, integrate interfaces and support installations. Vendors with reusable software platforms can scale faster than project-only suppliers because they reduce custom work per deployment.
Market Dynamics
The market is shifting from static optical security toward a broader mix of computed, interactive and application-specific 3D visualization.
Mature security holograms provide a stable volume base, while digital and interactive systems generate faster growth from a smaller starting point. Commercial success depends on proving a clear workflow benefit: better medical understanding, stronger authentication, higher retail engagement or more effective training. Technologies that deliver impressive visuals without a repeatable business benefit can remain confined to one-off demonstrations.
Market Drivers
Drivers Impact Analysis
| Driver | Impact | Commercial mechanism |
|---|---|---|
| Anti-counterfeiting demand | High | Holographic security features remain valuable for documents, currency and branded goods because they are difficult to copy convincingly. |
| Medical and scientific visualization | High | Interactive 3D views can improve planning, training and interpretation of complex volumetric data. |
| Immersive entertainment | Medium | Events and museums use 3D visual effects to create differentiated experiences. |
| Digital optical processing | High | Better sensors, compute and algorithms reduce the cost and complexity of real-time holographic reconstruction. |
Anti-counterfeiting demand
Holographic security features remain valuable for documents, currency and branded goods because they are difficult to copy convincingly.
Medical and scientific visualization
Interactive 3D views can improve planning, training and interpretation of complex volumetric data.
Immersive entertainment
Events and museums use 3D visual effects to create differentiated experiences.
Digital optical processing
Better sensors, compute and algorithms reduce the cost and complexity of real-time holographic reconstruction.
Market Restraints
Restraints Impact Analysis
| Restraint | Impact | Commercial mechanism |
|---|---|---|
| High initial cost | High | Precision optics, projectors, displays and specialized software can make advanced systems expensive. |
| Content and workflow complexity | High | Customers need tools and skills to create useful 3D content rather than static demonstrations. |
| Interoperability gaps | Medium | Different display and imaging architectures lack common content and interaction standards. |
| Viewing constraints | Medium | Brightness, viewing angle, eye position and ambient light can limit practical deployment. |
High initial cost
Precision optics, projectors, displays and specialized software can make advanced systems expensive.
Content and workflow complexity
Customers need tools and skills to create useful 3D content rather than static demonstrations.
Interoperability gaps
Different display and imaging architectures lack common content and interaction standards.
Viewing constraints
Brightness, viewing angle, eye position and ambient light can limit practical deployment.
Market Opportunities
Medical procedural visualization
Live interactive 3D imaging can support interventional planning and complex anatomy visualization.
Holographic microscopy
Label-free 3D imaging can expand in cell biology, drug development and industrial microscopy.
Education and training
Spatial visualization can make technical subjects easier to explore without head-mounted displays.
Retail and experiential media
Brands can use high-impact 3D content to differentiate launches, stores and live events.
Supply Chain Analysis
Films, photopolymers, glass, lasers, light modulators
Sensors, optics, projectors, displays
Reconstruction, rendering, interaction, authoring
Medical, security, retail, entertainment deployments
Optical materials
Security holography depends on specialized films and replication media, while digital systems require stable optical components and high-quality imaging paths.
Imaging hardware
Cameras, lasers, spatial light modulators and displays determine resolution, field of view and brightness in interactive systems.
Software and content
Reconstruction and authoring software convert optical data or 3D models into experiences that customers can actually use.
Integration and service
Complex installations require calibration, training and application support, making service capacity an important part of supplier value.
Recent Developments
2026 — zSpace expands immersive education hardware with NVIDIA-powered systems
zSpace described its 2026 Inspire 2 platforms as higher-performance spatial learning systems for STEM and career education. Source
Current — RealView Imaging advances interactive live medical holography
RealView positions its Digital Light Shaping technology for real-time 3D medical visualization and interventional procedures. Source
2026 — zSpace reports broad institutional deployment of spatial learning
zSpace states that more than 2,500 organizations use its immersive AR/VR learning technology, demonstrating commercial demand for interactive 3D visualization. Source
Report Scope & Segmentation
| Attribute | Coverage |
|---|---|
| Market | Hologram |
| Base Year | 2025 |
| Estimated Year | 2026 |
| Forecast Period | 2026–2034 |
| 2025 Market Size | USD 89.4 million |
| 2026 Estimated Size | USD 103.8 million |
| 2034 Forecast Size | USD 340.5 million |
| CAGR | 16.0% (2026–2034) |
| By Type | Reflection Holograms, Transmission Holograms, Hybrid Holograms |
| By Application | Security & Authentication, Advertising & Marketing, Entertainment & Media, Industrial & Medical |
| By End User | Government & Defense, Retail & Consumer Goods, Healthcare & Industrial |
| By Technology | Traditional Holography, Digital Holography, Holographic Printing |
| Regions | North America, Asia Pacific, Europe, South America, Middle East & Africa |
| Companies Profiled | Lyncee Tec, zSpace, Inc., Mach7 Technologies, HoloTec Switzerland AG, Vision Optics GmbH, EON Reality, Inc., Nanolive SA, Leia, Inc., Ovizio Imaging Systems NV/SA, RealView Imaging, Phase Holographic Imaging, 4Deep inwater imaging, Geola, Fraunhofer IPM, Jasper Display Corporation |
Frequently Asked Questions
What is the hologram market size in 2025?
The market is valued at USD 89.4 million in 2025.
What is the projected market size by 2034?
The market is projected to reach USD 340.5 million by 2034.
What is the CAGR from 2026 to 2034?
The market is expected to expand at a 16.0% CAGR over 2026–2034.
Which region leads the market?
North America is the largest geographic market in 2025.
Which type leads the market?
Reflection Holograms is the leading type.
Which application leads demand?
Security & Authentication is the leading application segment.
What is the main growth driver?
security authentication, medical visualization and immersive digital experiences are widening the commercial use of holographic technologies.
What is the main restraint?
high system cost, content-production complexity and limited interoperability slow adoption outside high-value use cases.
Where are the strongest opportunities?
medical holography, education, retail experiences and digital holographic microscopy.
Which companies are active in the market?
Lyncee Tec, zSpace, Inc., Mach7 Technologies, HoloTec Switzerland AG, Vision Optics GmbH, EON Reality, Inc., Nanolive SA, Leia, Inc..
Research Sources & Evidence Base
View primary and official evidence used in this overview
- RealView Imaging: Medical Holography — Live interactive medical holography and interventional visualization.
- zSpace: AR/VR Learning Experiences — Spatial visualization, education deployment and hardware ecosystem.
- zSpace: NVIDIA in Education: Powering zSpace AR/VR Learning — 2026 hardware and performance development.

Get Sample Report PDF for Exclusive Insights
Report Sample Includes
- Table of Contents
- List of Tables & Figures
- Charts, Research Methodology, and more...
 Download Sample Report PDF