
Key Statistics
Key Takeaways
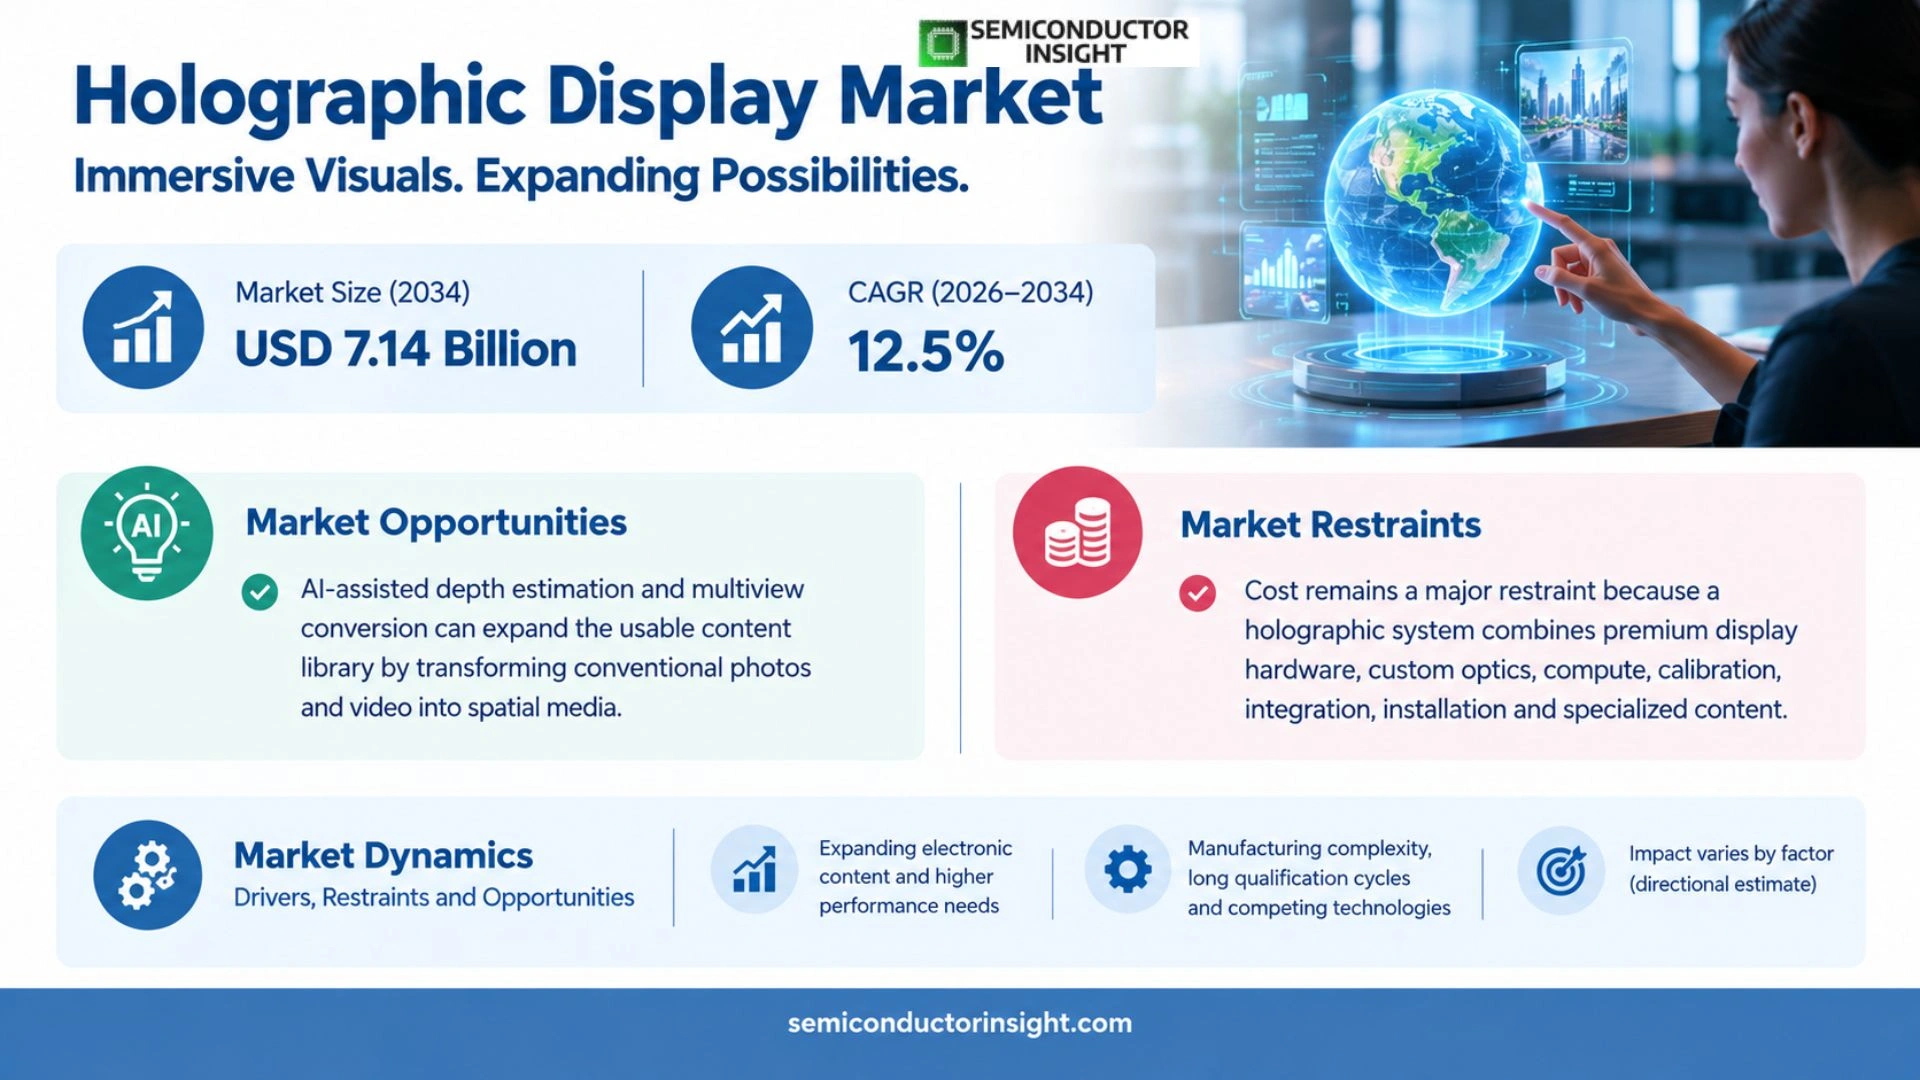
- The endpoint-consistent forecast places the market at USD 2.48 billion in 2025 and USD 7.14 billion by 2034, representing an updated 12.5% CAGR during 2026–2034. The CAGR is calculated directly from the report’s supplied endpoints.
- Light-field displays provide the most commercially accessible type because group-viewable depth can be delivered through high-resolution panels and directional optics without requiring every viewer to wear a headset.
- Medical imaging is a high-value application, while retail signage and entertainment provide broader deployment potential. Adoption depends on reusable content workflows, measurable business value, and reliable operation in ordinary environments.
- Asia Pacific leads through advanced display panels, semiconductors, optical components, electronics assembly, automotive interfaces, and large retail and entertainment markets.
- Content simplicity is as important as optics. AI-assisted conversion, standard creative-tool support, SDK compatibility, and remote management determine whether impressive prototypes become scalable, repeatable installations.
Holographic Display Market Overview
Holographic Display Market was valued at USD 2.48 billion in 2025 and is projected to reach USD 7.14 billion by 2034, growing at a CAGR of 12.5% during 2026–2034. Asia Pacific held the largest regional position in 2025, supported by concentrated manufacturing, downstream electronics production and established component supply networks.
Holographic displays reproduce spatial depth through light-field, volumetric, diffractive, or projection-based techniques that allow viewers to perceive three-dimensional content without relying entirely on conventional flat imagery. Commercial products vary substantially: some provide multiple perspective views through directional optics, some generate illuminated voxels inside a volume, and others create in-air or reflected visual effects. Market assessment must therefore distinguish genuine depth reconstruction from ordinary two-dimensional projection marketed with holographic terminology.
The report page provides a 2025 base and a 2034 terminal value. Those endpoints imply compound annual growth of approximately twelve and one-half percent across nine annual intervals. The endpoint-consistent method is used throughout this overview because it preserves the supplied values while updating the CAGR mathematically, without importing an estimate from another market-research publisher or relying on the page’s internally inconsistent secondary statistic.
Demand is moving from demonstrations toward repeatable workflows in product visualization, medical imaging, design review, digital signage, education, automotive interfaces, museums, and entertainment. Adoption depends on brightness, viewing zone, resolution per view, depth volume, latency, content-conversion cost, software support, footprint, power consumption, and ease of deployment. A visually impressive prototype does not automatically create recurring revenue unless customers can update content and operate the system reliably in normal lighting.
Segment Analysis: By Type
By type, the Holographic Display market is segmented into Light-Field Displays · Volumetric Displays · Holographic Projection Devices. Each category represents a different degree of integration, qualification burden and value capture, so suppliers compete through a combination of material performance, design support, manufacturing consistency, package architecture and application-specific testing rather than through unit price alone. Procurement also reflects lifecycle support, interoperability, compliance evidence, warranty exposure, and the cost of unsuccessful qualification.
| Type | Market relevance |
|---|---|
| Light-Field Displays | Distinct performance, condition, integration, and qualification requirements shape demand and supplier positioning. |
| Volumetric Displays | Distinct performance, condition, integration, and qualification requirements shape demand and supplier positioning. |
| Holographic Projection Devices | Distinct performance, condition, integration, and qualification requirements shape demand and supplier positioning. |
Segment Analysis: By Application
By application, the market covers Retail Signage · Medical Imaging · Automotive Head-Up Displays · Entertainment and Gaming · Education and Training. Demand varies by production volume and qualification intensity: consumer programmes reward scale and miniaturisation, while automotive, industrial, aerospace, medical or security designs place greater weight on reliability evidence, long product availability and system-level performance under demanding operating conditions. Channel design, documentation, service coverage, and total ownership economics further determine which application converts technical interest into repeat purchasing.
| Application | Market relevance |
|---|---|
| Retail Signage | Purchasing criteria reflect use-case economics, technical requirements, warranty expectations, and channel support. |
| Medical Imaging | Purchasing criteria reflect use-case economics, technical requirements, warranty expectations, and channel support. |
| Automotive Head-Up Displays | Purchasing criteria reflect use-case economics, technical requirements, warranty expectations, and channel support. |
| Entertainment and Gaming | Purchasing criteria reflect use-case economics, technical requirements, warranty expectations, and channel support. |
| Education and Training | Purchasing criteria reflect use-case economics, technical requirements, warranty expectations, and channel support. |
Regional Analysis
Asia Pacific is the largest regional market for Holographic Display products, combining an established component-production ecosystem with major downstream customers. North America and Europe are strategically important for premium, automotive, aerospace, industrial and specialised applications, while South America and Middle East & Africa are primarily import- and project-led markets where distributor reach, local support and supply continuity shape vendor selection.
How does regional demand differ across this market?
For Holographic Display, Asia Pacific holds the largest position, supported by an established customer base, supplier presence, and mature purchasing channels. Europe contributes regulation, industrial demand, and technical expertise, while Asia Pacific combines electronics manufacturing, large device populations, and expanding engineering capability. South America and the Middle East and Africa develop through targeted infrastructure, enterprise, research, consumer, or public-sector programs rather than uniform adoption.
| Region | Position |
|---|---|
| Asia Pacific | Largest and most established demand base |
| North America | Developing demand shaped by local applications, channels, and qualification conditions |
| Europe | Developing demand shaped by local applications, channels, and qualification conditions |
| South America | Developing demand shaped by local applications, channels, and qualification conditions |
| Middle East & Africa | Developing demand shaped by local applications, channels, and qualification conditions |
Key Holographic Display Manufacturers and Competitive Landscape
The Holographic Display competitive landscape includes global technology leaders, diversified semiconductor or component groups, RF and imaging specialists, and regional manufacturers. The report profiles every named company across product positioning, manufacturing footprint, application exposure, recent development activity and strategic strengths; the complete coverage list is reproduced below so the intended company universe is explicit.
Competition spans light-field display specialists, medical holography developers, volumetric-display companies, optical-computing software firms, and diversified electronics groups. Looking Glass Factory, Leia, Sony, Light Field Lab, Voxon Photonics, RealView Imaging, Holoxica, Realfiction, VividQ, HoloLight, Provision Interactive, and Samsung address different combinations of hardware, optical architecture, rendering software, content tools, medical workflow, digital signage, and professional visualization. Their products should not be treated as technically interchangeable merely because each uses three-dimensional display language.
Vendors compete on the complete spatial-content pipeline. Important differentiators include the number and angular spread of views, effective spatial resolution, display size, brightness, color performance, motion handling, interaction, GPU demand, real-time engine support, automatic 2D-to-3D conversion, content-management integration, installation depth, thermal behavior, service coverage, and application evidence. Companies that reduce content preparation and support existing creative tools can address a broader buyer base than suppliers requiring a bespoke production workflow for every deployment.
Key companies profiled
- Looking Glass Factory
- RealView Imaging
- Sony Corporation
- Leia Inc.
- Light Field Lab
- Voxon Photonics
- Holoxica Ltd.
- Realfiction
- VividQ
- HoloLight
- Provision Interactive
- Samsung Electronics
Holographic Display Production Capacity Analysis
Production capacity is a material competitive factor in the Holographic Display market because electrical performance depends on specialised processes, qualified materials, repeatable yields and application-specific test capability. Capacity cannot be assessed only by nominal factory floor area: effective supply is the output that passes dimensional, electrical, reliability and customer qualification requirements at the required product mix.
Effective holographic-display capacity is the number of complete systems that meet optical, electronic, thermal, mechanical, and software acceptance criteria, not the nominal availability of flat panels alone. A commercial unit may require a high-resolution panel or projector, lenticular or diffractive optics, light guides, precision alignment, lasers or LEDs, spatial light modulators, sensors, compute hardware, enclosures, calibration software, and content tools. Yield can be limited by optical uniformity and alignment rather than semiconductor supply.
Scaling from laboratory prototypes to larger formats increases difficulty because viewing zones, brightness, pixel density, heat, power, mechanical tolerance, and optical artifacts must remain controlled across a wider area. Manufacturers need calibrated assembly fixtures, clean optical handling, automated image-quality inspection, thermal verification, firmware control, and final-system characterization. Large installations also require packaging, transport, field calibration, and service procedures capable of preserving alignment after shipment and repeated operation in public environments.
Software and content readiness are part of usable capacity. A factory can ship hardware faster than customers can create multiview assets, integrate a content-management system, or train operators. Suppliers therefore expand effective market capacity through SDKs, plug-ins for Unity and Unreal, web encoders, conversion tools, reference content, cloud management, and certified integrators. These capabilities shorten deployment cycles and allow the same hardware platform to serve retail, engineering, medical, museum, and entertainment programs.
Holographic Display Market Dynamics: Drivers, Restraints and Opportunities
Holographic Display market growth reflects expanding electronic content and higher performance requirements, moderated by manufacturing complexity, long qualification cycles and competing technologies. The impact ranges below are directional analytical estimates rather than additive forecasts; they show the relative pressure each factor can place on the baseline CAGR when other assumptions remain broadly stable.
Growth is driven by improving optical architectures, higher-resolution panels, more capable graphics processing, AI-assisted depth conversion, and demand for shared spatial visualization without headsets. The market is still project-led in many applications, so revenue can be uneven and concentrated around product launches, exhibitions, medical installations, design centers, and flagship retail programs. Repeatability improves when customers can reuse conventional video or three-dimensional assets instead of commissioning specialized content for every screen.
The baseline is moderated by high system cost, limited viewing zones, resolution tradeoffs, ambient-light constraints, content-production burden, and competition from large-format OLED, LED walls, projection mapping, augmented-reality headsets, and conventional monitors. Terminology is also inconsistent, making procurement difficult. Vendors must specify the actual optical method, number of simultaneous viewers, perceived depth, working distance, brightness, latency, and supported content workflow so customers can compare systems on operational performance rather than spectacle alone.
MARKET DRIVERS
Drivers Impact Analysis*
| Driver | (~) % impact on CAGR forecast | Geographic relevance | Impact timeline |
|---|---|---|---|
| Retail, museum and event demand for shared spatial experiences | +2.7% | Asia Pacific, North America, Europe | Short term (≤2 years) |
| AI-assisted 2D-to-3D content conversion | +2.1% | Global creator and enterprise markets | Medium term (2–4 years) |
| Medical and scientific three-dimensional visualization | +1.8% | North America, Europe, Japan, Israel | Long term (≥4 years) |
| Professional design and digital-twin review | +1.5% | North America, Europe, developed Asia | Medium term (2–4 years) |
| Large-format headset-free digital signage | +1.2% | Major retail and entertainment cities | Medium term (2–4 years) |
| Automotive spatial interfaces and advanced HUD development | +0.9% | Europe, Japan, South Korea, China, North America | Long term (≥4 years) |
Retailers, museums, events, and premium brands use spatial displays to attract attention and demonstrate products that are difficult to stock, transport, or reveal physically. A headset-free presentation allows several viewers to share the same experience and can fit naturally into a storefront or exhibition. Commercial adoption strengthens when displays connect to existing digital-signage platforms, accept familiar video formats, and permit remote content changes across multiple locations without a specialist technician at every site.
Medical and scientific visualization creates a high-value demand stream because computed tomography, magnetic resonance imaging, ultrasound, molecular models, and simulation data are inherently three-dimensional. Spatial displays can support anatomy review, procedure planning, teaching, and multidisciplinary discussion by preserving depth cues and shared viewing. Healthcare adoption remains evidence-led: suppliers need validated image pipelines, reliable calibration, cybersecurity controls, clinical workflow integration, and regulatory clearance where the product performs a medical-device function rather than general visualization.
Professional design and automotive development benefit from shared three-dimensional review. Engineers can inspect digital twins, styling surfaces, components, and simulation results without distributing headsets or building a physical prototype for every iteration. Automotive head-up concepts extend the opportunity toward depth-positioned navigation and safety information. Demand depends on low-latency rendering, accurate geometry, compatibility with established CAD and visualization software, and clear evidence that the interface improves decisions without increasing visual distraction.
MARKET RESTRAINTS
Restraints Impact Analysis*
| Restraint | (~) % impact on CAGR forecast | Geographic relevance | Impact timeline |
|---|---|---|---|
| High hardware, content and integration cost | −2.2% | Global price-sensitive buyers | Persistent |
| Viewing-zone, brightness and resolution tradeoffs | −1.5% | All display formats | Persistent |
| Specialized content-production requirements | −1.2% | Retail, events and enterprise deployments | Medium term (2–4 years) |
| Competition from OLED, LED walls, projection and headsets | −1.0% | Global | Medium term (2–4 years) |
| Medical, automotive and laser-safety qualification | −0.7% | Regulated applications | Long term (≥4 years) |
Cost remains a major restraint because a holographic system combines premium display hardware, custom optics, compute, calibration, integration, installation, and specialized content. Large or medical-grade systems can require service contracts and controlled environments, while lower-cost units may compromise brightness, viewing angle, depth, or resolution. Buyers compare the total program cost with high-quality 2D displays, LED walls, projection, or head-mounted devices and may delay deployment when the incremental business benefit is difficult to measure.
Optical tradeoffs constrain product design. Increasing the number of views can divide available spatial resolution and brightness, while enlarging the viewing zone or depth volume can increase processing and calibration demands. Some systems work best from a narrow distance or angle, and reflected projection effects may require controlled lighting or physical staging. Suppliers must communicate limitations clearly because unmet expectations at a public installation can damage confidence in the technology category, not only in one vendor.
Content availability and workflow complexity can slow repeat purchasing. Existing three-dimensional models may require optimization, depth maps, camera arrays, multiview rendering, or proprietary formats before they display correctly. Real-time applications can place heavy demands on graphics hardware, and content teams may lack spatial-design experience. Open SDKs, automated conversion, reusable templates, and integration with ordinary editing tools reduce this barrier, but output quality still varies with source material and intended viewing conditions.
MARKET OPPORTUNITIES
AI-assisted depth estimation and multiview conversion can expand the usable content library by transforming conventional photographs and video into spatial media. This lowers the cost of experimentation for retailers, creators, educators, and consumers that do not own a three-dimensional production pipeline. The strongest opportunity lies in controllable tools that preserve brand assets, expose quality settings, process content securely, and produce predictable results across different display sizes rather than generating a visually inconsistent effect.
Large-format digital signage offers an attractive path to recurring software and service revenue. Thin spatial displays that install like conventional screens can address airports, malls, exhibitions, entertainment venues, corporate lobbies, and flagship stores. Hardware margins alone may remain volatile, but content management, monitoring, analytics, creative services, maintenance, and campaign updates can form an annuity stream. Success requires reliable brightness, remote management, standardized mounting, predictable power needs, and content that remains effective after novelty fades.
Application-specific systems can create defensible niches in medical imaging, automotive design, defense visualization, education, cultural heritage, and industrial digital twins. These buyers value workflow integration and domain evidence more than a generic visual effect. Partnerships with imaging companies, CAD platforms, simulation vendors, universities, hospitals, museums, and vehicle manufacturers can shorten qualification and build reference cases. Suppliers that package hardware, software, training, and verified use protocols can capture more value than component-only competitors.
Holographic Display Supply Chain Analysis
The Holographic Display supply chain links specialty materials and wafer or ceramic processing equipment to high-precision manufacturing, packaging, distribution and downstream system integration. Commercial resilience depends on qualified alternate materials, realistic yield assumptions, geographic redundancy and traceable process controls because a nominal second source is not interchangeable until the customer has validated electrical behaviour, reliability and package compatibility.
The value chain begins with display panels, laser or LED sources, spatial light modulators, optical films, microlenses, waveguides, glass, coatings, sensors, processors, memory, cameras, precision mechanics, and thermal components. System developers integrate these inputs with calibration, rendering, content conversion, interaction, and device-management software. Creative agencies, medical-imaging vendors, CAD platforms, integrators, distributors, and venue operators then convert the technology into deployable experiences and maintain it throughout the installation lifecycle.
Resilience depends on optical qualification and software continuity. Replacing a panel, light source, lens structure, processor, or coating can change brightness, color, geometry, viewing zone, and calibration. Strong suppliers maintain traceable configurations, controlled firmware, reference imagery, spare-part plans, and validated alternates. They also preserve SDK compatibility because a discontinued plug-in or rendering interface can strand customer content even when the physical display remains functional, weakening renewal economics and brand trust.
Recent Developments in the Holographic Display Market
Developments tracked to September 2026 and linked to official company or industry sources.
- April 2026 Published
Looking Glass received the Society for Information Display 2026 Display of the Year award for its Hololuminescent display architecture, highlighting industry recognition of headset-free spatial presentation built into a thin display form. Source - March 2026 Published
Looking Glass unveiled Musubi, a consumer holographic photo and video frame using one-click conversion, extending the category from professional installations toward household spatial-media use. Source - July 2025 Published
Looking Glass began shipping its 27-inch light-field display and released software updates intended to improve real-time three-dimensional application and content workflows. Source - December 2025 Published
Looking Glass opened pre-orders for an 86-inch Hololuminescent display designed for life-size digital signage, with a two-inch enclosure and a spring 2026 shipping window. Source - August 2025 Published
Sony demonstrated its XYN Spatial Reality Display at SIGGRAPH 2025 as a glasses-free platform for reviewing and presenting professional three-dimensional assets within a broader spatial-content workflow. Source
REPORT SCOPE & SEGMENTATION
| Attribute | Details |
|---|---|
| Study Period | 2021–2034 |
| Base Year | 2025 |
| Estimated Year | 2026 |
| Forecast Period | 2026–2034 |
| Historical Period | 2021–2025 |
| Market Size 2025 | USD 2.48 billion |
| Market Size 2034 | USD 7.14 billion |
| Growth Rate | CAGR of 12.5% from 2026–2034 |
| Unit | Value in USD billion and shipment or production volume where disclosed |
| Segmentation | By Type, By Application, additional technology axis and By Region |
| By Type | Light-Field Displays · Volumetric Displays · Holographic Projection Devices |
| By Application | Retail Signage · Medical Imaging · Automotive Head-Up Displays · Entertainment and Gaming · Education and Training |
| By Technology and Content Type | Laser-Based Holography · LED-Based Holography · MEMS Spatial Modulators · Interactive Advertising · 3D Product Visualization · Virtual Collaboration |
| By Region | Each region analysed by type, application and countryNorth AmericaU.S., Canada, MexicoEuropeGermany, France, U.K., Italy, Nordic Countries, BeneluxAsia PacificChina, Japan, South Korea, India, Southeast AsiaSouth AmericaBrazil, Argentina, Rest of South AmericaMiddle East & AfricaTurkey, Israel, Saudi Arabia, UAE, Rest of MEA |
| Key Companies Profiled | Looking Glass Factory; RealView Imaging; Sony Corporation; Leia Inc.; Light Field Lab; Voxon Photonics; Holoxica Ltd.; Realfiction; VividQ; HoloLight; Provision Interactive; Samsung Electronics |
| Customization Scope | Free report customization equivalent to up to four analyst working days with purchase, including additions or alterations to country, regional and segment coverage. |
Frequently Asked Questions
What is a holographic display?
The Holographic Display Market is valued at USD 2.48 billion in 2025 and is projected to reach USD 7.14 billion by 2034, representing a 12.5% CAGR during 2026–2034. The estimate covers the complete stated product, application, technology and regional scope, and the 2034 endpoint was extended from the report’s published anchors using the endpoint-implied compound annual relationship rather than an unrelated third-party forecast.
How was the updated CAGR calculated?
The 2034 Holographic Display projection extends the report’s published endpoint relationship through the requested horizon. It should be interpreted as a constant-rate rebasing scenario: actual annual results can vary with device production, qualification timing, technology substitution, pricing and regional investment, but the method keeps the terminal value mathematically consistent with the validated source anchors and the forecast period used throughout this overview.
Which display type leads the market?
Light-field displays provide the most commercially accessible type because they can create glasses-free depth for several viewers using directional optical views and established panel technology. Volumetric systems generate imagery within a physical volume and are valuable for scientific or educational visualization. Holographic projection devices address signage and events. Leadership varies by revenue definition, display size, and whether software and installation services are included.
Which applications create the strongest demand?
Retail signage, medical imaging, professional design, entertainment, automotive visualization, education, museums, and events create demand. Retail and exhibitions prioritize attention and simple content updates; medical and engineering buyers prioritize geometric accuracy, workflow integration, and evidence. Automotive interfaces require safety and reliability validation. The strongest commercial programs connect a clear operational objective with reusable content, dependable hardware, and support rather than purchasing a display only for novelty.
Why does Asia Pacific lead?
Asia Pacific combines advanced panel, semiconductor, optical-component, electronics-assembly, and consumer-device ecosystems in China, Japan, South Korea, and Taiwan. It also has large markets for retail technology, entertainment, automotive displays, and public exhibitions. Regional leadership reflects manufacturing and downstream demand together, although North America and Europe remain important for software, medical visualization, creative production, professional design, and specialist holographic technology development.
What limits adoption?
High total system cost, restricted viewing zones, optical tradeoffs, content-production expense, specialized integration, and competition from premium 2D displays or headsets limit adoption. Large installations also require shipping, alignment, maintenance, and ambient-light control. Vendors can reduce barriers through thin form factors, standard mounting, existing-video compatibility, automated depth conversion, clear specifications, remote management, and reference cases showing a measurable benefit for the chosen application.
How do holographic-display suppliers compete?
Suppliers compete through optical architecture, perceived depth, resolution, brightness, viewer count, size, latency, content tools, SDK support, conversion quality, reliability, service, and application evidence. A strong display with a difficult content pipeline can lose to a technically simpler system that integrates into ordinary workflows. Medical, automotive, and industrial suppliers also compete through qualification, cybersecurity, documentation, and long-term availability rather than visual performance alone.
What is the role of AI in this market?
AI can estimate depth from conventional images or video, generate missing views, optimize content for a particular optical system, track viewers, and support natural interaction. These functions can lower the cost of creating spatial content and broaden the available media library. Commercial systems still need controllable outputs, privacy safeguards, predictable latency, and quality verification because conversion artifacts or unstable depth can reduce realism and create discomfort.
Where are the best opportunities?
Promising opportunities include large-format spatial signage, consumer holographic frames, collaborative design review, medical visualization, education, museums, automotive interfaces, and software subscriptions for content conversion and device management. Application-specific packages are more defensible than generic demonstrations. Vendors should combine hardware with content tools, integration, training, maintenance, and analytics so customers can operate multiple deployments and measure value after the initial launch event.
Which companies are covered?
The report covers Looking Glass Factory, RealView Imaging, Sony Corporation, Leia, Light Field Lab, Voxon Photonics, Holoxica, Realfiction, VividQ, HoloLight, Provision Interactive, and Samsung Electronics. Profiles examine optical approach, product formats, software and content tools, application focus, manufacturing and integration capability, geographic presence, partnerships, and recent developments. Inclusion defines the competitive universe and does not imply identical technology or a revenue ranking.
Get Sample Report PDF for Exclusive Insights
Report Sample Includes
- Table of Contents
- List of Tables & Figures
- Charts, Research Methodology, and more...
 Download Sample Report PDF


