High Reliability Passive Electronic Components Market Overview
High-reliability passive electronic components are components that are designed to meet stringent quality and performance standards. These components are designed to operate reliably under extreme conditions, such as high temperatures, high voltages, and harsh environments. They are used in a wide range of applications, including aerospace, defense, medical, and industrial.
This report provides a deep insight into the global High Reliability Passive Electronic Components market covering all its essential aspects. This ranges from a macro overview of the market to micro details of the market size, competitive landscape, development trend, niche market, key market drivers and challenges, SWOT analysis, value chain analysis, etc.
The analysis helps the reader to shape the competition within the industries and strategies for the competitive environment to enhance the potential profit. Furthermore, it provides a simple framework for evaluating and accessing the position of the business organization. The report structure also focuses on the competitive landscape of the Global High Reliability Passive Electronic Components Market, this report introduces in detail the market share, market performance, product situation, operation situation, etc. of the main players, which helps the readers in the industry to identify the main competitors and deeply understand the competition pattern of the market.
In a word, this report is a must-read for industry players, investors, researchers, consultants, business strategists, and all those who have any kind of stake or are planning to foray into the High Reliability Passive Electronic Components market in any manner.
High Reliability Passive Electronic Components Market Analysis:
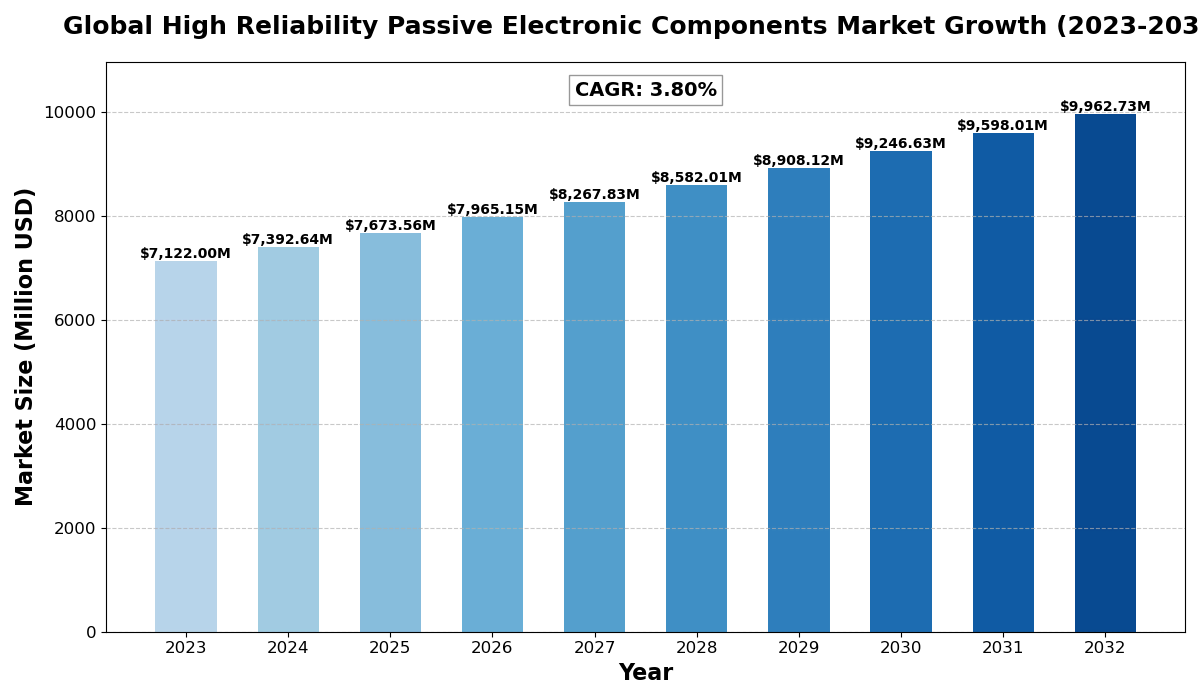
The global High Reliability Passive Electronic Components Market size was estimated at USD 7122 million in 2023 and is projected to reach USD 9962.73 million by 2032, exhibiting a CAGR of 3.80% during the forecast period.
North America High Reliability Passive Electronic Components market size was estimated at USD 1978.65 million in 2023, at a CAGR of 3.26% during the forecast period of 2025 through 2032.
High Reliability Passive Electronic Components Key Market Trends :
- Growing Demand in Aerospace & Defense
With increasing investments in space exploration, defense systems, and military technologies, the demand for high-reliability passive components is rising significantly. - Miniaturization of Components
The industry is moving towards compact and lightweight components to support advanced electronic applications in automotive, healthcare, and industrial automation. - Rise of IoT and Smart Devices
The rapid adoption of IoT, AI-driven applications, and connected devices is driving the need for durable and high-performance electronic components. - Increasing Demand for Electric Vehicles (EVs)
The shift towards electric and hybrid vehicles is boosting the requirement for high-reliability capacitors, resistors, and inductors for efficient power management. - Regional Expansion and Market Consolidation
Key players are expanding their presence in emerging markets and engaging in mergers & acquisitions to strengthen their market position and enhance product offerings.
High Reliability Passive Electronic Components Market Regional Analysis :

-
North America:
Strong demand driven by EVs, 5G infrastructure, and renewable energy, with the U.S. leading the market.
-
Europe:
Growth fueled by automotive electrification, renewable energy, and strong regulatory support, with Germany as a key player.
-
Asia-Pacific:
Dominates the market due to large-scale manufacturing in China and Japan, with growing demand from EVs, 5G, and semiconductors.
-
South America:
Emerging market, driven by renewable energy and EV adoption, with Brazil leading growth.
-
Middle East & Africa:
Gradual growth, mainly due to investments in renewable energy and EV infrastructure, with Saudi Arabia and UAE as key contributors.
High Reliability Passive Electronic Components Market Segmentation :
The research report includes specific segments by region (country), manufacturers, Type, and Application. Market segmentation creates subsets of a market based on product type, end-user or application, Geographic, and other factors. By understanding the market segments, the decision-maker can leverage this targeting in the product, sales, and marketing strategies. Market segments can power your product development cycles by informing how you create product offerings for different segments.
Key Company
- Murata
- TDK Corporation
- Samsung Electro-Mechanics
- Taiyo Yuden
- Yageo
- Kyocera
- Vishay
- TE Connectivity
- EYANG
- Samwha
- Bourns
- Sunlord Electronics
- Three-Circle
- Viking Tech
- Walsin Technology
- Fenghua Advanced Technology
Market Segmentation (by Type)
- Capacitor
- Resistor
- Inductor
Market Segmentation (by Application)
- Aerospace
- Automotive
- Industrial
- Defense and Military
- Others
Market Drivers
- Growing Industrial Automation
The increasing adoption of automation in industries like manufacturing, healthcare, and aerospace is fueling the demand for reliable electronic components. - Advancements in 5G Technology
The rollout of 5G networks requires robust and efficient electronic components, propelling market growth. - Rising Demand in Medical Devices
High-reliability passive components are crucial in medical equipment like imaging systems and life-support machines, leading to market expansion.
Market Restraints
- High Manufacturing Costs
The stringent quality standards and precision engineering involved in producing high-reliability components increase their overall cost. - Supply Chain Disruptions
Factors such as raw material shortages, geopolitical tensions, and global trade restrictions can impact production and supply. - Market Competition and Price Wars
The presence of multiple global players creates intense competition, leading to price pressures and reduced profit margins.
Market Opportunities
- Expansion in Emerging Markets
Rapid industrialization and technological advancements in countries like China, India, and Brazil offer immense growth potential. - Development of Next-Gen Technologies
Innovations in nanotechnology and energy-efficient components open new avenues for high-reliability electronic components. - Increasing Focus on Sustainability
The shift towards eco-friendly and energy-efficient electronic components presents new business opportunities for manufacturers.
Market Challenges
- Regulatory Compliance & Standards
Meeting stringent quality and reliability standards for aerospace, defense, and medical applications remains a challenge. - Short Product Lifecycles
Rapid technological advancements lead to shorter product lifecycles, requiring constant innovation and adaptation. - Fluctuating Raw Material Prices
Variations in the cost of essential materials like ceramics, metals, and polymers impact the overall production cost and profitability.
Key Benefits of This Market Research:
- Industry drivers, restraints, and opportunities covered in the study
- Neutral perspective on the market performance
- Recent industry trends and developments
- Competitive landscape & strategies of key players
- Potential & niche segments and regions exhibiting promising growth covered
- Historical, current, and projected market size, in terms of value
- In-depth analysis of the High Reliability Passive Electronic Components Market
- Overview of the regional outlook of the High Reliability Passive Electronic Components Market:
Key Reasons to Buy this Report:
- Access to date statistics compiled by our researchers. These provide you with historical and forecast data, which is analyzed to tell you why your market is set to change
- This enables you to anticipate market changes to remain ahead of your competitors
- You will be able to copy data from the Excel spreadsheet straight into your marketing plans, business presentations, or other strategic documents
- The concise analysis, clear graph, and table format will enable you to pinpoint the information you require quickly
- Provision of market value data for each segment and sub-segment
- Indicates the region and segment that is expected to witness the fastest growth as well as to dominate the market
- Analysis by geography highlighting the consumption of the product/service in the region as well as indicating the factors that are affecting the market within each region
- Includes in-depth analysis of the market from various perspectives through Porters five forces analysis
- Provides insight into the market through Value Chain
- Market dynamics scenario, along with growth opportunities of the market in the years to come
- 6-month post-sales analyst support
Customization of the Report
In case of any queries or customization requirements, please connect with our sales team, who will ensure that your requirements are met.
FAQs
Q: What are the key driving factors and opportunities in the High Reliability Passive Electronic Components market?
A: The market is driven by the rising demand in aerospace, defense, and industrial automation, along with opportunities in emerging markets and next-gen technology developments.
Q: Which region is projected to have the largest market share?
A: Asia-Pacific is expected to dominate the market due to rapid industrialization, strong manufacturing capabilities, and increasing demand from the automotive and consumer electronics sectors.
Q: Who are the top players in the global High Reliability Passive Electronic Components market?
A: Leading companies include Murata, TDK Corporation, Samsung Electro-Mechanics, Taiyo Yuden, Yageo, Kyocera, Vishay, and TE Connectivity.
Q: What are the latest technological advancements in the industry?
A: Key advancements include miniaturization of components, development of high-temperature-resistant materials, and the integration of AI-driven monitoring systems for better performance.
Q: What is the current size of the global High Reliability Passive Electronic Components market?
A: The market was valued at USD 7122 million in 2023 and is projected to reach USD 9962.73 million by 2032, growing at a CAGR of 3.80%.
Get Sample Report PDF for Exclusive Insights
Report Sample Includes
- Table of Contents
- List of Tables & Figures
- Charts, Research Methodology, and more...


