High-Power DFB Chips Market, Trends, Business Strategies 2025-2032

High-Power DFB Chips Market was valued at 4379 million in 2024 and is projected to reach US$ 9997 million by 2032, at a CAGR of 12.8% during the forecast period

PDF Icon Download Sample Report PDF
  • Quick Dispatch

    All Orders

  • Secure Payment

    100% Secure Payment

Price range: $1,500.00 through $4,250.00

Clear

MARKET INSIGHTS

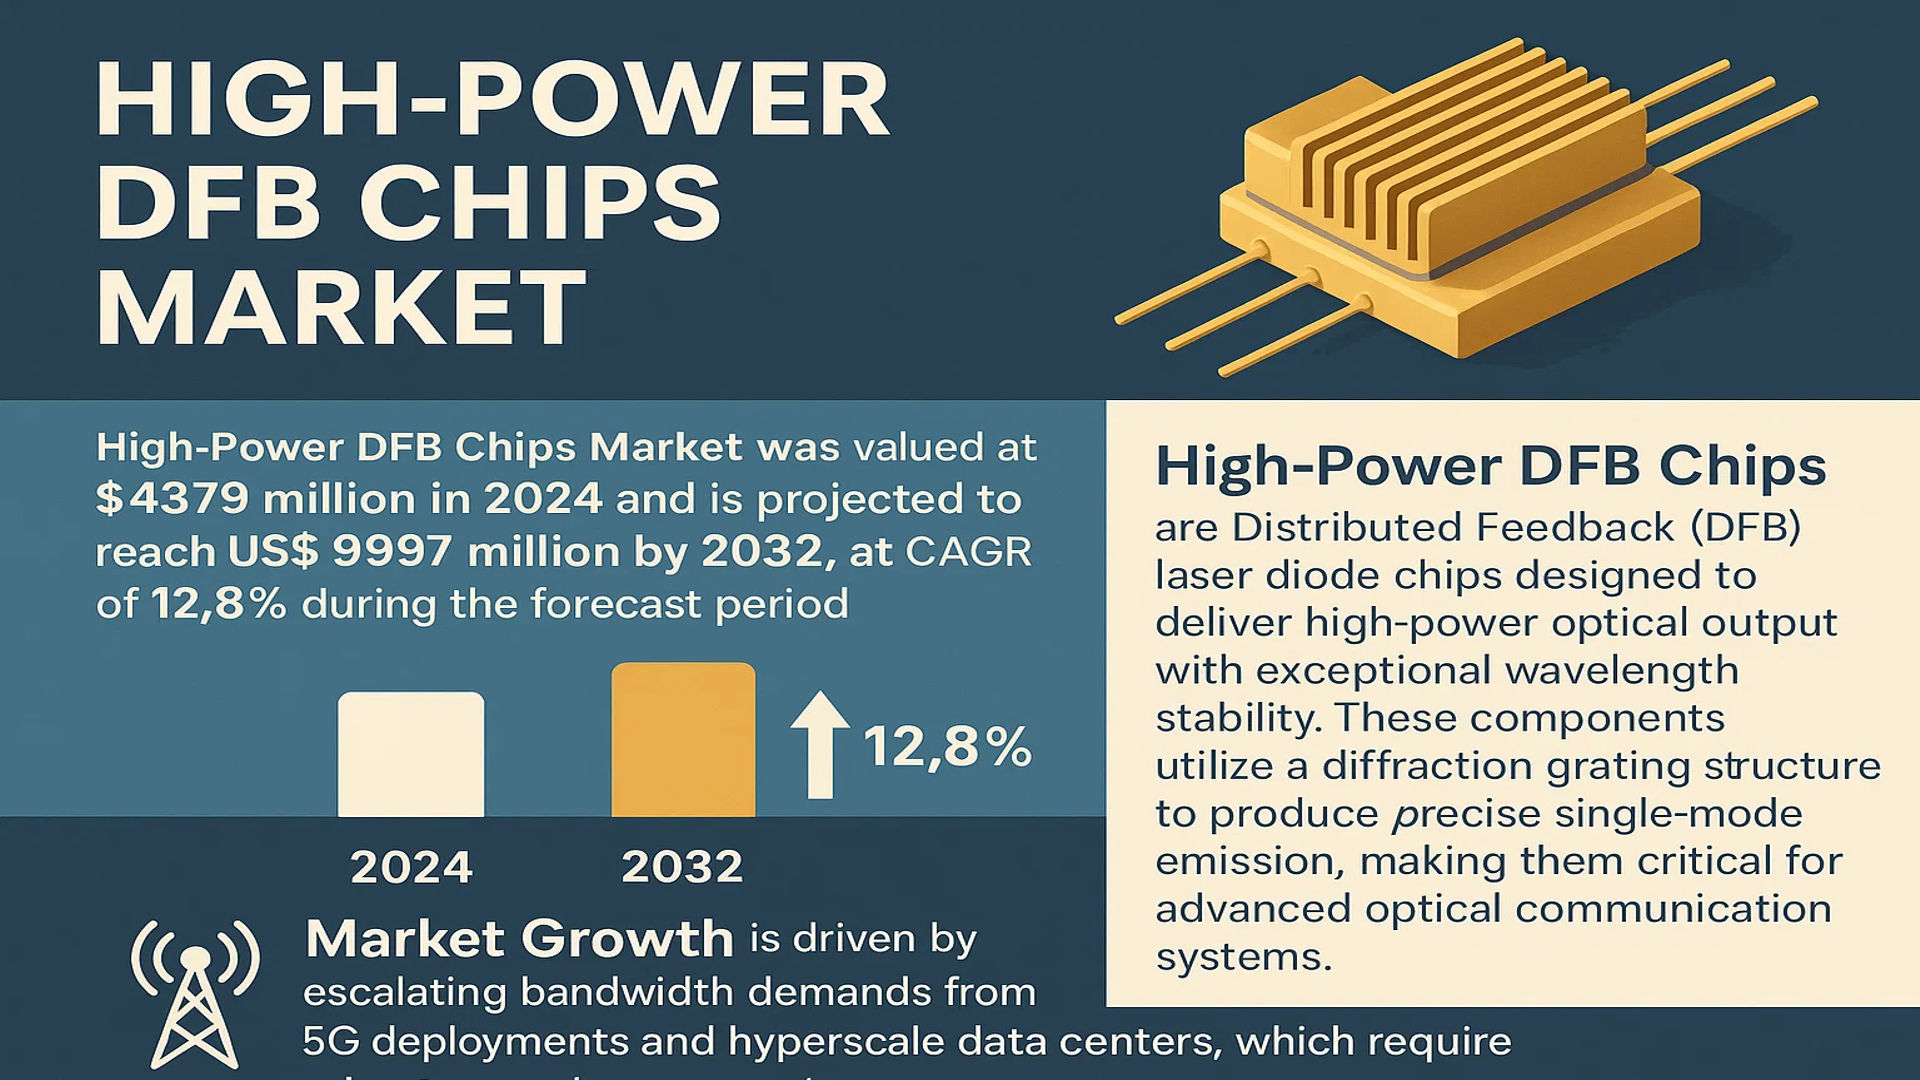
The global High-Power DFB Chips Market was valued at 4379 million in 2024 and is projected to reach US$ 9997 million by 2032, at a CAGR of 12.8% during the forecast period.

High-Power DFB Chips are Distributed Feedback (DFB) laser diode chips designed to deliver high-power optical output with exceptional wavelength stability. These components utilize a diffraction grating structure to produce precise single-mode emission, making them critical for advanced optical communication systems. Their applications span across telecommunications infrastructure, data center interconnects, and high-speed fiber-optic networks due to their superior performance in signal integrity and power efficiency.

The market growth is driven by escalating bandwidth demands from 5G deployments and hyperscale data centers, which require robust optical components. While North America currently dominates adoption due to early infrastructure modernization, Asia-Pacific is witnessing accelerated growth because of massive telecom investments in China and Japan. Recent advancements include Lumentum’s 2024 launch of 200mW DFB chips for next-gen transceivers, reflecting industry efforts to address the need for higher power densities in compact form factors. Key players like Coherent (II-VI) and Mitsubishi Electric continue to innovate in materials and packaging to enhance thermal management and reliability.

High-Power DFB Chips Market

MARKET DYNAMICS

MARKET DRIVERS

Explosive Growth of Data Centers and 5G Deployment to Accelerate Demand

The rapid expansion of hyperscale data centers and the global rollout of 5G networks are primary drivers for the high-power DFB chips market. With data traffic projected to grow at nearly 30% annually, the demand for high-bandwidth optical communication components has surged. High-power DFB chips, known for their reliability and efficiency, are critical for 100G/400G optical transceivers used in data center interconnects. By 2030, investments in data center infrastructure are expected to exceed $250 billion globally, further accelerating the adoption of these components.

Advancements in Telecom and Fiber Optic Networks Fuel Market Expansion

Telecommunication operators are aggressively upgrading their networks to support next-generation broadband services, driving substantial demand for high-power DFB chips. These chips enable long-haul and metro optical transmissions by minimizing signal loss. The fiber optics market, valued at over $10 billion in 2024, is expected to witness sustained growth due to government initiatives promoting fiber-to-the-home (FTTH) deployments. This, in turn, creates a strong downstream demand for DFB-based laser components optimized for high-performance applications.

For instance, leading chip manufacturers have introduced wavelength-stabilized DFB lasers with power outputs exceeding 300mW, specifically designed for advanced coherent communication systems.

Rising Demand for Coherent Optics in Enterprise and Cloud Applications

Coherent optical technology, which relies heavily on high-power DFB lasers, is gaining traction in enterprise networks and cloud computing. The push toward petabit-scale networking requires lasers with superior linearity and power efficiency, making DFB chips indispensable. With cloud service providers increasingly dominating IT spending—projected to account for nearly 60% of enterprise IT budgets by 2026—the need for scalable and power-efficient optical solutions continues to rise.

MARKET RESTRAINTS

High Manufacturing Complexity and Yield Challenges Impede Growth

Despite growing demand, fabrication challenges and stringent performance requirements limit production scalability. DFB chips require precise wavelength control and defect-free epitaxial growth, leading to higher manufacturing costs. Yield rates for high-power variants often fall below 50%, increasing overall unit costs. Additionally, the reliance on specialized semiconductor materials such as InP (indium phosphide) further complicates supply chain stability, especially with global semiconductor shortages affecting production capacities.

Thermal Management and Reliability Concerns Pose Technical Barriers

Thermal dissipation remains a critical limitation for high-power DFB lasers, as excessive heat degrades performance and lifespan. Maintaining consistent output power at elevated temperatures requires advanced cooling solutions, increasing both device complexity and cost. For applications in harsh environments, such as undersea cables or industrial settings, these thermal constraints can limit deployment flexibility. With network operators demanding 10+ years of operational reliability, manufacturers face significant pressure to enhance thermal stability without compromising efficiency.

MARKET OPPORTUNITIES

Emergence of LiDAR and Automotive Sensing to Open New Revenue Streams

Beyond telecommunications, high-power DFB chips are gaining traction in automotive LiDAR and industrial sensing applications. The global LiDAR market is forecasted to surpass $5 billion by 2030, driven by autonomous vehicle adoption. DFB lasers, with their narrow linewidth and high coherence, are ideal for long-range, high-resolution LiDAR systems. This diversification into non-telecom sectors provides manufacturers with a lucrative avenue to offset cyclical demand in the datacom industry.

Strategic Collaborations to Accelerate Product Innovation

Leading optoelectronic firms are forming alliances with semiconductor foundries to co-develop next-gen DFB platforms. These partnerships aim to leverage silicon photonics integration, reducing costs while improving yield and performance. With decreasing reliance on discrete components, hybrid silicon/InP lasers are emerging as a disruptive force, positioning key players to capture market share in emerging applications like quantum communications and biomedical imaging.

MARKET CHALLENGES

Intense Price Competition from Alternative Technologies

The high-power DFB segment faces mounting competition from VCSELs (Vertical-Cavity Surface-Emitting Lasers) and EMLs (Electro-Absorption Modulated Lasers), which offer cost advantages for short-reach applications. Price erosion in the optical component market—exceeding 10% annually—compels DFB manufacturers to innovate aggressively or risk losing market share. While DFB chips remain unrivaled for long-haul transmission, their adoption in cost-sensitive edge networks remains constrained.

Regulatory and Trade Barriers Impact Supply Chain Efficiency

Geopolitical trade restrictions on semiconductor materials, particularly those involving gallium and germanium, threaten production stability. Export controls introduced in 2024 have disrupted InP wafer supplies, forcing manufacturers to seek alternative sourcing strategies. Additionally, differing regional standards for optical component certifications increase time-to-market for new DFB products, delaying revenue realization in critical growth markets.

HIGH-POWER DFB CHIPS MARKET TRENDS

Expansion of Data Centers Fuels Demand for High-Power DFB Chips

The global surge in data center construction is creating unprecedented demand for high-power distributed feedback (DFB) laser chips, which enable high-speed optical communication. With data traffic growing at a compound annual rate exceeding 30% since 2020, hyperscale operators are investing heavily in 400G and 800G optical transceivers that rely on these components. Shipments of high-power DFB chips for data center applications increased by 22% year-over-year in 2023, reflecting their critical role in next-generation networking infrastructure. While traditional telecom applications still dominate, the data center segment is projected to become the fastest-growing vertical by 2026 due to advances in co-packaged optics.

Other Trends

5G Network Deployments Accelerate Adoption

Massive 5G rollouts worldwide are driving strong demand for high-power DFB chips in fronthaul and midhaul networks. These components provide the necessary optical performance for 25G and 50G wavelengths in cell site connectivity. Over 300 mobile operators had launched commercial 5G services as of early 2024, requiring dense deployments of small cells and distributed antenna systems. The transition to Open RAN architectures further boosts demand because these open interfaces rely heavily on optical components for flexible radio unit connections.

Technological Innovations Enhance Performance Specifications

Manufacturers are achieving breakthroughs in DFB chip performance through improved epitaxial growth techniques and novel cavity designs. Recent product launches demonstrate output powers exceeding 100mW while maintaining single-mode stability – a critical requirement for long-reach optical links. Advanced packaging solutions using silicon photonics integration are reducing power consumption by 15-20% compared to conventional designs, directly addressing thermal management challenges in high-density applications. These innovations come as the market shifts toward higher wavelength ranges, with 1310nm and 1550nm chips gaining share against traditional 850nm products due to their superior propagation characteristics.

COMPETITIVE LANDSCAPE

Key Industry Players

Photonic Innovation Drives Competition as Market Expands Rapidly

The global High-Power DFB Chips market features a dynamic mix of established photonics leaders and emerging players competing for market share. Lumentum stands out as a dominant force, leveraging its vertically integrated manufacturing capabilities and strong relationships with data center operators. The company’s recent expansion of its 100G+ CW DFB laser portfolio has reinforced its leadership position in optical communications.

Coherent (II-VI) and Mitsubishi Electric follow closely, benefiting from their expertise in compound semiconductors and industrial laser applications. These companies have demonstrated particular strength in long-wavelength DFB chips for telecommunications, capturing significant share in Asian markets where 5G infrastructure deployment continues to accelerate.

The competitive environment is intensifying as companies invest heavily in research and development to improve chip performance metrics including wall-plug efficiency and thermal stability. Source Photonics recently introduced a new generation of temperature-stable DFB chips that has gained rapid adoption in hyperscale data centers, while Broadcom is making strategic moves to integrate its DFB technology with silicon photonics platforms.

Meanwhile, Japanese manufacturers like Sumitomo and Furukawa Electric maintain strong positions through specialized products for the metro and access network segments. These companies have successfully leveraged their vertical integration from materials to finished components to deliver cost-competitive solutions for high-volume applications.

List of Key High-Power DFB Chip Manufacturers

Segment Analysis:

By Type

Short-Wavelength DFB Chips Dominate the Market Due to High Demand in Optical Communication Systems

The market is segmented based on type into:

  • Short-Wavelength
    • Subtypes: 1310 nm, 1490 nm, and others
  • Long-Wavelength
    • Subtypes: 1550 nm, 1610 nm, and others
  • Others

By Application

Telecommunications Segment Leads Due to Rising Need for High-Speed Data Transmission

The market is segmented based on application into:

  • Telecommunications
  • Data Center Interconnection (DCI Network)
  • Optical Networking
  • Others

By Power Output

Medium-Power Output Segment Gains Traction Due to Balanced Performance and Cost-Effectiveness

The market is segmented based on power output into:

  • Low-Power (Below 50 mW)
  • Medium-Power (50-100 mW)
  • High-Power (Above 100 mW)

Regional Analysis: High-Power DFB Chips Market

Asia-Pacific
The Asia-Pacific region dominates the global High-Power DFB Chips market, primarily driven by China’s aggressive expansion in 5G infrastructure and data center construction. With over 600 data centers currently operational in China and another 200+ under development, the demand for high-performance optical components remains exceptionally strong. Japan and South Korea follow closely, with their established semiconductor industries investing heavily in photonics innovation. While cost competition remains intense, regional manufacturers benefit from vertically integrated supply chains and government support for domestic semiconductor production. The region’s focus on automation and smart manufacturing further accelerates adoption, particularly in industrial laser applications.

North America
North America maintains technological leadership in High-Power DFB Chip development, with U.S.-based firms like Lumentum and Broadcom controlling critical IP. The market thrives on demand from hyperscale data centers – Microsoft, Google and Amazon Web Services collectively operate over 300 facilities across the region. Recent investments in quantum computing and silicon photonics R&D are creating new application spaces beyond traditional telecommunications. Strict export controls on advanced photonics components to China have paradoxically strengthened domestic supply chains, while Canadian firms benefit from cross-border collaboration in quantum technologies.

Europe
Europe’s market grows steadily through specialized industrial and automotive applications, with Germany’s photonics cluster leading in precision manufacturing uses. The EU’s Photonics21 initiative continues to fund next-generation laser development, though commercialization lags behind Asian and American competitors. Telecom operators’ gradual 5G rollout provides stable demand, while medical laser applications present high-margin opportunities. Brexit-related supply chain disruptions have prompted some UK-based firms to establish continental operations, but the Cambridge and Southampton photonics hubs retain strong R&D capabilities in specialized DFB applications.

Middle East & Africa
This emerging market shows promise through smart city initiatives in UAE and Saudi Arabia, where high-power optical components enable next-generation surveillance and communication infrastructure. Israel’s defense sector drives innovation in ruggedized DFB solutions, with civilian applications gradually emerging. Although current volumes remain modest compared to other regions, strategic investments in subsea cable landing stations and regional data hubs suggest long-term growth potential. The lack of local manufacturing means nearly all components are imported, creating opportunities for distributors with strong regional logistics networks.

South America
South America’s market remains nascent but exhibits pockets of growth in Brazil’s telecom sector and Chile’s data center corridors. Economic instability and currency volatility continue to hinder large-scale adoption, pushing most operators toward cost-sensitive solutions rather than cutting-edge DFB technology. However, Brazil’s recent spectrum auctions for 5G services and Mexico’s growing manufacturing sector may stimulate demand for higher-performance optical components. Most regional activity centers on equipment upgrades rather than greenfield deployments, with multinational suppliers dominating the limited high-end market.

Report Scope

This market research report provides a comprehensive analysis of the global and regional High-Power DFB Chips markets, covering the forecast period 2025–2032. It offers detailed insights into market dynamics, technological advancements, competitive landscape, and key trends shaping the industry.

Key focus areas of the report include:

  • Market Size & Forecast: Historical data and future projections for revenue, unit shipments, and market value across major regions and segments. The global High-Power DFB Chips market was valued at USD 4,379 million in 2024 and is projected to reach USD 9,997 million by 2032, growing at a CAGR of 12.8%.
  • Segmentation Analysis: Detailed breakdown by product type (Short-Wavelength, Long-Wavelength), application (Telecommunications, Data Center Interconnection), and end-user industry to identify high-growth segments.
  • Regional Outlook: Insights into market performance across North America (U.S., Canada, Mexico), Europe (Germany, France, UK), Asia-Pacific (China, Japan, South Korea), Latin America, and Middle East & Africa.
  • Competitive Landscape: Profiles of leading market participants including Lumentum, Coherent (II-VI), Mitsubishi Electric, Source Photonics, and Broadcom, covering their market share, product portfolios, and strategic initiatives.
  • Technology Trends & Innovation: Assessment of emerging optical communication technologies, fabrication advancements, and integration with 5G networks.
  • Market Drivers & Restraints: Evaluation of factors such as growing data center demand, 5G deployment, along with supply chain challenges and material costs.
  • Stakeholder Analysis: Strategic insights for semiconductor manufacturers, optical component suppliers, network operators, and investors.

The research employs primary interviews with industry experts and analysis of verified market data to ensure accuracy and reliability of findings.

FREQUENTLY ASKED QUESTIONS:

What is the current market size of Global High-Power DFB Chips Market?

-> High-Power DFB Chips Market was valued at 4379 million in 2024 and is projected to reach US$ 9997 million by 2032, at a CAGR of 12.8% during the forecast period.

Which key companies operate in Global High-Power DFB Chips Market?

-> Key players include Lumentum, Coherent (II-VI), Mitsubishi Electric, Source Photonics, Broadcom, Sumitomo, and Applied Optoelectronics, among others.

What are the key growth drivers?

-> Key growth drivers include increasing data center investments, 5G network expansion, and demand for high-speed optical communication systems.

Which region dominates the market?

-> Asia-Pacific shows the highest growth potential, while North America currently holds significant market share.

What are the emerging trends?

-> Emerging trends include integration with silicon photonics, development of higher-power chips, and adoption in quantum computing applications.

High-Power DFB Chips Market, Trends, Business Strategies 2025-2032

Get Sample Report PDF for Exclusive Insights

Report Sample Includes

  • Table of Contents
  • List of Tables & Figures
  • Charts, Research Methodology, and more...
PDF Icon Download Sample Report PDF
SKU: bde6bd7fcced
Category:

Download Sample Report

Table of Content

1 Introduction to Research & Analysis Reports
1.1 High-Power DFB Chips Market Definition
1.2 Market Segments
1.2.1 Segment by Type
1.2.2 Segment by Application
1.3 Global High-Power DFB Chips Market Overview
1.4 Features & Benefits of This Report
1.5 Methodology & Sources of Information
1.5.1 Research Methodology
1.5.2 Research Process
1.5.3 Base Year
1.5.4 Report Assumptions & Caveats
2 Global High-Power DFB Chips Overall Market Size
2.1 Global High-Power DFB Chips Market Size: 2024 VS 2032
2.2 Global High-Power DFB Chips Market Size, Prospects & Forecasts: 2020-2032
2.3 Global High-Power DFB Chips Sales: 2020-2032
3 Company Landscape
3.1 Top High-Power DFB Chips Players in Global Market
3.2 Top Global High-Power DFB Chips Companies Ranked by Revenue
3.3 Global High-Power DFB Chips Revenue by Companies
3.4 Global High-Power DFB Chips Sales by Companies
3.5 Global High-Power DFB Chips Price by Manufacturer (2020-2025)
3.6 Top 3 and Top 5 High-Power DFB Chips Companies in Global Market, by Revenue in 2024
3.7 Global Manufacturers High-Power DFB Chips Product Type
3.8 Tier 1, Tier 2, and Tier 3 High-Power DFB Chips Players in Global Market
3.8.1 List of Global Tier 1 High-Power DFB Chips Companies
3.8.2 List of Global Tier 2 and Tier 3 High-Power DFB Chips Companies
4 Sights by Product
4.1 Overview
4.1.1 Segment by Type – Global High-Power DFB Chips Market Size Markets, 2024 & 2032
4.1.2 Short-Wavelength
4.1.3 Long-Wavelength
4.2 Segment by Type – Global High-Power DFB Chips Revenue & Forecasts
4.2.1 Segment by Type – Global High-Power DFB Chips Revenue, 2020-2025
4.2.2 Segment by Type – Global High-Power DFB Chips Revenue, 2026-2032
4.2.3 Segment by Type – Global High-Power DFB Chips Revenue Market Share, 2020-2032
4.3 Segment by Type – Global High-Power DFB Chips Sales & Forecasts
4.3.1 Segment by Type – Global High-Power DFB Chips Sales, 2020-2025
4.3.2 Segment by Type – Global High-Power DFB Chips Sales, 2026-2032
4.3.3 Segment by Type – Global High-Power DFB Chips Sales Market Share, 2020-2032
4.4 Segment by Type – Global High-Power DFB Chips Price (Manufacturers Selling Prices), 2020-2032
5 Sights by Application
5.1 Overview
5.1.1 Segment by Application – Global High-Power DFB Chips Market Size, 2024 & 2032
5.1.2 Telecommunications
5.1.3 Data Center Interconnection (DCI Network)
5.2 Segment by Application – Global High-Power DFB Chips Revenue & Forecasts
5.2.1 Segment by Application – Global High-Power DFB Chips Revenue, 2020-2025
5.2.2 Segment by Application – Global High-Power DFB Chips Revenue, 2026-2032
5.2.3 Segment by Application – Global High-Power DFB Chips Revenue Market Share, 2020-2032
5.3 Segment by Application – Global High-Power DFB Chips Sales & Forecasts
5.3.1 Segment by Application – Global High-Power DFB Chips Sales, 2020-2025
5.3.2 Segment by Application – Global High-Power DFB Chips Sales, 2026-2032
5.3.3 Segment by Application – Global High-Power DFB Chips Sales Market Share, 2020-2032
5.4 Segment by Application – Global High-Power DFB Chips Price (Manufacturers Selling Prices), 2020-2032
6 Sights by Region
6.1 By Region – Global High-Power DFB Chips Market Size, 2024 & 2032
6.2 By Region – Global High-Power DFB Chips Revenue & Forecasts
6.2.1 By Region – Global High-Power DFB Chips Revenue, 2020-2025
6.2.2 By Region – Global High-Power DFB Chips Revenue, 2026-2032
6.2.3 By Region – Global High-Power DFB Chips Revenue Market Share, 2020-2032
6.3 By Region – Global High-Power DFB Chips Sales & Forecasts
6.3.1 By Region – Global High-Power DFB Chips Sales, 2020-2025
6.3.2 By Region – Global High-Power DFB Chips Sales, 2026-2032
6.3.3 By Region – Global High-Power DFB Chips Sales Market Share, 2020-2032
6.4 North America
6.4.1 By Country – North America High-Power DFB Chips Revenue, 2020-2032
6.4.2 By Country – North America High-Power DFB Chips Sales, 2020-2032
6.4.3 United States High-Power DFB Chips Market Size, 2020-2032
6.4.4 Canada High-Power DFB Chips Market Size, 2020-2032
6.4.5 Mexico High-Power DFB Chips Market Size, 2020-2032
6.5 Europe
6.5.1 By Country – Europe High-Power DFB Chips Revenue, 2020-2032
6.5.2 By Country – Europe High-Power DFB Chips Sales, 2020-2032
6.5.3 Germany High-Power DFB Chips Market Size, 2020-2032
6.5.4 France High-Power DFB Chips Market Size, 2020-2032
6.5.5 U.K. High-Power DFB Chips Market Size, 2020-2032
6.5.6 Italy High-Power DFB Chips Market Size, 2020-2032
6.5.7 Russia High-Power DFB Chips Market Size, 2020-2032
6.5.8 Nordic Countries High-Power DFB Chips Market Size, 2020-2032
6.5.9 Benelux High-Power DFB Chips Market Size, 2020-2032
6.6 Asia
6.6.1 By Region – Asia High-Power DFB Chips Revenue, 2020-2032
6.6.2 By Region – Asia High-Power DFB Chips Sales, 2020-2032
6.6.3 China High-Power DFB Chips Market Size, 2020-2032
6.6.4 Japan High-Power DFB Chips Market Size, 2020-2032
6.6.5 South Korea High-Power DFB Chips Market Size, 2020-2032
6.6.6 Southeast Asia High-Power DFB Chips Market Size, 2020-2032
6.6.7 India High-Power DFB Chips Market Size, 2020-2032
6.7 South America
6.7.1 By Country – South America High-Power DFB Chips Revenue, 2020-2032
6.7.2 By Country – South America High-Power DFB Chips Sales, 2020-2032
6.7.3 Brazil High-Power DFB Chips Market Size, 2020-2032
6.7.4 Argentina High-Power DFB Chips Market Size, 2020-2032
6.8 Middle East & Africa
6.8.1 By Country – Middle East & Africa High-Power DFB Chips Revenue, 2020-2032
6.8.2 By Country – Middle East & Africa High-Power DFB Chips Sales, 2020-2032
6.8.3 Turkey High-Power DFB Chips Market Size, 2020-2032
6.8.4 Israel High-Power DFB Chips Market Size, 2020-2032
6.8.5 Saudi Arabia High-Power DFB Chips Market Size, 2020-2032
6.8.6 UAE High-Power DFB Chips Market Size, 2020-2032
7 Manufacturers & Brands Profiles
7.1 Lumentum
7.1.1 Lumentum Company Summary
7.1.2 Lumentum Business Overview
7.1.3 Lumentum High-Power DFB Chips Major Product Offerings
7.1.4 Lumentum High-Power DFB Chips Sales and Revenue in Global (2020-2025)
7.1.5 Lumentum Key News & Latest Developments
7.2 Coherent (II-VI)
7.2.1 Coherent (II-VI) Company Summary
7.2.2 Coherent (II-VI) Business Overview
7.2.3 Coherent (II-VI) High-Power DFB Chips Major Product Offerings
7.2.4 Coherent (II-VI) High-Power DFB Chips Sales and Revenue in Global (2020-2025)
7.2.5 Coherent (II-VI) Key News & Latest Developments
7.3 Mitsubishi Electric
7.3.1 Mitsubishi Electric Company Summary
7.3.2 Mitsubishi Electric Business Overview
7.3.3 Mitsubishi Electric High-Power DFB Chips Major Product Offerings
7.3.4 Mitsubishi Electric High-Power DFB Chips Sales and Revenue in Global (2020-2025)
7.3.5 Mitsubishi Electric Key News & Latest Developments
7.4 Source Photonics
7.4.1 Source Photonics Company Summary
7.4.2 Source Photonics Business Overview
7.4.3 Source Photonics High-Power DFB Chips Major Product Offerings
7.4.4 Source Photonics High-Power DFB Chips Sales and Revenue in Global (2020-2025)
7.4.5 Source Photonics Key News & Latest Developments
7.5 Broadcom
7.5.1 Broadcom Company Summary
7.5.2 Broadcom Business Overview
7.5.3 Broadcom High-Power DFB Chips Major Product Offerings
7.5.4 Broadcom High-Power DFB Chips Sales and Revenue in Global (2020-2025)
7.5.5 Broadcom Key News & Latest Developments
7.6 Sumitomo
7.6.1 Sumitomo Company Summary
7.6.2 Sumitomo Business Overview
7.6.3 Sumitomo High-Power DFB Chips Major Product Offerings
7.6.4 Sumitomo High-Power DFB Chips Sales and Revenue in Global (2020-2025)
7.6.5 Sumitomo Key News & Latest Developments
7.7 Applied Optoelectronics
7.7.1 Applied Optoelectronics Company Summary
7.7.2 Applied Optoelectronics Business Overview
7.7.3 Applied Optoelectronics High-Power DFB Chips Major Product Offerings
7.7.4 Applied Optoelectronics High-Power DFB Chips Sales and Revenue in Global (2020-2025)
7.7.5 Applied Optoelectronics Key News & Latest Developments
7.8 NTT Electronics
7.8.1 NTT Electronics Company Summary
7.8.2 NTT Electronics Business Overview
7.8.3 NTT Electronics High-Power DFB Chips Major Product Offerings
7.8.4 NTT Electronics High-Power DFB Chips Sales and Revenue in Global (2020-2025)
7.8.5 NTT Electronics Key News & Latest Developments
7.9 Furukawa Electric
7.9.1 Furukawa Electric Company Summary
7.9.2 Furukawa Electric Business Overview
7.9.3 Furukawa Electric High-Power DFB Chips Major Product Offerings
7.9.4 Furukawa Electric High-Power DFB Chips Sales and Revenue in Global (2020-2025)
7.9.5 Furukawa Electric Key News & Latest Developments
7.10 Macom
7.10.1 Macom Company Summary
7.10.2 Macom Business Overview
7.10.3 Macom High-Power DFB Chips Major Product Offerings
7.10.4 Macom High-Power DFB Chips Sales and Revenue in Global (2020-2025)
7.10.5 Macom Key News & Latest Developments
8 Global High-Power DFB Chips Production Capacity, Analysis
8.1 Global High-Power DFB Chips Production Capacity, 2020-2032
8.2 High-Power DFB Chips Production Capacity of Key Manufacturers in Global Market
8.3 Global High-Power DFB Chips Production by Region
9 Key Market Trends, Opportunity, Drivers and Restraints
9.1 Market Opportunities & Trends
9.2 Market Drivers
9.3 Market Restraints
10 High-Power DFB Chips Supply Chain Analysis
10.1 High-Power DFB Chips Industry Value Chain
10.2 High-Power DFB Chips Upstream Market
10.3 High-Power DFB Chips Downstream and Clients
10.4 Marketing Channels Analysis
10.4.1 Marketing Channels
10.4.2 High-Power DFB Chips Distributors and Sales Agents in Global
11 Conclusion
12 Appendix
12.1 Note
12.2 Examples of Clients
12.3 DisclaimerList of Tables
Table 1. Key Players of High-Power DFB Chips in Global Market
Table 2. Top High-Power DFB Chips Players in Global Market, Ranking by Revenue (2024)
Table 3. Global High-Power DFB Chips Revenue by Companies, (US$, Mn), 2020-2025
Table 4. Global High-Power DFB Chips Revenue Share by Companies, 2020-2025
Table 5. Global High-Power DFB Chips Sales by Companies, (K Units), 2020-2025
Table 6. Global High-Power DFB Chips Sales Share by Companies, 2020-2025
Table 7. Key Manufacturers High-Power DFB Chips Price (2020-2025) & (US$/Unit)
Table 8. Global Manufacturers High-Power DFB Chips Product Type
Table 9. List of Global Tier 1 High-Power DFB Chips Companies, Revenue (US$, Mn) in 2024 and Market Share
Table 10. List of Global Tier 2 and Tier 3 High-Power DFB Chips Companies, Revenue (US$, Mn) in 2024 and Market Share
Table 11. Segment by Type – Global High-Power DFB Chips Revenue, (US$, Mn), 2024 & 2032
Table 12. Segment by Type – Global High-Power DFB Chips Revenue (US$, Mn), 2020-2025
Table 13. Segment by Type – Global High-Power DFB Chips Revenue (US$, Mn), 2026-2032
Table 14. Segment by Type – Global High-Power DFB Chips Sales (K Units), 2020-2025
Table 15. Segment by Type – Global High-Power DFB Chips Sales (K Units), 2026-2032
Table 16. Segment by Application – Global High-Power DFB Chips Revenue, (US$, Mn), 2024 & 2032
Table 17. Segment by Application – Global High-Power DFB Chips Revenue, (US$, Mn), 2020-2025
Table 18. Segment by Application – Global High-Power DFB Chips Revenue, (US$, Mn), 2026-2032
Table 19. Segment by Application – Global High-Power DFB Chips Sales, (K Units), 2020-2025
Table 20. Segment by Application – Global High-Power DFB Chips Sales, (K Units), 2026-2032
Table 21. By Region – Global High-Power DFB Chips Revenue, (US$, Mn), 2025-2032
Table 22. By Region – Global High-Power DFB Chips Revenue, (US$, Mn), 2020-2025
Table 23. By Region – Global High-Power DFB Chips Revenue, (US$, Mn), 2026-2032
Table 24. By Region – Global High-Power DFB Chips Sales, (K Units), 2020-2025
Table 25. By Region – Global High-Power DFB Chips Sales, (K Units), 2026-2032
Table 26. By Country – North America High-Power DFB Chips Revenue, (US$, Mn), 2020-2025
Table 27. By Country – North America High-Power DFB Chips Revenue, (US$, Mn), 2026-2032
Table 28. By Country – North America High-Power DFB Chips Sales, (K Units), 2020-2025
Table 29. By Country – North America High-Power DFB Chips Sales, (K Units), 2026-2032
Table 30. By Country – Europe High-Power DFB Chips Revenue, (US$, Mn), 2020-2025
Table 31. By Country – Europe High-Power DFB Chips Revenue, (US$, Mn), 2026-2032
Table 32. By Country – Europe High-Power DFB Chips Sales, (K Units), 2020-2025
Table 33. By Country – Europe High-Power DFB Chips Sales, (K Units), 2026-2032
Table 34. By Region – Asia High-Power DFB Chips Revenue, (US$, Mn), 2020-2025
Table 35. By Region – Asia High-Power DFB Chips Revenue, (US$, Mn), 2026-2032
Table 36. By Region – Asia High-Power DFB Chips Sales, (K Units), 2020-2025
Table 37. By Region – Asia High-Power DFB Chips Sales, (K Units), 2026-2032
Table 38. By Country – South America High-Power DFB Chips Revenue, (US$, Mn), 2020-2025
Table 39. By Country – South America High-Power DFB Chips Revenue, (US$, Mn), 2026-2032
Table 40. By Country – South America High-Power DFB Chips Sales, (K Units), 2020-2025
Table 41. By Country – South America High-Power DFB Chips Sales, (K Units), 2026-2032
Table 42. By Country – Middle East & Africa High-Power DFB Chips Revenue, (US$, Mn), 2020-2025
Table 43. By Country – Middle East & Africa High-Power DFB Chips Revenue, (US$, Mn), 2026-2032
Table 44. By Country – Middle East & Africa High-Power DFB Chips Sales, (K Units), 2020-2025
Table 45. By Country – Middle East & Africa High-Power DFB Chips Sales, (K Units), 2026-2032
Table 46. Lumentum Company Summary
Table 47. Lumentum High-Power DFB Chips Product Offerings
Table 48. Lumentum High-Power DFB Chips Sales (K Units), Revenue (US$, Mn) and Average Price (US$/Unit) & (2020-2025)
Table 49. Lumentum Key News & Latest Developments
Table 50. Coherent (II-VI) Company Summary
Table 51. Coherent (II-VI) High-Power DFB Chips Product Offerings
Table 52. Coherent (II-VI) High-Power DFB Chips Sales (K Units), Revenue (US$, Mn) and Average Price (US$/Unit) & (2020-2025)
Table 53. Coherent (II-VI) Key News & Latest Developments
Table 54. Mitsubishi Electric Company Summary
Table 55. Mitsubishi Electric High-Power DFB Chips Product Offerings
Table 56. Mitsubishi Electric High-Power DFB Chips Sales (K Units), Revenue (US$, Mn) and Average Price (US$/Unit) & (2020-2025)
Table 57. Mitsubishi Electric Key News & Latest Developments
Table 58. Source Photonics Company Summary
Table 59. Source Photonics High-Power DFB Chips Product Offerings
Table 60. Source Photonics High-Power DFB Chips Sales (K Units), Revenue (US$, Mn) and Average Price (US$/Unit) & (2020-2025)
Table 61. Source Photonics Key News & Latest Developments
Table 62. Broadcom Company Summary
Table 63. Broadcom High-Power DFB Chips Product Offerings
Table 64. Broadcom High-Power DFB Chips Sales (K Units), Revenue (US$, Mn) and Average Price (US$/Unit) & (2020-2025)
Table 65. Broadcom Key News & Latest Developments
Table 66. Sumitomo Company Summary
Table 67. Sumitomo High-Power DFB Chips Product Offerings
Table 68. Sumitomo High-Power DFB Chips Sales (K Units), Revenue (US$, Mn) and Average Price (US$/Unit) & (2020-2025)
Table 69. Sumitomo Key News & Latest Developments
Table 70. Applied Optoelectronics Company Summary
Table 71. Applied Optoelectronics High-Power DFB Chips Product Offerings
Table 72. Applied Optoelectronics High-Power DFB Chips Sales (K Units), Revenue (US$, Mn) and Average Price (US$/Unit) & (2020-2025)
Table 73. Applied Optoelectronics Key News & Latest Developments
Table 74. NTT Electronics Company Summary
Table 75. NTT Electronics High-Power DFB Chips Product Offerings
Table 76. NTT Electronics High-Power DFB Chips Sales (K Units), Revenue (US$, Mn) and Average Price (US$/Unit) & (2020-2025)
Table 77. NTT Electronics Key News & Latest Developments
Table 78. Furukawa Electric Company Summary
Table 79. Furukawa Electric High-Power DFB Chips Product Offerings
Table 80. Furukawa Electric High-Power DFB Chips Sales (K Units), Revenue (US$, Mn) and Average Price (US$/Unit) & (2020-2025)
Table 81. Furukawa Electric Key News & Latest Developments
Table 82. Macom Company Summary
Table 83. Macom High-Power DFB Chips Product Offerings
Table 84. Macom High-Power DFB Chips Sales (K Units), Revenue (US$, Mn) and Average Price (US$/Unit) & (2020-2025)
Table 85. Macom Key News & Latest Developments
Table 86. High-Power DFB Chips Capacity of Key Manufacturers in Global Market, 2023-2025 (K Units)
Table 87. Global High-Power DFB Chips Capacity Market Share of Key Manufacturers, 2023-2025
Table 88. Global High-Power DFB Chips Production by Region, 2020-2025 (K Units)
Table 89. Global High-Power DFB Chips Production by Region, 2026-2032 (K Units)
Table 90. High-Power DFB Chips Market Opportunities & Trends in Global Market
Table 91. High-Power DFB Chips Market Drivers in Global Market
Table 92. High-Power DFB Chips Market Restraints in Global Market
Table 93. High-Power DFB Chips Raw Materials
Table 94. High-Power DFB Chips Raw Materials Suppliers in Global Market
Table 95. Typical High-Power DFB Chips Downstream
Table 96. High-Power DFB Chips Downstream Clients in Global Market
Table 97. High-Power DFB Chips Distributors and Sales Agents in Global Market

List of Figures
Figure 1. High-Power DFB Chips Product Picture
Figure 2. High-Power DFB Chips Segment by Type in 2024
Figure 3. High-Power DFB Chips Segment by Application in 2024
Figure 4. Global High-Power DFB Chips Market Overview: 2024
Figure 5. Key Caveats
Figure 6. Global High-Power DFB Chips Market Size: 2024 VS 2032 (US$, Mn)
Figure 7. Global High-Power DFB Chips Revenue: 2020-2032 (US$, Mn)
Figure 8. High-Power DFB Chips Sales in Global Market: 2020-2032 (K Units)
Figure 9. The Top 3 and 5 Players Market Share by High-Power DFB Chips Revenue in 2024
Figure 10. Segment by Type – Global High-Power DFB Chips Revenue, (US$, Mn), 2024 & 2032
Figure 11. Segment by Type – Global High-Power DFB Chips Revenue Market Share, 2020-2032
Figure 12. Segment by Type – Global High-Power DFB Chips Sales Market Share, 2020-2032
Figure 13. Segment by Type – Global High-Power DFB Chips Price (US$/Unit), 2020-2032
Figure 14. Segment by Application – Global High-Power DFB Chips Revenue, (US$, Mn), 2024 & 2032
Figure 15. Segment by Application – Global High-Power DFB Chips Revenue Market Share, 2020-2032
Figure 16. Segment by Application – Global High-Power DFB Chips Sales Market Share, 2020-2032
Figure 17. Segment by Application -Global High-Power DFB Chips Price (US$/Unit), 2020-2032
Figure 18. By Region – Global High-Power DFB Chips Revenue, (US$, Mn), 2025 & 2032
Figure 19. By Region – Global High-Power DFB Chips Revenue Market Share, 2020 VS 2024 VS 2032
Figure 20. By Region – Global High-Power DFB Chips Revenue Market Share, 2020-2032
Figure 21. By Region – Global High-Power DFB Chips Sales Market Share, 2020-2032
Figure 22. By Country – North America High-Power DFB Chips Revenue Market Share, 2020-2032
Figure 23. By Country – North America High-Power DFB Chips Sales Market Share, 2020-2032
Figure 24. United States High-Power DFB Chips Revenue, (US$, Mn), 2020-2032
Figure 25. Canada High-Power DFB Chips Revenue, (US$, Mn), 2020-2032
Figure 26. Mexico High-Power DFB Chips Revenue, (US$, Mn), 2020-2032
Figure 27. By Country – Europe High-Power DFB Chips Revenue Market Share, 2020-2032
Figure 28. By Country – Europe High-Power DFB Chips Sales Market Share, 2020-2032
Figure 29. Germany High-Power DFB Chips Revenue, (US$, Mn), 2020-2032
Figure 30. France High-Power DFB Chips Revenue, (US$, Mn), 2020-2032
Figure 31. U.K. High-Power DFB Chips Revenue, (US$, Mn), 2020-2032
Figure 32. Italy High-Power DFB Chips Revenue, (US$, Mn), 2020-2032
Figure 33. Russia High-Power DFB Chips Revenue, (US$, Mn), 2020-2032
Figure 34. Nordic Countries High-Power DFB Chips Revenue, (US$, Mn), 2020-2032
Figure 35. Benelux High-Power DFB Chips Revenue, (US$, Mn), 2020-2032
Figure 36. By Region – Asia High-Power DFB Chips Revenue Market Share, 2020-2032
Figure 37. By Region – Asia High-Power DFB Chips Sales Market Share, 2020-2032
Figure 38. China High-Power DFB Chips Revenue, (US$, Mn), 2020-2032
Figure 39. Japan High-Power DFB Chips Revenue, (US$, Mn), 2020-2032
Figure 40. South Korea High-Power DFB Chips Revenue, (US$, Mn), 2020-2032
Figure 41. Southeast Asia High-Power DFB Chips Revenue, (US$, Mn), 2020-2032
Figure 42. India High-Power DFB Chips Revenue, (US$, Mn), 2020-2032
Figure 43. By Country – South America High-Power DFB Chips Revenue Market Share, 2020-2032
Figure 44. By Country – South America High-Power DFB Chips Sales, Market Share, 2020-2032
Figure 45. Brazil High-Power DFB Chips Revenue, (US$, Mn), 2020-2032
Figure 46. Argentina High-Power DFB Chips Revenue, (US$, Mn), 2020-2032
Figure 47. By Country – Middle East & Africa High-Power DFB Chips Revenue, Market Share, 2020-2032
Figure 48. By Country – Middle East & Africa High-Power DFB Chips Sales, Market Share, 2020-2032
Figure 49. Turkey High-Power DFB Chips Revenue, (US$, Mn), 2020-2032
Figure 50. Israel High-Power DFB Chips Revenue, (US$, Mn), 2020-2032
Figure 51. Saudi Arabia High-Power DFB Chips Revenue, (US$, Mn), 2020-2032
Figure 52. UAE High-Power DFB Chips Revenue, (US$, Mn), 2020-2032
Figure 53. Global High-Power DFB Chips Production Capacity (K Units), 2020-2032
Figure 54. The Percentage of Production High-Power DFB Chips by Region, 2024 VS 2032
Figure 55. High-Power DFB Chips Industry Value Chain
Figure 56. Marketing Channels