High Performance Operational Amplifiers Market, Trends, Business Strategies 2025-2032

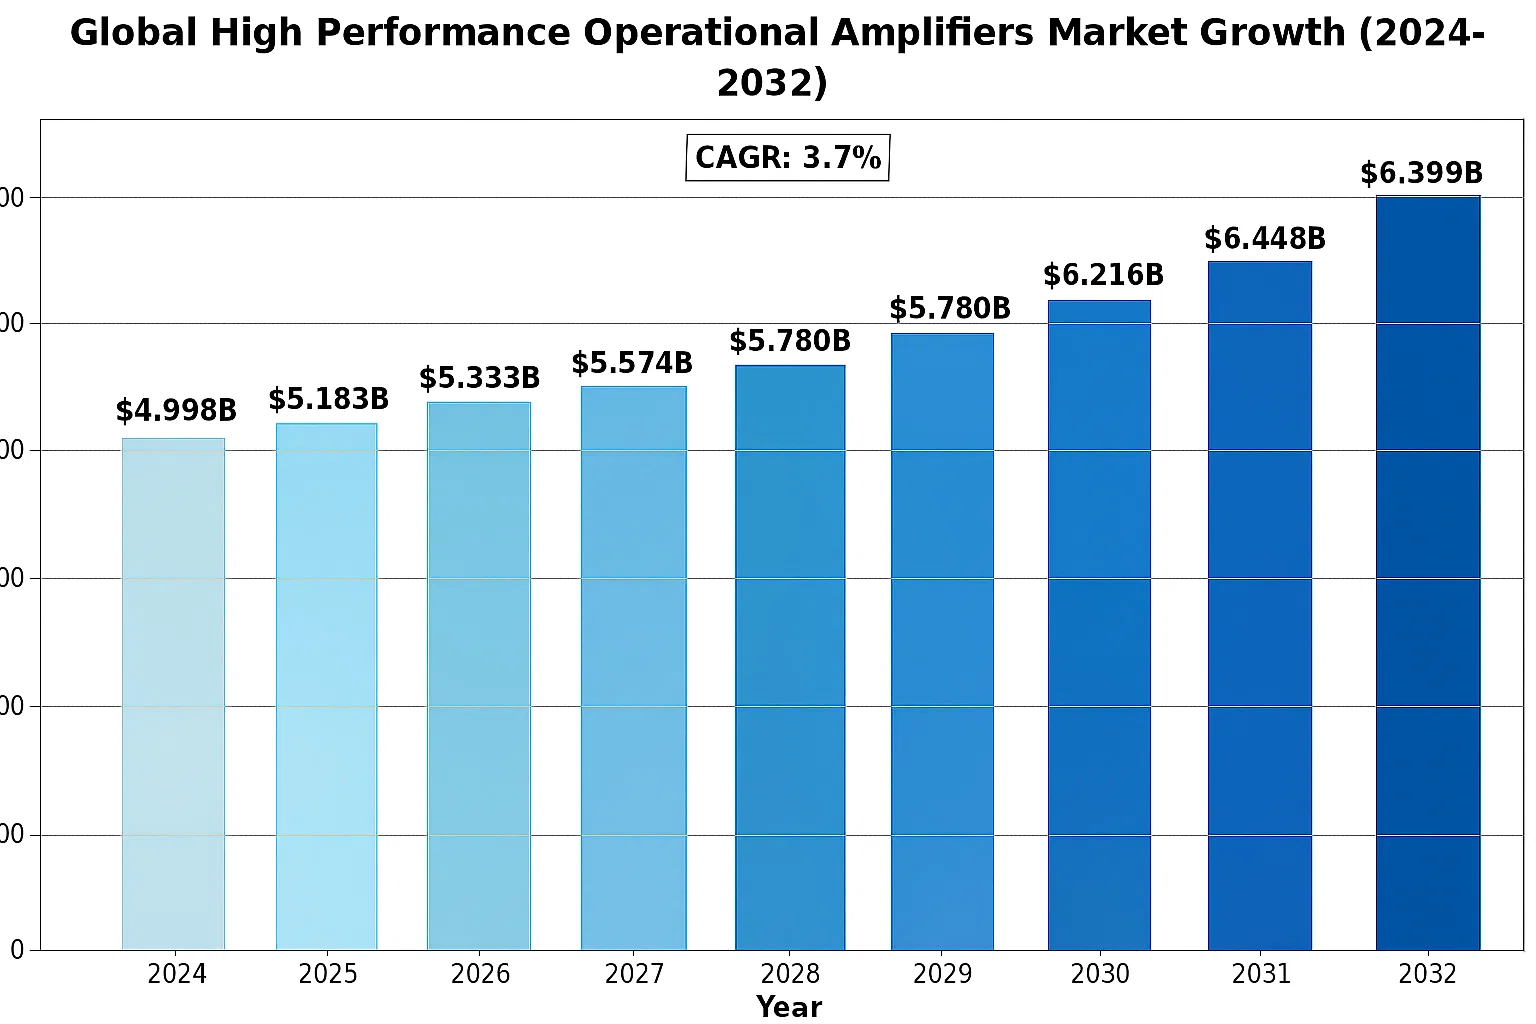
High Performance Operational Amplifiers market was valued at 4998 million in 2024 and is projected to reach US$ 6399 million by 2032, at a CAGR of 3.7% during the forecast period.
PDF Icon Download Sample Report PDF
  • Quick Dispatch

    All Orders

  • Secure Payment

    100% Secure Payment

Price range: $1,500.00 through $4,250.00

Clear

MARKET INSIGHTS

The global High Performance Operational Amplifiers market was valued at 4998 million in 2024 and is projected to reach US$ 6399 million by 2032, at a CAGR of 3.7% during the forecast period.

Global High Performance Operational Amplifiers Market

High performance operational amplifiers (op-amps) are specialized integrated circuits designed for precision signal conditioning. These components feature low noise, low input offset voltage, and high speed, making them ideal for battery-powered devices and sensor applications. The product category includes both open-loop and closed-loop amplifier configurations, serving diverse applications from medical instruments to vehicle electronics.

The market growth is driven by increasing demand for precision analog components in IoT devices and industrial automation systems. While the broader semiconductor market grew at 4.4% in 2022, the analog segment showed stronger performance with 20.8% year-over-year growth. However, regional variations exist – Asia Pacific saw a 2% decline in semiconductor sales in 2022, while Americas and Europe grew by 17% and 12.6% respectively. Key players like Texas Instruments and Analog Devices continue to innovate, developing op-amps with lower power consumption and higher accuracy for next-generation applications.

MARKET DYNAMICS

MARKET DRIVERS

Proliferation of IoT and Industrial Automation to Accelerate Market Growth

The rapid expansion of IoT devices and industrial automation systems is catalyzing demand for high performance operational amplifiers (op-amps). Modern IoT applications require precision signal conditioning for sensors in environments ranging from smart homes to industrial monitoring systems. Global IoT connections are projected to exceed 25 billion active endpoints by 2025, creating substantial demand for analog components that can maintain signal integrity in noisy environments. High performance op-amps with low noise characteristics (typically below 10nV/√Hz) and high common-mode rejection ratios (often exceeding 90dB) are becoming indispensable in these applications.

Industrial automation is seeing particular growth in sectors like robotics and process control, where error rates below 0.1% are frequently required for precision measurements. The manufacturing sector’s increasing adoption of Industry 4.0 technologies has driven analog IC demand up by approximately 18% year-over-year in automation applications, with operational amplifiers representing a significant portion of these components. New product launches from major manufacturers specifically targeting industrial IoT applications underscore this trend. For instance, several industry leaders introduced rail-to-rail output op-amps in 2023 with power consumption under 1mA, specifically optimized for battery-powered industrial sensors.

Advancements in Automotive Electronics to Fuel Market Expansion

The automotive electronics revolution is creating unprecedented demand for high performance analog components. Modern vehicles contain over 3,000 analog chips on average, with electric vehicles (EVs) utilizing 40-50% more semiconductor content than traditional internal combustion vehicles. The global automotive semiconductor market is projected to grow at nearly 7% annually through 2030, with analog ICs capturing the largest segment share. High performance op-amps are particularly crucial in EV battery management systems, where monitoring accuracy within 0.1mV is often required for cell balancing circuits.

Advanced driver assistance systems (ADAS) represent another key growth area, employing precision op-amps for sensor signal conditioning in radar, LiDAR and camera systems. The typical premium vehicle now incorporates over 20 ultrasonic sensors, 6-8 cameras, and at least one forward-facing radar – all requiring sophisticated analog signal chains. Recent design wins in this sector highlight the trend toward high-speed amplifiers (>50MHz bandwidth) with ultra-low offset voltage (<50μV) to maintain signal fidelity in safety-critical applications.

The move toward autonomous driving is pushing op-amp performance boundaries, with 2023 seeing multiple vendors introduce automotive-grade amplifiers featuring EMI hardening and fault detection capabilities.

Furthermore, the electrification of power steering and braking systems is creating demand for robust high-current op-amps capable of driving loads up to 500mA while maintaining thermal stability. This convergence of automotive innovation and analog semiconductor technology is expected to sustain market growth throughout the decade.

MARKET CHALLENGES

Design Complexity and Precision Requirements to Test Manufacturer Capabilities

While the market shows strong growth potential, achieving the required performance specifications presents significant technical hurdles. Modern applications demand operational amplifiers with increasingly stringent parameters – noise levels below 5nV/√Hz at 1kHz, offset voltages under 10μV, and temperature drift below 0.5μV/°C are becoming common requirements. Achieving these specifications while maintaining competitive power consumption and cost structures poses formidable design challenges. Yield rates for the most precise amplifiers can drop below 60% in production, significantly impacting gross margins.

Other Challenges

Thermal Management Constraints
High-performance applications often push op-amps to their thermal limits, especially in automotive and industrial environments. Maintaining specifications across military temperature ranges (-55°C to +125°C) requires careful die design and packaging innovation. Some manufacturers report reliability testing cycles extending beyond 18 months for new high-temperature amplifier families.

Supply Chain Vulnerabilities
The global semiconductor shortage highlighted vulnerabilities in analog component supply chains. While digital IC production has largely rebounded, the specialized test equipment and wafer processing required for precision analog products continues to face capacity constraints. Lead times for certain high-performance amplifier series remain extended beyond 40 weeks as of early 2024.

MARKET RESTRAINTS

Pricing Pressure from Commodity Alternatives to Limit Market Expansion

The high performance op-amp market faces growing competition from general-purpose amplifiers that have improved their specifications to near-performance levels. In cost-sensitive applications, designers are often willing to accept slightly higher noise or offset in exchange for 40-60% cost reductions. This trend is particularly evident in consumer electronics, where some manufacturers have successfully substituted $0.50 general-purpose amplifiers for $2.00+ precision counterparts in non-critical signal paths.

Additionally, the rise of integrated analog front-ends (AFEs) is cannibalizing discrete op-amp sockets in applications like sensor interfaces. Modern AFEs combine amplifiers, ADCs, and digital processing in single packages, often achieving better system-level performance while reducing board space and component count. The medical instrumentation sector, traditionally a stronghold for discrete precision amplifiers, has seen AFE penetration reach over 35% in new designs.

Manufacturers are responding by focusing on applications where performance absolutely cannot be compromised – scientific instrumentation, aerospace systems, and ultra-high-end audio equipment continue to demand the most exacting amplifier specifications regardless of cost.

MARKET OPPORTUNITIES

Emerging Applications in Medical Technology to Drive Next Growth Phase

The healthcare sector presents significant untapped potential for high performance operational amplifiers. Medical imaging equipment such as MRI machines and CT scanners require ultra-low noise amplification of microvolt-level signals from detector arrays. Newer modalities like digital pathology and genomic sequencing instruments are pushing bandwidth requirements beyond 100MHz while maintaining sub-microvolt noise floors. The global medical electronics market is projected to exceed $8 billion by 2027, creating substantial opportunities for amplifier manufacturers.

Wearable health monitors represent another promising growth avenue. While consumer wearables often use integrated solutions, medical-grade continuous glucose monitors and ECG patches require discrete precision amplifiers to meet FDA accuracy requirements. The shift toward disposable medical sensors is driving innovation in ultra-low-power amplifier designs that maintain critical specifications on coin cell batteries for 14+ days. Several vendors have recently introduced amplifiers with quiescent currents below 10μA specifically targeting these applications.

Furthermore, the development of neural interface technologies is creating demand for amplifiers with unprecedented capabilities. Brain-machine interfaces require amplification of neural signals in the 0.1μV to 500μV range with bandwidth from 1Hz to 7kHz, all while maintaining power budgets under 1mW per channel. These emerging applications could redefine performance benchmarks for operational amplifiers in coming years.

HIGH PERFORMANCE OPERATIONAL AMPLIFIERS MARKET TRENDS

Expansion of IoT and Automotive Electronics Accelerating Market Growth

The demand for high performance operational amplifiers (op-amps) is being driven by the rapid expansion of Internet of Things (IoT) devices and automotive electronics. These amplifiers play a critical role in signal conditioning, filtering, and precision measurements in IoT sensors, which are expected to exceed 30 billion connected devices globally by 2025. In the automotive sector, the shift toward electric vehicles and advanced driver-assistance systems (ADAS) is contributing to increased adoption. Modern vehicles require ultra-low-noise, high-speed op-amps to process sensor data from LiDAR, radar, and camera systems with minimal signal distortion.

Other Trends

Miniaturization and Power Efficiency Requirements

The drive toward miniaturized electronics in wearables, medical implants, and portable devices is pushing manufacturers to develop op-amps with reduced footprint and power consumption. The global market for wearable devices alone is projected to surpass $118 billion by 2028, necessitating amplifiers that consume minimal power while maintaining high fidelity. Innovations in semiconductor packaging, such as wafer-level chip-scale packaging (WLCSP), enable smaller form factors without compromising precision, making them ideal for space-constrained applications.

Industrial Automation and 5G Infrastructure Driving Demand

Operational amplifiers are experiencing heightened demand from industrial automation and 5G infrastructure deployments. The industrial sector requires amplifiers with low offset voltage and high common-mode rejection to ensure accuracy in process control systems. Meanwhile, 5G base stations and network equipment rely on high-performance op-amps for signal integrity in RF front-end modules. The 5G infrastructure market is projected to grow at a CAGR of nearly 50% by 2030, further fueling adoption. Additionally, industry leaders are investing in radiation-hardened amplifiers for aerospace and defense applications, ensuring reliability in extreme environments.

COMPETITIVE LANDSCAPE

Key Industry Players

Semiconductor Giants Compete Through Innovation in Precision Analog Solutions

The global high performance operational amplifiers market features a moderately concentrated competitive environment, dominated by established semiconductor leaders alongside specialized analog IC manufacturers. Texas Instruments leads the market with approximately 28% revenue share in 2024, leveraging its comprehensive portfolio of precision op-amps and strong distribution networks across automotive, industrial, and consumer electronics sectors. Their OPA series amplifiers remain the industry benchmark for low-noise, high-speed applications.

Analog Devices follows closely with 22% market share, distinguished by its innovative current-feedback amplifiers and instrumentation-grade solutions. The company’s recent acquisition of Linear Technology has significantly strengthened its position in high-end analog components, particularly for aerospace and medical applications where precision is critical.

Meanwhile, STMicroelectronics and NXP Semiconductors are accelerating growth through strategic focus on automotive electrification and IoT edge devices. ST’s Rail-to-Rail series has gained particular traction in battery-powered systems, while NXP’s precision op-amps are increasingly designed into advanced driver assistance systems (ADAS).

The market also sees vigorous competition from Japanese suppliers like ROHM Semiconductor and New Japan Radio, who dominate specialized segments including audio processing and industrial sensors. Their success stems from decades of expertise in analog circuit design and strong relationships with regional OEMs.

List of Key High Performance Op-Amp Manufacturers

Segment Analysis:

By Type

Closed-Loop Amplifier Segment Dominates Due to Superior Stability and Precision in Critical Applications

The market is segmented based on type into:

  • Open-Loop Amplifier
    • Subtypes: General-purpose, High-speed, and others
  • Closed-Loop Amplifier
    • Subtypes: Voltage feedback, Current feedback, and others

By Application

Test and Measurement Instruments Lead Due to Increasing Demand for High-Precision Electronic Equipment

The market is segmented based on application into:

  • Automatic Control System
  • Test and Measurement Instruments
  • Medical Instruments
  • Vehicle Electronics
  • Others

By End User

Industrial Sector Accounts for Largest Share Due to Automation and Process Control Applications

The market is segmented based on end user into:

  • Industrial
  • Healthcare
  • Automotive
  • Consumer Electronics
  • Telecommunications

Regional Analysis: High Performance Operational Amplifiers Market

North America
The North American high-performance operational amplifiers (op-amps) market benefits from strong demand in aerospace, defense, and medical instrumentation sectors, where precision analog signal processing is critical. Texas Instruments and Analog Devices dominate the regional supply chain, leveraging their advanced semiconductor manufacturing capabilities. Stringent industrial standards for noise reduction and power efficiency in applications like electric vehicles (EVs) and renewable energy systems further drive innovation. The U.S. CHIPS and Science Act, which allocates $52 billion for domestic semiconductor production, is expected to bolster local supply resilience. However, high production costs and reliance on niche applications limit volume growth compared to Asia-Pacific markets.

Europe
Europe’s market is characterized by stringent EMI/EMC compliance requirements under EU directives, particularly for automotive and industrial automation applications. Germany and France lead in adopting precision op-amps for Industry 4.0 solutions, where sensor signal conditioning is pivotal. STMicroelectronics and NXP Semiconductors are key innovators, focusing on ultra-low-power designs for IoT edge devices. The region’s emphasis on renewable energy infrastructure also creates demand for high-voltage op-amps in solar/wind power conditioning systems. However, slower adoption in consumer electronics due to cost sensitivity and competition from Asian manufacturers presents a growth challenge.

Asia-Pacific
Accounting for over 40% of global consumption, the Asia-Pacific region thrives due to massive electronics manufacturing hubs in China, Japan, and South Korea. Local players like ROHM and New Japan Radio compete with Western firms by offering cost-optimized op-amps for consumer durables and industrial control systems. China’s semiconductor self-sufficiency push has accelerated domestic production, though reliance on imported specialty materials persists. India’s growing EV and telecom sectors present new opportunities, but price competition and intellectual property concerns remain barriers. The region’s lead in 5G infrastructure deployment further fuels demand for high-speed op-amps in RF signal chains.

South America
This emerging market shows gradual growth, primarily in Brazil and Argentina, where automotive and energy applications drive demand. Local assembly of industrial equipment and medical devices creates steady but limited need for precision op-amps. Economic instability and currency fluctuations hinder large-scale investments in semiconductor infrastructure, making the region dependent on imports. Recent trade agreements with Asian suppliers are improving component availability, though technological lag compared to North America and Europe persists. The lack of local design expertise further restricts high-end adoption.

Middle East & Africa
The market here is nascent but shows potential in oil/gas instrumentation and telecom infrastructure projects. UAE and Saudi Arabia lead in adopting op-amps for industrial automation in energy sectors, while South Africa sees growth in medical equipment modernization. Limited local semiconductor activity results in complete reliance on imported components, often through European or Asian distributors. While geopolitical stability and diversification from oil-based economies could spur future demand, current low-volume purchasing and technical support gaps slow market maturation.

Report Scope

This market research report provides a comprehensive analysis of the global and regional High Performance Operational Amplifiers markets, covering the forecast period 2024–2032. It offers detailed insights into market dynamics, technological advancements, competitive landscape, and key trends shaping the industry.

Key focus areas of the report include:

  • Market Size & Forecast: Historical data and future projections for revenue, unit shipments, and market value across major regions and segments. The global High Performance Operational Amplifiers market was valued at USD 4,998 million in 2024 and is projected to reach USD 6,399 million by 2032.
  • Segmentation Analysis: Detailed breakdown by product type (Open-Loop Amplifier, Closed-Loop Amplifier), application (Automatic Control Systems, Test and Measurement Instruments, Medical Instruments, Vehicle Electronics), and end-user industry to identify high-growth segments.
  • Regional Outlook: Insights into market performance across North America, Europe, Asia-Pacific, Latin America, and Middle East & Africa, including country-level analysis. Asia-Pacific currently leads in market share.
  • Competitive Landscape: Profiles of leading market participants including Texas Instruments, Analog Devices, STMicroelectronics, and NXP Semiconductors, covering their product portfolios, market strategies, and recent developments.
  • Technology Trends & Innovation: Assessment of emerging semiconductor design trends, fabrication techniques, and the impact of IoT integration on operational amplifier requirements.
  • Market Drivers & Restraints: Evaluation of factors such as growing demand for precision electronics, automotive applications, and challenges in semiconductor supply chains.
  • Stakeholder Analysis: Strategic insights for component manufacturers, OEMs, system integrators, and investors regarding market opportunities.

The analysis employs both primary and secondary research methods, including interviews with industry experts and data from verified market sources to ensure accuracy and reliability.

FREQUENTLY ASKED QUESTIONS:

What is the current market size of Global High Performance Operational Amplifiers Market?

-> The global market was valued at USD 4,998 million in 2024 and is projected to reach USD 6,399 million by 2032 at a CAGR of 3.7%.

Which key companies operate in this market?

-> Major players include Texas Instruments, Analog Devices, STMicroelectronics, NXP Semiconductors, ON Semiconductor, and Renesas Electronics.

What are the key growth drivers?

-> Growth is driven by increasing demand for precision electronics, automotive applications, and IoT device proliferation. The global semiconductor market is projected to grow from USD 579 billion (2022) to USD 790 billion by 2029.

Which region dominates the market?

-> Asia-Pacific leads the market, accounting for the largest share, followed by North America and Europe.

What are the emerging trends?

-> Key trends include development of ultra-low power consumption amplifiers, integration with IoT systems, and increasing automotive applications.

High Performance Operational Amplifiers Market, Trends, Business Strategies 2025-2032

Get Sample Report PDF for Exclusive Insights

Report Sample Includes

  • Table of Contents
  • List of Tables & Figures
  • Charts, Research Methodology, and more...

PDF Icon Download Sample Report PDF

Download Sample Report

Table of Content

1 Introduction to Research & Analysis Reports
1.1 High Performance Operational Amplifiers Market Definition
1.2 Market Segments
1.2.1 Segment by Type
1.2.2 Segment by Application
1.3 Global High Performance Operational Amplifiers Market Overview
1.4 Features & Benefits of This Report
1.5 Methodology & Sources of Information
1.5.1 Research Methodology
1.5.2 Research Process
1.5.3 Base Year
1.5.4 Report Assumptions & Caveats
2 Global High Performance Operational Amplifiers Overall Market Size
2.1 Global High Performance Operational Amplifiers Market Size: 2024 VS 2032
2.2 Global High Performance Operational Amplifiers Market Size, Prospects & Forecasts: 2020-2032
2.3 Global High Performance Operational Amplifiers Sales: 2020-2032
3 Company Landscape
3.1 Top High Performance Operational Amplifiers Players in Global Market
3.2 Top Global High Performance Operational Amplifiers Companies Ranked by Revenue
3.3 Global High Performance Operational Amplifiers Revenue by Companies
3.4 Global High Performance Operational Amplifiers Sales by Companies
3.5 Global High Performance Operational Amplifiers Price by Manufacturer (2020-2025)
3.6 Top 3 and Top 5 High Performance Operational Amplifiers Companies in Global Market, by Revenue in 2024
3.7 Global Manufacturers High Performance Operational Amplifiers Product Type
3.8 Tier 1, Tier 2, and Tier 3 High Performance Operational Amplifiers Players in Global Market
3.8.1 List of Global Tier 1 High Performance Operational Amplifiers Companies
3.8.2 List of Global Tier 2 and Tier 3 High Performance Operational Amplifiers Companies
4 Sights by Product
4.1 Overview
4.1.1 Segment by Type – Global High Performance Operational Amplifiers Market Size Markets, 2024 & 2032
4.1.2 Open-Loop Amplifier
4.1.3 Closed-Loop Amplifier
4.2 Segment by Type – Global High Performance Operational Amplifiers Revenue & Forecasts
4.2.1 Segment by Type – Global High Performance Operational Amplifiers Revenue, 2020-2025
4.2.2 Segment by Type – Global High Performance Operational Amplifiers Revenue, 2026-2032
4.2.3 Segment by Type – Global High Performance Operational Amplifiers Revenue Market Share, 2020-2032
4.3 Segment by Type – Global High Performance Operational Amplifiers Sales & Forecasts
4.3.1 Segment by Type – Global High Performance Operational Amplifiers Sales, 2020-2025
4.3.2 Segment by Type – Global High Performance Operational Amplifiers Sales, 2026-2032
4.3.3 Segment by Type – Global High Performance Operational Amplifiers Sales Market Share, 2020-2032
4.4 Segment by Type – Global High Performance Operational Amplifiers Price (Manufacturers Selling Prices), 2020-2032
5 Sights by Application
5.1 Overview
5.1.1 Segment by Application – Global High Performance Operational Amplifiers Market Size, 2024 & 2032
5.1.2 Automatic Control System
5.1.3 Test and Measurement Instruments
5.1.4 Medical Instruments
5.1.5 Vehicle Electronics
5.1.6 Others
5.2 Segment by Application – Global High Performance Operational Amplifiers Revenue & Forecasts
5.2.1 Segment by Application – Global High Performance Operational Amplifiers Revenue, 2020-2025
5.2.2 Segment by Application – Global High Performance Operational Amplifiers Revenue, 2026-2032
5.2.3 Segment by Application – Global High Performance Operational Amplifiers Revenue Market Share, 2020-2032
5.3 Segment by Application – Global High Performance Operational Amplifiers Sales & Forecasts
5.3.1 Segment by Application – Global High Performance Operational Amplifiers Sales, 2020-2025
5.3.2 Segment by Application – Global High Performance Operational Amplifiers Sales, 2026-2032
5.3.3 Segment by Application – Global High Performance Operational Amplifiers Sales Market Share, 2020-2032
5.4 Segment by Application – Global High Performance Operational Amplifiers Price (Manufacturers Selling Prices), 2020-2032
6 Sights by Region
6.1 By Region – Global High Performance Operational Amplifiers Market Size, 2024 & 2032
6.2 By Region – Global High Performance Operational Amplifiers Revenue & Forecasts
6.2.1 By Region – Global High Performance Operational Amplifiers Revenue, 2020-2025
6.2.2 By Region – Global High Performance Operational Amplifiers Revenue, 2026-2032
6.2.3 By Region – Global High Performance Operational Amplifiers Revenue Market Share, 2020-2032
6.3 By Region – Global High Performance Operational Amplifiers Sales & Forecasts
6.3.1 By Region – Global High Performance Operational Amplifiers Sales, 2020-2025
6.3.2 By Region – Global High Performance Operational Amplifiers Sales, 2026-2032
6.3.3 By Region – Global High Performance Operational Amplifiers Sales Market Share, 2020-2032
6.4 North America
6.4.1 By Country – North America High Performance Operational Amplifiers Revenue, 2020-2032
6.4.2 By Country – North America High Performance Operational Amplifiers Sales, 2020-2032
6.4.3 United States High Performance Operational Amplifiers Market Size, 2020-2032
6.4.4 Canada High Performance Operational Amplifiers Market Size, 2020-2032
6.4.5 Mexico High Performance Operational Amplifiers Market Size, 2020-2032
6.5 Europe
6.5.1 By Country – Europe High Performance Operational Amplifiers Revenue, 2020-2032
6.5.2 By Country – Europe High Performance Operational Amplifiers Sales, 2020-2032
6.5.3 Germany High Performance Operational Amplifiers Market Size, 2020-2032
6.5.4 France High Performance Operational Amplifiers Market Size, 2020-2032
6.5.5 U.K. High Performance Operational Amplifiers Market Size, 2020-2032
6.5.6 Italy High Performance Operational Amplifiers Market Size, 2020-2032
6.5.7 Russia High Performance Operational Amplifiers Market Size, 2020-2032
6.5.8 Nordic Countries High Performance Operational Amplifiers Market Size, 2020-2032
6.5.9 Benelux High Performance Operational Amplifiers Market Size, 2020-2032
6.6 Asia
6.6.1 By Region – Asia High Performance Operational Amplifiers Revenue, 2020-2032
6.6.2 By Region – Asia High Performance Operational Amplifiers Sales, 2020-2032
6.6.3 China High Performance Operational Amplifiers Market Size, 2020-2032
6.6.4 Japan High Performance Operational Amplifiers Market Size, 2020-2032
6.6.5 South Korea High Performance Operational Amplifiers Market Size, 2020-2032
6.6.6 Southeast Asia High Performance Operational Amplifiers Market Size, 2020-2032
6.6.7 India High Performance Operational Amplifiers Market Size, 2020-2032
6.7 South America
6.7.1 By Country – South America High Performance Operational Amplifiers Revenue, 2020-2032
6.7.2 By Country – South America High Performance Operational Amplifiers Sales, 2020-2032
6.7.3 Brazil High Performance Operational Amplifiers Market Size, 2020-2032
6.7.4 Argentina High Performance Operational Amplifiers Market Size, 2020-2032
6.8 Middle East & Africa
6.8.1 By Country – Middle East & Africa High Performance Operational Amplifiers Revenue, 2020-2032
6.8.2 By Country – Middle East & Africa High Performance Operational Amplifiers Sales, 2020-2032
6.8.3 Turkey High Performance Operational Amplifiers Market Size, 2020-2032
6.8.4 Israel High Performance Operational Amplifiers Market Size, 2020-2032
6.8.5 Saudi Arabia High Performance Operational Amplifiers Market Size, 2020-2032
6.8.6 UAE High Performance Operational Amplifiers Market Size, 2020-2032
7 Manufacturers & Brands Profiles
7.1 Texas Instruments
7.1.1 Texas Instruments Company Summary
7.1.2 Texas Instruments Business Overview
7.1.3 Texas Instruments High Performance Operational Amplifiers Major Product Offerings
7.1.4 Texas Instruments High Performance Operational Amplifiers Sales and Revenue in Global (2020-2025)
7.1.5 Texas Instruments Key News & Latest Developments
7.2 Analog Devices
7.2.1 Analog Devices Company Summary
7.2.2 Analog Devices Business Overview
7.2.3 Analog Devices High Performance Operational Amplifiers Major Product Offerings
7.2.4 Analog Devices High Performance Operational Amplifiers Sales and Revenue in Global (2020-2025)
7.2.5 Analog Devices Key News & Latest Developments
7.3 ROHM
7.3.1 ROHM Company Summary
7.3.2 ROHM Business Overview
7.3.3 ROHM High Performance Operational Amplifiers Major Product Offerings
7.3.4 ROHM High Performance Operational Amplifiers Sales and Revenue in Global (2020-2025)
7.3.5 ROHM Key News & Latest Developments
7.4 Maxim
7.4.1 Maxim Company Summary
7.4.2 Maxim Business Overview
7.4.3 Maxim High Performance Operational Amplifiers Major Product Offerings
7.4.4 Maxim High Performance Operational Amplifiers Sales and Revenue in Global (2020-2025)
7.4.5 Maxim Key News & Latest Developments
7.5 STMicroelectronics
7.5.1 STMicroelectronics Company Summary
7.5.2 STMicroelectronics Business Overview
7.5.3 STMicroelectronics High Performance Operational Amplifiers Major Product Offerings
7.5.4 STMicroelectronics High Performance Operational Amplifiers Sales and Revenue in Global (2020-2025)
7.5.5 STMicroelectronics Key News & Latest Developments
7.6 NXP Semiconductors
7.6.1 NXP Semiconductors Company Summary
7.6.2 NXP Semiconductors Business Overview
7.6.3 NXP Semiconductors High Performance Operational Amplifiers Major Product Offerings
7.6.4 NXP Semiconductors High Performance Operational Amplifiers Sales and Revenue in Global (2020-2025)
7.6.5 NXP Semiconductors Key News & Latest Developments
7.7 Cirrus Logic
7.7.1 Cirrus Logic Company Summary
7.7.2 Cirrus Logic Business Overview
7.7.3 Cirrus Logic High Performance Operational Amplifiers Major Product Offerings
7.7.4 Cirrus Logic High Performance Operational Amplifiers Sales and Revenue in Global (2020-2025)
7.7.5 Cirrus Logic Key News & Latest Developments
7.8 KEC
7.8.1 KEC Company Summary
7.8.2 KEC Business Overview
7.8.3 KEC High Performance Operational Amplifiers Major Product Offerings
7.8.4 KEC High Performance Operational Amplifiers Sales and Revenue in Global (2020-2025)
7.8.5 KEC Key News & Latest Developments
7.9 New Japan Radio
7.9.1 New Japan Radio Company Summary
7.9.2 New Japan Radio Business Overview
7.9.3 New Japan Radio High Performance Operational Amplifiers Major Product Offerings
7.9.4 New Japan Radio High Performance Operational Amplifiers Sales and Revenue in Global (2020-2025)
7.9.5 New Japan Radio Key News & Latest Developments
7.10 ON Semiconductor
7.10.1 ON Semiconductor Company Summary
7.10.2 ON Semiconductor Business Overview
7.10.3 ON Semiconductor High Performance Operational Amplifiers Major Product Offerings
7.10.4 ON Semiconductor High Performance Operational Amplifiers Sales and Revenue in Global (2020-2025)
7.10.5 ON Semiconductor Key News & Latest Developments
7.11 Renesas Electronics
7.11.1 Renesas Electronics Company Summary
7.11.2 Renesas Electronics Business Overview
7.11.3 Renesas Electronics High Performance Operational Amplifiers Major Product Offerings
7.11.4 Renesas Electronics High Performance Operational Amplifiers Sales and Revenue in Global (2020-2025)
7.11.5 Renesas Electronics Key News & Latest Developments
7.12 API Technologies
7.12.1 API Technologies Company Summary
7.12.2 API Technologies Business Overview
7.12.3 API Technologies High Performance Operational Amplifiers Major Product Offerings
7.12.4 API Technologies High Performance Operational Amplifiers Sales and Revenue in Global (2020-2025)
7.12.5 API Technologies Key News & Latest Developments
7.13 Microchip Technology
7.13.1 Microchip Technology Company Summary
7.13.2 Microchip Technology Business Overview
7.13.3 Microchip Technology High Performance Operational Amplifiers Major Product Offerings
7.13.4 Microchip Technology High Performance Operational Amplifiers Sales and Revenue in Global (2020-2025)
7.13.5 Microchip Technology Key News & Latest Developments
8 Global High Performance Operational Amplifiers Production Capacity, Analysis
8.1 Global High Performance Operational Amplifiers Production Capacity, 2020-2032
8.2 High Performance Operational Amplifiers Production Capacity of Key Manufacturers in Global Market
8.3 Global High Performance Operational Amplifiers Production by Region
9 Key Market Trends, Opportunity, Drivers and Restraints
9.1 Market Opportunities & Trends
9.2 Market Drivers
9.3 Market Restraints
10 High Performance Operational Amplifiers Supply Chain Analysis
10.1 High Performance Operational Amplifiers Industry Value Chain
10.2 High Performance Operational Amplifiers Upstream Market
10.3 High Performance Operational Amplifiers Downstream and Clients
10.4 Marketing Channels Analysis
10.4.1 Marketing Channels
10.4.2 High Performance Operational Amplifiers Distributors and Sales Agents in Global
11 Conclusion
12 Appendix
12.1 Note
12.2 Examples of Clients
12.3 DisclaimerList of Tables
Table 1. Key Players of High Performance Operational Amplifiers in Global Market
Table 2. Top High Performance Operational Amplifiers Players in Global Market, Ranking by Revenue (2024)
Table 3. Global High Performance Operational Amplifiers Revenue by Companies, (US$, Mn), 2020-2025
Table 4. Global High Performance Operational Amplifiers Revenue Share by Companies, 2020-2025
Table 5. Global High Performance Operational Amplifiers Sales by Companies, (K Units), 2020-2025
Table 6. Global High Performance Operational Amplifiers Sales Share by Companies, 2020-2025
Table 7. Key Manufacturers High Performance Operational Amplifiers Price (2020-2025) & (US$/Unit)
Table 8. Global Manufacturers High Performance Operational Amplifiers Product Type
Table 9. List of Global Tier 1 High Performance Operational Amplifiers Companies, Revenue (US$, Mn) in 2024 and Market Share
Table 10. List of Global Tier 2 and Tier 3 High Performance Operational Amplifiers Companies, Revenue (US$, Mn) in 2024 and Market Share
Table 11. Segment by Type – Global High Performance Operational Amplifiers Revenue, (US$, Mn), 2024 & 2032
Table 12. Segment by Type – Global High Performance Operational Amplifiers Revenue (US$, Mn), 2020-2025
Table 13. Segment by Type – Global High Performance Operational Amplifiers Revenue (US$, Mn), 2026-2032
Table 14. Segment by Type – Global High Performance Operational Amplifiers Sales (K Units), 2020-2025
Table 15. Segment by Type – Global High Performance Operational Amplifiers Sales (K Units), 2026-2032
Table 16. Segment by Application – Global High Performance Operational Amplifiers Revenue, (US$, Mn), 2024 & 2032
Table 17. Segment by Application – Global High Performance Operational Amplifiers Revenue, (US$, Mn), 2020-2025
Table 18. Segment by Application – Global High Performance Operational Amplifiers Revenue, (US$, Mn), 2026-2032
Table 19. Segment by Application – Global High Performance Operational Amplifiers Sales, (K Units), 2020-2025
Table 20. Segment by Application – Global High Performance Operational Amplifiers Sales, (K Units), 2026-2032
Table 21. By Region – Global High Performance Operational Amplifiers Revenue, (US$, Mn), 2025-2032
Table 22. By Region – Global High Performance Operational Amplifiers Revenue, (US$, Mn), 2020-2025
Table 23. By Region – Global High Performance Operational Amplifiers Revenue, (US$, Mn), 2026-2032
Table 24. By Region – Global High Performance Operational Amplifiers Sales, (K Units), 2020-2025
Table 25. By Region – Global High Performance Operational Amplifiers Sales, (K Units), 2026-2032
Table 26. By Country – North America High Performance Operational Amplifiers Revenue, (US$, Mn), 2020-2025
Table 27. By Country – North America High Performance Operational Amplifiers Revenue, (US$, Mn), 2026-2032
Table 28. By Country – North America High Performance Operational Amplifiers Sales, (K Units), 2020-2025
Table 29. By Country – North America High Performance Operational Amplifiers Sales, (K Units), 2026-2032
Table 30. By Country – Europe High Performance Operational Amplifiers Revenue, (US$, Mn), 2020-2025
Table 31. By Country – Europe High Performance Operational Amplifiers Revenue, (US$, Mn), 2026-2032
Table 32. By Country – Europe High Performance Operational Amplifiers Sales, (K Units), 2020-2025
Table 33. By Country – Europe High Performance Operational Amplifiers Sales, (K Units), 2026-2032
Table 34. By Region – Asia High Performance Operational Amplifiers Revenue, (US$, Mn), 2020-2025
Table 35. By Region – Asia High Performance Operational Amplifiers Revenue, (US$, Mn), 2026-2032
Table 36. By Region – Asia High Performance Operational Amplifiers Sales, (K Units), 2020-2025
Table 37. By Region – Asia High Performance Operational Amplifiers Sales, (K Units), 2026-2032
Table 38. By Country – South America High Performance Operational Amplifiers Revenue, (US$, Mn), 2020-2025
Table 39. By Country – South America High Performance Operational Amplifiers Revenue, (US$, Mn), 2026-2032
Table 40. By Country – South America High Performance Operational Amplifiers Sales, (K Units), 2020-2025
Table 41. By Country – South America High Performance Operational Amplifiers Sales, (K Units), 2026-2032
Table 42. By Country – Middle East & Africa High Performance Operational Amplifiers Revenue, (US$, Mn), 2020-2025
Table 43. By Country – Middle East & Africa High Performance Operational Amplifiers Revenue, (US$, Mn), 2026-2032
Table 44. By Country – Middle East & Africa High Performance Operational Amplifiers Sales, (K Units), 2020-2025
Table 45. By Country – Middle East & Africa High Performance Operational Amplifiers Sales, (K Units), 2026-2032
Table 46. Texas Instruments Company Summary
Table 47. Texas Instruments High Performance Operational Amplifiers Product Offerings
Table 48. Texas Instruments High Performance Operational Amplifiers Sales (K Units), Revenue (US$, Mn) and Average Price (US$/Unit) & (2020-2025)
Table 49. Texas Instruments Key News & Latest Developments
Table 50. Analog Devices Company Summary
Table 51. Analog Devices High Performance Operational Amplifiers Product Offerings
Table 52. Analog Devices High Performance Operational Amplifiers Sales (K Units), Revenue (US$, Mn) and Average Price (US$/Unit) & (2020-2025)
Table 53. Analog Devices Key News & Latest Developments
Table 54. ROHM Company Summary
Table 55. ROHM High Performance Operational Amplifiers Product Offerings
Table 56. ROHM High Performance Operational Amplifiers Sales (K Units), Revenue (US$, Mn) and Average Price (US$/Unit) & (2020-2025)
Table 57. ROHM Key News & Latest Developments
Table 58. Maxim Company Summary
Table 59. Maxim High Performance Operational Amplifiers Product Offerings
Table 60. Maxim High Performance Operational Amplifiers Sales (K Units), Revenue (US$, Mn) and Average Price (US$/Unit) & (2020-2025)
Table 61. Maxim Key News & Latest Developments
Table 62. STMicroelectronics Company Summary
Table 63. STMicroelectronics High Performance Operational Amplifiers Product Offerings
Table 64. STMicroelectronics High Performance Operational Amplifiers Sales (K Units), Revenue (US$, Mn) and Average Price (US$/Unit) & (2020-2025)
Table 65. STMicroelectronics Key News & Latest Developments
Table 66. NXP Semiconductors Company Summary
Table 67. NXP Semiconductors High Performance Operational Amplifiers Product Offerings
Table 68. NXP Semiconductors High Performance Operational Amplifiers Sales (K Units), Revenue (US$, Mn) and Average Price (US$/Unit) & (2020-2025)
Table 69. NXP Semiconductors Key News & Latest Developments
Table 70. Cirrus Logic Company Summary
Table 71. Cirrus Logic High Performance Operational Amplifiers Product Offerings
Table 72. Cirrus Logic High Performance Operational Amplifiers Sales (K Units), Revenue (US$, Mn) and Average Price (US$/Unit) & (2020-2025)
Table 73. Cirrus Logic Key News & Latest Developments
Table 74. KEC Company Summary
Table 75. KEC High Performance Operational Amplifiers Product Offerings
Table 76. KEC High Performance Operational Amplifiers Sales (K Units), Revenue (US$, Mn) and Average Price (US$/Unit) & (2020-2025)
Table 77. KEC Key News & Latest Developments
Table 78. New Japan Radio Company Summary
Table 79. New Japan Radio High Performance Operational Amplifiers Product Offerings
Table 80. New Japan Radio High Performance Operational Amplifiers Sales (K Units), Revenue (US$, Mn) and Average Price (US$/Unit) & (2020-2025)
Table 81. New Japan Radio Key News & Latest Developments
Table 82. ON Semiconductor Company Summary
Table 83. ON Semiconductor High Performance Operational Amplifiers Product Offerings
Table 84. ON Semiconductor High Performance Operational Amplifiers Sales (K Units), Revenue (US$, Mn) and Average Price (US$/Unit) & (2020-2025)
Table 85. ON Semiconductor Key News & Latest Developments
Table 86. Renesas Electronics Company Summary
Table 87. Renesas Electronics High Performance Operational Amplifiers Product Offerings
Table 88. Renesas Electronics High Performance Operational Amplifiers Sales (K Units), Revenue (US$, Mn) and Average Price (US$/Unit) & (2020-2025)
Table 89. Renesas Electronics Key News & Latest Developments
Table 90. API Technologies Company Summary
Table 91. API Technologies High Performance Operational Amplifiers Product Offerings
Table 92. API Technologies High Performance Operational Amplifiers Sales (K Units), Revenue (US$, Mn) and Average Price (US$/Unit) & (2020-2025)
Table 93. API Technologies Key News & Latest Developments
Table 94. Microchip Technology Company Summary
Table 95. Microchip Technology High Performance Operational Amplifiers Product Offerings
Table 96. Microchip Technology High Performance Operational Amplifiers Sales (K Units), Revenue (US$, Mn) and Average Price (US$/Unit) & (2020-2025)
Table 97. Microchip Technology Key News & Latest Developments
Table 98. High Performance Operational Amplifiers Capacity of Key Manufacturers in Global Market, 2023-2025 (K Units)
Table 99. Global High Performance Operational Amplifiers Capacity Market Share of Key Manufacturers, 2023-2025
Table 100. Global High Performance Operational Amplifiers Production by Region, 2020-2025 (K Units)
Table 101. Global High Performance Operational Amplifiers Production by Region, 2026-2032 (K Units)
Table 102. High Performance Operational Amplifiers Market Opportunities & Trends in Global Market
Table 103. High Performance Operational Amplifiers Market Drivers in Global Market
Table 104. High Performance Operational Amplifiers Market Restraints in Global Market
Table 105. High Performance Operational Amplifiers Raw Materials
Table 106. High Performance Operational Amplifiers Raw Materials Suppliers in Global Market
Table 107. Typical High Performance Operational Amplifiers Downstream
Table 108. High Performance Operational Amplifiers Downstream Clients in Global Market
Table 109. High Performance Operational Amplifiers Distributors and Sales Agents in Global Market

List of Figures
Figure 1. High Performance Operational Amplifiers Product Picture
Figure 2. High Performance Operational Amplifiers Segment by Type in 2024
Figure 3. High Performance Operational Amplifiers Segment by Application in 2024
Figure 4. Global High Performance Operational Amplifiers Market Overview: 2024
Figure 5. Key Caveats
Figure 6. Global High Performance Operational Amplifiers Market Size: 2024 VS 2032 (US$, Mn)
Figure 7. Global High Performance Operational Amplifiers Revenue: 2020-2032 (US$, Mn)
Figure 8. High Performance Operational Amplifiers Sales in Global Market: 2020-2032 (K Units)
Figure 9. The Top 3 and 5 Players Market Share by High Performance Operational Amplifiers Revenue in 2024
Figure 10. Segment by Type – Global High Performance Operational Amplifiers Revenue, (US$, Mn), 2024 & 2032
Figure 11. Segment by Type – Global High Performance Operational Amplifiers Revenue Market Share, 2020-2032
Figure 12. Segment by Type – Global High Performance Operational Amplifiers Sales Market Share, 2020-2032
Figure 13. Segment by Type – Global High Performance Operational Amplifiers Price (US$/Unit), 2020-2032
Figure 14. Segment by Application – Global High Performance Operational Amplifiers Revenue, (US$, Mn), 2024 & 2032
Figure 15. Segment by Application – Global High Performance Operational Amplifiers Revenue Market Share, 2020-2032
Figure 16. Segment by Application – Global High Performance Operational Amplifiers Sales Market Share, 2020-2032
Figure 17. Segment by Application -Global High Performance Operational Amplifiers Price (US$/Unit), 2020-2032
Figure 18. By Region – Global High Performance Operational Amplifiers Revenue, (US$, Mn), 2025 & 2032
Figure 19. By Region – Global High Performance Operational Amplifiers Revenue Market Share, 2020 VS 2024 VS 2032
Figure 20. By Region – Global High Performance Operational Amplifiers Revenue Market Share, 2020-2032
Figure 21. By Region – Global High Performance Operational Amplifiers Sales Market Share, 2020-2032
Figure 22. By Country – North America High Performance Operational Amplifiers Revenue Market Share, 2020-2032
Figure 23. By Country – North America High Performance Operational Amplifiers Sales Market Share, 2020-2032
Figure 24. United States High Performance Operational Amplifiers Revenue, (US$, Mn), 2020-2032
Figure 25. Canada High Performance Operational Amplifiers Revenue, (US$, Mn), 2020-2032
Figure 26. Mexico High Performance Operational Amplifiers Revenue, (US$, Mn), 2020-2032
Figure 27. By Country – Europe High Performance Operational Amplifiers Revenue Market Share, 2020-2032
Figure 28. By Country – Europe High Performance Operational Amplifiers Sales Market Share, 2020-2032
Figure 29. Germany High Performance Operational Amplifiers Revenue, (US$, Mn), 2020-2032
Figure 30. France High Performance Operational Amplifiers Revenue, (US$, Mn), 2020-2032
Figure 31. U.K. High Performance Operational Amplifiers Revenue, (US$, Mn), 2020-2032
Figure 32. Italy High Performance Operational Amplifiers Revenue, (US$, Mn), 2020-2032
Figure 33. Russia High Performance Operational Amplifiers Revenue, (US$, Mn), 2020-2032
Figure 34. Nordic Countries High Performance Operational Amplifiers Revenue, (US$, Mn), 2020-2032
Figure 35. Benelux High Performance Operational Amplifiers Revenue, (US$, Mn), 2020-2032
Figure 36. By Region – Asia High Performance Operational Amplifiers Revenue Market Share, 2020-2032
Figure 37. By Region – Asia High Performance Operational Amplifiers Sales Market Share, 2020-2032
Figure 38. China High Performance Operational Amplifiers Revenue, (US$, Mn), 2020-2032
Figure 39. Japan High Performance Operational Amplifiers Revenue, (US$, Mn), 2020-2032
Figure 40. South Korea High Performance Operational Amplifiers Revenue, (US$, Mn), 2020-2032
Figure 41. Southeast Asia High Performance Operational Amplifiers Revenue, (US$, Mn), 2020-2032
Figure 42. India High Performance Operational Amplifiers Revenue, (US$, Mn), 2020-2032
Figure 43. By Country – South America High Performance Operational Amplifiers Revenue Market Share, 2020-2032
Figure 44. By Country – South America High Performance Operational Amplifiers Sales, Market Share, 2020-2032
Figure 45. Brazil High Performance Operational Amplifiers Revenue, (US$, Mn), 2020-2032
Figure 46. Argentina High Performance Operational Amplifiers Revenue, (US$, Mn), 2020-2032
Figure 47. By Country – Middle East & Africa High Performance Operational Amplifiers Revenue, Market Share, 2020-2032
Figure 48. By Country – Middle East & Africa High Performance Operational Amplifiers Sales, Market Share, 2020-2032
Figure 49. Turkey High Performance Operational Amplifiers Revenue, (US$, Mn), 2020-2032
Figure 50. Israel High Performance Operational Amplifiers Revenue, (US$, Mn), 2020-2032
Figure 51. Saudi Arabia High Performance Operational Amplifiers Revenue, (US$, Mn), 2020-2032
Figure 52. UAE High Performance Operational Amplifiers Revenue, (US$, Mn), 2020-2032
Figure 53. Global High Performance Operational Amplifiers Production Capacity (K Units), 2020-2032
Figure 54. The Percentage of Production High Performance Operational Amplifiers by Region, 2024 VS 2032
Figure 55. High Performance Operational Amplifiers Industry Value Chain
Figure 56. Marketing Channels