MARKET INSIGHTS
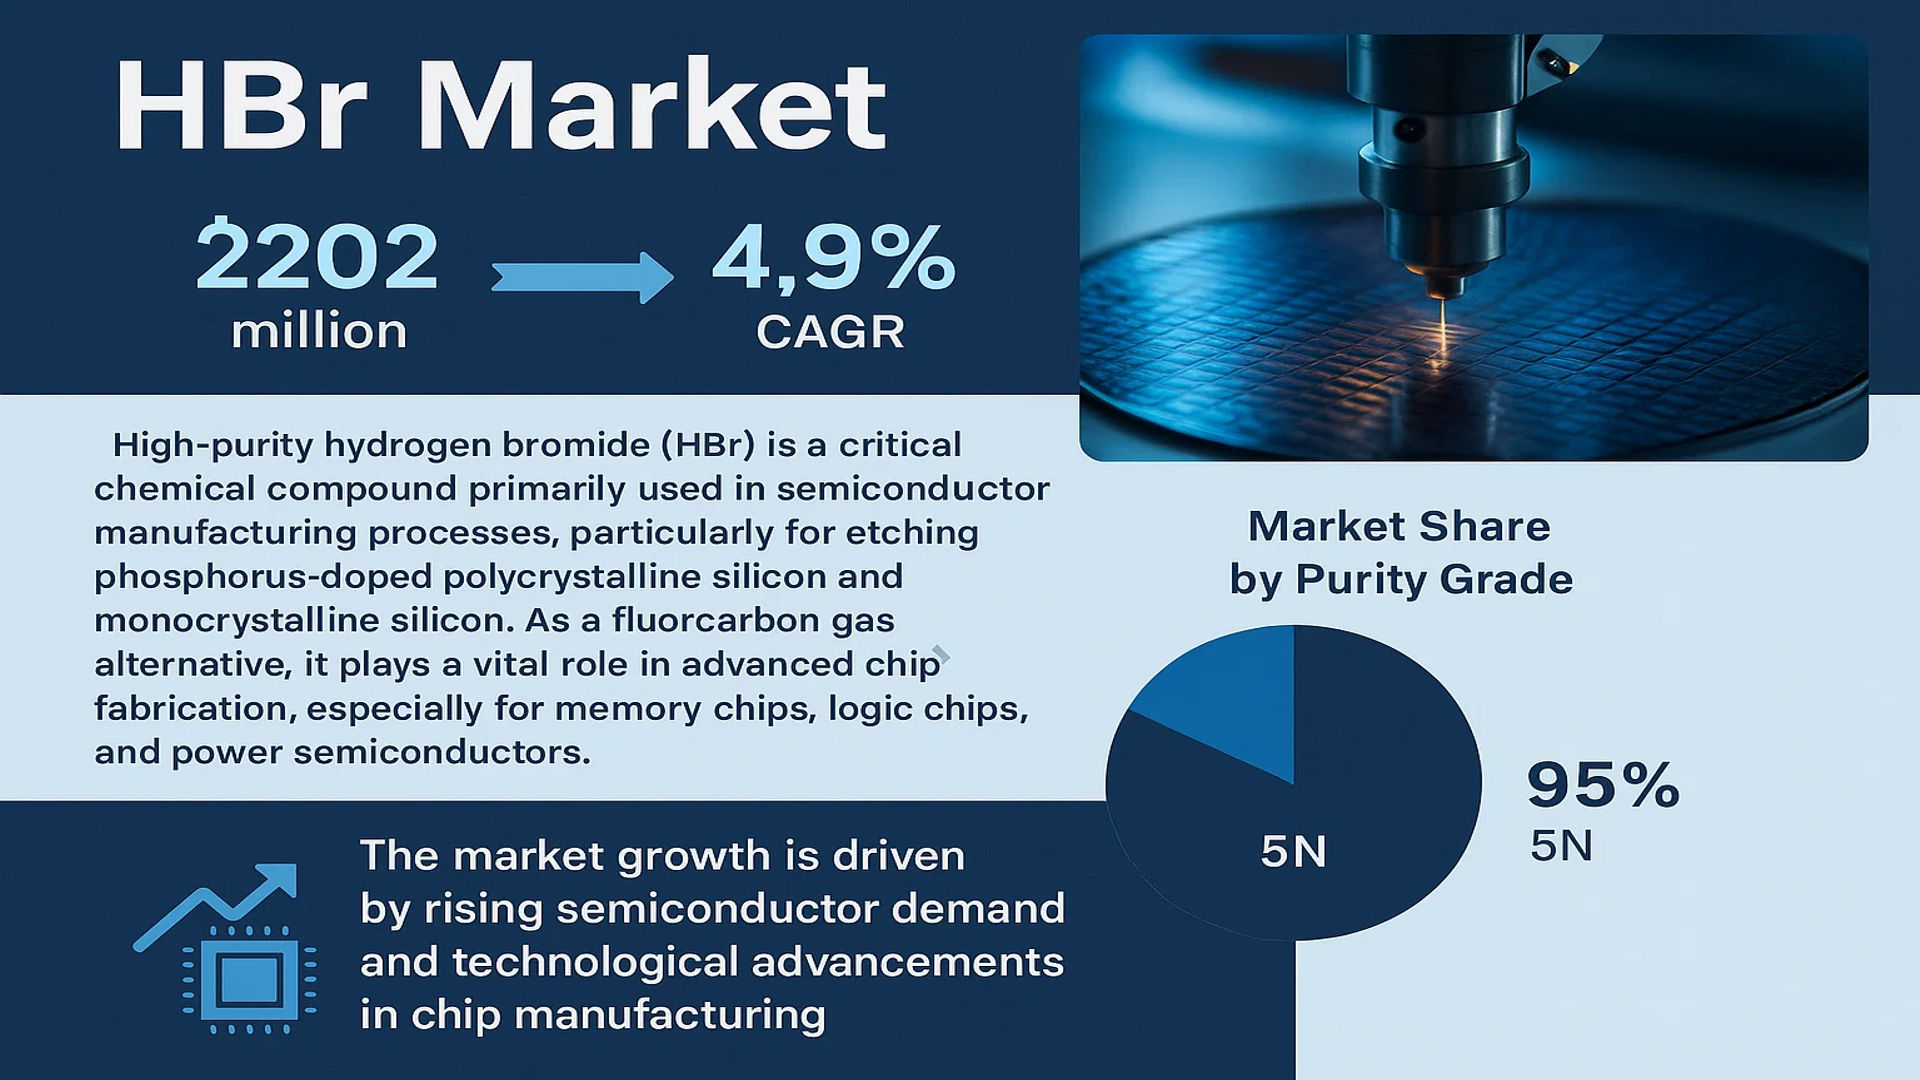
The global HBr Market was valued at 202 million in 2024 and is projected to reach US$ 315 million by 2032, at a CAGR of 4.9% during the forecast period.
High-purity hydrogen bromide (HBr) is a critical chemical compound primarily used in semiconductor manufacturing processes, particularly for etching phosphorus-doped polycrystalline silicon and monocrystalline silicon. As a fluorocarbon gas alternative, it plays a vital role in advanced chip fabrication, especially for memory chips, logic chips, and power semiconductors. The 5N purity grade dominates the market with a 95% share, reflecting its essential role in high-tech applications.
The market growth is driven by rising semiconductor demand and technological advancements in chip manufacturing. Asia Pacific leads global consumption with 76% market share, reflecting the region’s semiconductor industry dominance, while North America and Europe account for 16% and 8% respectively. Key players including Resonac, Air Liquide, and Adeka collectively hold 79% of the market, demonstrating strong industry consolidation. The semiconductor segment remains the primary application, representing 87% of total demand.
MARKET DYNAMICS
MARKET DRIVERS
Increasing Semiconductor Production to Accelerate Global HBr Demand
The global semiconductor industry has been witnessing robust growth, with production volumes increasing by approximately 8-10% annually since 2020. This expansion is significantly driving demand for high-purity hydrogen bromide (HBr), which plays a critical role in advanced chip manufacturing processes. The growing adoption of 5G technology, artificial intelligence applications, and IoT devices has created sustained demand for memory chips and advanced logic circuits that utilize HBr in their production. Major semiconductor foundries in Asia, North America, and Europe are expanding their manufacturing capabilities with multi-billion dollar investments expected to continue through 2030.
Transition Toward Eco-Friendly Etching Solutions Fuels Market Expansion
Environmental regulations worldwide are becoming increasingly stringent on the use of fluorocarbon gases in semiconductor manufacturing. HBr serves as a more environmentally friendly alternative for etching processes, particularly for phosphorus-doped silicon applications. The semiconductor industry’s commitment to reducing greenhouse gas emissions by 50% before 2030 is accelerating the adoption of HBr solutions. This transition is particularly evident in advanced nodes below 7nm where HBr demonstrates superior selectivity and precision compared to traditional alternatives.
Government Investments in Semiconductor Self-Sufficiency Create Growth Opportunities
National initiatives aimed at reducing reliance on imported semiconductors are generating significant market momentum. The expansion of domestic semiconductor production capacities in key regions through government subsidies and incentives is creating new demand centers for HBr. Recent legislative actions across multiple countries have allocated over $200 billion collectively for semiconductor industry development, with a substantial portion dedicated to advanced manufacturing facilities that utilize HBr in their processes.
MARKET RESTRAINTS
Supply Chain Vulnerabilities and Raw Material Shortages Constrain Growth
The HBr market faces persistent challenges in maintaining stable supply chains for critical raw materials. Geopolitical tensions and trade restrictions have created bottlenecks in the procurement of essential bromine compounds required for high-purity HBr production. This situation has led to periodic price volatility, with spot market prices fluctuating up to 30% during supply disruptions. Semiconductor manufacturers’ just-in-time inventory practices amplify these challenges, as even temporary shortages can disrupt production schedules across the value chain.
Other Restraints
Technological Alternative Development
Emerging dry etching technologies utilizing alternative chemistries pose a long-term challenge to HBr market growth. Research institutions and equipment manufacturers are investing heavily in developing next-generation etching solutions that could potentially reduce reliance on HBr in certain applications.
Safety and Handling Concerns
The corrosive nature and toxicity of HBr necessitate specialized handling procedures and safety infrastructure, increasing total cost of ownership for end-users. These requirements can deter adoption by smaller semiconductor fabrication facilities with limited capital expenditure capabilities.
MARKET OPPORTUNITIES
Expansion of Power Semiconductor Manufacturing Creates New Growth Avenues
The rapid electrification of automotive and industrial sectors is driving substantial investments in power semiconductor production capacity. These devices, particularly silicon carbide and gallium nitride-based components, require specialized manufacturing processes where HBr plays an indispensable role. With the power semiconductor market projected to grow at nearly 12% CAGR through 2030, this segment presents significant untapped potential for HBr suppliers to diversify their customer base beyond traditional logic and memory chip manufacturers.
Emerging Applications in Advanced Packaging Technologies Offer Promise
Innovations in semiconductor packaging, particularly 3D IC stacking and heterogeneous integration, are creating novel applications for HBr in selective etching processes. The advanced packaging market is growing at nearly 15% annually as chipmakers seek to overcome Moore’s Law limitations through architectural innovations. These developments are opening up opportunities for HBr suppliers to develop specialized formulations optimized for next-generation packaging applications.
MARKET CHALLENGES
Intense Competitive Pressure from Alternative Etching Solutions
The HBr market faces intensifying competition from alternative etching chemistries that offer comparable performance characteristics. Several new fluorine-based and plasma-enhanced etching solutions are being developed specifically to address the same applications where HBr currently dominates. These alternatives threaten to erode HBr’s market share, particularly in price-sensitive market segments where the premium for HBr’s environmental benefits becomes difficult to justify.
Other Challenges
Tightening Purity Requirements
As semiconductor nodes continue to shrink below 3nm, purity requirements for process gases are becoming increasingly stringent. Meeting these evolving specifications requires substantial capital investments in production facilities and quality control systems that may strain the financial resources of smaller HBr manufacturers.
Logistical Complexities
The specialized handling and transportation requirements for high-purity HBr create logistical challenges, particularly for international supply chains. These complexities are compounded by varying regional regulations governing the transport of hazardous materials, potentially limiting market expansion opportunities.
HBr MARKET TRENDS
Semiconductor Industry Expansion Drives HBr Demand
The global high-purity hydrogen bromide (HBr) market, valued at $202 million in 2024, is experiencing significant growth due to its critical role in semiconductor manufacturing. As a key etching agent for phosphorus-doped polycrystalline and monocrystalline silicon, HBr has become indispensable in advanced chip fabrication processes. The market is projected to reach $315 million by 2032, growing at a CAGR of 4.9%, with the semiconductor sector accounting for 87% of total demand. This trend is particularly pronounced in Asia Pacific, where 76% of global HBr consumption occurs to support the region’s dominant electronics manufacturing ecosystem.
Other Trends
Technological Advancements in Gas Purification
Manufacturers are heavily investing in purification technologies to meet the semiconductor industry’s stringent requirements for ultra-high purity gases. The 5N purity grade segment (99.999% pure) currently dominates with 95% market share, driven by the need for defect-free etching in sub-7nm chip fabrication. Recent breakthroughs in multi-stage purification systems have enabled producers to achieve 6N purity levels for next-generation semiconductor applications. These advancements are particularly crucial for memory chip production, where even minor impurities can significantly impact yield rates.
Strategic Supply Chain Consolidation
The HBr market demonstrates strong consolidation, with the top three producers (Resonac, Air Liquide, and Adeka) controlling 79% of global supply. This concentration enables economies of scale in production but creates challenges for smaller manufacturers facing high barriers to entry. Companies are increasingly forming long-term supply agreements with semiconductor fabs to ensure stable deliveries amidst fluctuating demand. The current supply-demand balance remains tight, with lead times extending to 8-12 weeks for spot purchases of high-purity grades in peak seasons.
COMPETITIVE LANDSCAPE
Key Industry Players
Semiconductor Demand Drives Consolidation Among HBr Suppliers
The global HBr market exhibits a highly concentrated competitive landscape, where the top three players collectively control approximately 79% of market share as of 2024. Resonac Corporation (formerly Showa Denko) leads the segment through its vertically integrated bromine supply chain and established relationships with major semiconductor fabs across Asia. The company’s recent expansion of high-purity gas production capacity in Taiwan positions it to maintain dominance in the 5N purity segment.
Air Liquide and Adeka Corporation follow closely, leveraging their respective strengths in gas distribution networks and specialty chemical manufacturing. While Air Liquide benefits from its global infrastructure serving logic chip manufacturers, Adeka maintains technological leadership in etching gas formulations for advanced nodes below 7nm. Both companies are actively expanding production to meet the surge in demand from memory chip producers in South Korea and China.
Smaller players compete through regional specialization or niche applications. Nippon Sanso Holdings has strengthened its position in the display panel segment through customized HBr mixtures for OLED production, while Linde plc focuses on serving fab clusters in North America and Europe. The market’s technical barriers, including stringent purity requirements and specialized handling protocols, continue to limit new entrants despite growing demand.
List of Key High-Purity HBr Companies Profiled
- Resonac Corporation (Japan)
- Air Liquide S.A. (France)
- Adeka Corporation (Japan)
- Linde plc (UK)
- Nippon Sanso Holdings (Japan)
- Kanto Denka Kogyo Co., Ltd. (Japan)
- Versum Materials (U.S.)
- Peric Special Gases (China)
Segment Analysis:
By Type
High-Purity 5N Segment Dominates the Market Due to Critical Demand in Semiconductor Manufacturing
The market is segmented based on purity level into:
- 5N (99.999% pure)
- Subtypes: Electronic grade, Technical grade
- Others
- Subtypes: 4N, 3N purity grades
By Application
Semiconductor Segment Leads Due to Extensive Use in Advanced Chip Fabrication
The market is segmented based on application into:
- Semiconductors
- Subtypes: Memory chips, Logic chips, Power semiconductors
- Display panels
- Industrial chemicals
- Pharmaceuticals
- Others
By Form
Gas Form Segment Dominates for Precision Applications in Semiconductor Manufacturing
The market is segmented based on physical form into:
- Gas
- Liquid
- Solid (rare applications)
By End-User Industry
Electronics Industry Segment Leads Due to High Consumption in Chip Production
The market is segmented based on end-user industry into:
- Electronics
- Chemical manufacturing
- Pharmaceuticals
- Research institutions
Regional Analysis: HBr Market
Asia-Pacific
The Asia-Pacific region dominates the global HBr market, accounting for approximately 76% of total consumption due to its thriving semiconductor industry. China leads demand with its massive semiconductor manufacturing base and government-backed initiatives like the Made in China 2025 plan, which prioritizes advanced chip production. Japan and South Korea follow closely, home to major semiconductor players such as TSMC, Samsung, and SK Hynix that rely heavily on high-purity HBr for chip fabrication. Despite strong demand, the region faces challenges such as supply chain vulnerabilities and geopolitical tensions affecting raw material procurement. The shift toward 3nm and 5nm chip processes further intensifies the need for ultrapure HBr grades (5N and above), positioning the region as an innovation hub for semiconductor materials.
North America
North America holds 16% of the global HBr market, driven by its advanced semiconductor sector and stringent regulations on fluorocarbon alternatives. The U.S. CHIPS and Science Act, allocating $52 billion for domestic semiconductor production, is accelerating facility expansions and HBr demand for logic and memory chip fabrication. Key industry players like Intel and Texas Instruments are investing in next-generation fabs, particularly in Arizona and Ohio. However, reliance on Asian imports for HBr supply creates vulnerabilities, prompting collaborations with local suppliers such as Air Liquide to enhance regional capacity. Environmental compliance remains critical, with the EPA’s PFAS restrictions encouraging the adoption of HBr as a safer etching gas.
Europe
Europe accounts for 8% of the HBr market, with growth anchored in specialized semiconductor applications and automotive power electronics. Germany and France lead consumption, supported by initiatives like the European Chips Act, which aims to double the region’s semiconductor share by 2030. Research institutions and companies like Infineon Technologies are pioneering HBr-based processes for energy-efficient chips and SiC power devices. However, high production costs and limited local HBr manufacturing constrain market potential, necessitating strategic partnerships with global suppliers. Stricter REACH regulations also push for sustainable gas alternatives, reinforcing HBr’s role in green semiconductor manufacturing.
South America
South America represents a nascent but emerging market for HBr, with Brazil showing early adoption in electronics and automotive sectors. Local semiconductor assembly plants and growing FDI in technology parks present opportunities for HBr suppliers. However, economic instability, underdeveloped supply chains, and minimal domestic production hinder market expansion. Most HBr is imported from Asia and North America, leading to higher costs and logistical delays. Despite these challenges, Brazil’s focus on industrial modernization and renewable energy could drive future demand for HBr in power semiconductor applications.
Middle East & Africa
The Middle East & Africa region is in the early stages of HBr market development, with limited demand concentrated in Israel and the UAE. Israel’s robust semiconductor design industry and investments in fabless manufacturing create niche opportunities for HBr suppliers. Meanwhile, the UAE’s push for smart city projects and renewable energy infrastructure could spur demand for power semiconductors using HBr. However, the absence of local production facilities and low regulatory urgency around fluorocarbon alternatives restrict market growth. Long-term potential lies in technology transfer agreements and partnerships with global HBr producers to establish regional supply bases.
Report Scope
This market research report provides a comprehensive analysis of the Global Hydrogen Bromide (HBr) Market, covering the forecast period 2024–2032. It offers detailed insights into market dynamics, technological advancements, competitive landscape, and key trends shaping the semiconductor gas industry.
Key focus areas of the report include:
- Market Size & Forecast: Historical data and future projections for revenue, volume (Tons), and market value across major regions and segments. The Global HBr market was valued at USD 202 million in 2024 and is projected to reach USD 315 million by 2032, growing at a CAGR of 4.9%.
- Segmentation Analysis: Detailed breakdown by product purity (5N and others) and application (Semiconductor and Display Panel). The 5N purity segment dominates with 95% market share, while the Semiconductor application holds 87% market share.
- Regional Outlook: Insights into market performance across Asia-Pacific (76% share), North America (16% share), and Europe (8% share), with country-level analysis of key markets including China, Japan, South Korea, and the US.
- Competitive Landscape: Profiles of leading market participants including Resonac, Air Liquide, Adeka, Linde, and Nippon Sanso, which collectively hold 79% market share. Analysis covers their product offerings, manufacturing capacity, and recent developments.
- Technology Trends & Innovation: Assessment of HBr’s role in advanced chip processes, including etching applications for memory chips, logic chips, and power semiconductors.
- Market Drivers & Restraints: Evaluation of factors such as semiconductor industry growth, demand for fluorocarbon alternatives, and supply chain considerations in the specialty gases market.
- Stakeholder Analysis: Insights for semiconductor manufacturers, gas suppliers, equipment makers, and investors regarding the evolving high-purity gas ecosystem.
The research methodology combines primary interviews with HBr manufacturers and secondary data from verified industry sources to ensure accuracy and reliability.
FREQUENTLY ASKED QUESTIONS:
What is the current market size of Global HBr Market?
-> HBr Market was valued at 202 million in 2024 and is projected to reach US$ 315 million by 2032, at a CAGR of 4.9% during the forecast period.
Which key companies operate in Global HBr Market?
-> Key players include Resonac, Air Liquide, Adeka, Linde, and Nippon Sanso, with the top three companies holding 79% market share.
What are the key growth drivers?
-> Key growth drivers include expansion of semiconductor manufacturing, demand for advanced chip processes, and adoption of HBr as a fluorocarbon alternative.
Which region dominates the market?
-> Asia-Pacific dominates with 76% market share, driven by semiconductor production in China, Japan, and South Korea.
What are the emerging trends?
-> Emerging trends include increased adoption in memory chip production, development of ultra-high purity grades, and integration into advanced semiconductor nodes.

Get Sample Report PDF for Exclusive Insights
Report Sample Includes
- Table of Contents
- List of Tables & Figures
- Charts, Research Methodology, and more...


