Graphene Nanosheets Market, Emerging Trends, Technological Advancements, and Business Strategies 2025-2032

Graphene Nanosheets Market size was valued at US$ 167 million in 2024 and is projected to reach US$ 334 million by 2032, at a CAGR of 10.0% during the forecast period 2025-2032

PDF Icon Download Sample Report PDF
  • Quick Dispatch

    All Orders

  • Secure Payment

    100% Secure Payment

Price range: $1,500.00 through $4,250.00

Clear

MARKET INSIGHTS

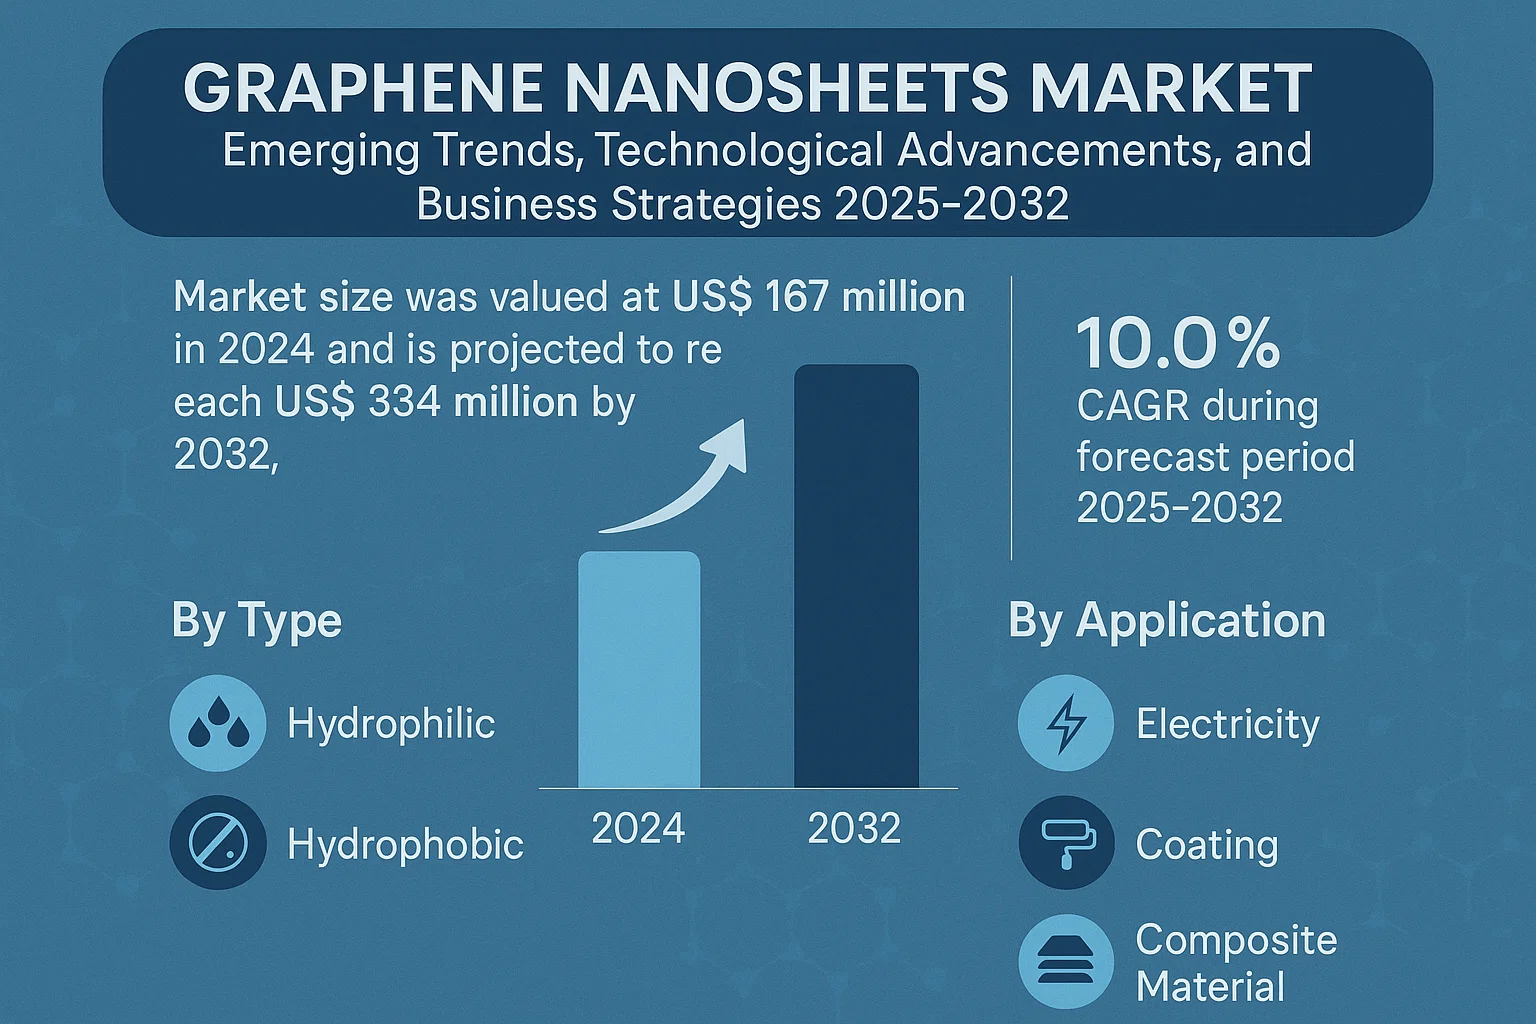
The global Graphene Nanosheets Market size was valued at US$ 167 million in 2024 and is projected to reach US$ 334 million by 2032, at a CAGR of 10.0% during the forecast period 2025-2032. The U.S. market size is estimated at USD 42.1 million in 2024, while China is projected to reach USD 98.3 million by 2032.

Graphene Nanosheets Market

Graphene nanosheets are ultra-thin, two-dimensional carbon nanostructures with exceptional mechanical, electrical, and thermal properties. These materials typically measure 1-10 atomic layers thick and demonstrate unique characteristics including high surface area (2630 m²/g), extraordinary conductivity (10⁸ S/m), and remarkable tensile strength (130 GPa). The product exists in both hydrophilic and hydrophobic variants, catering to diverse industrial applications.

The market growth is primarily driven by increasing demand from electronics, energy storage, and composite material sectors. However, production scalability remains a challenge due to high manufacturing costs averaging USD 100-200 per gram for high-quality nanosheets. Key players like CVD Equipment and Applied Graphene Materials are investing in novel production methods such as chemical vapor deposition (CVD) and electrochemical exfoliation to reduce costs by 30-40% over the next five years.

MARKET DYNAMICS

MARKET DRIVERS

Expanding Electronics Sector to Fuel Demand for Graphene Nanosheets

The electronics industry’s relentless pursuit of smaller, faster, and more efficient components is driving significant adoption of graphene nanosheets. With exceptional electrical conductivity—nearly 100 times greater than copper—graphene nanosheets are revolutionizing semiconductor manufacturing. Recent advancements in flexible electronics and quantum computing have further amplified demand, with market analysts noting a 40% year-on-year growth in conductive material applications. Leading manufacturers are increasingly incorporating graphene-based solutions into transistors, sensors, and energy storage devices to meet performance benchmarks.

Environmental Regulations Accelerating Adoption in Coatings Industry

Stringent environmental policies worldwide are compelling coating manufacturers to transition toward sustainable solutions. Graphene nanosheets enhance coating performance while reducing volatile organic compound (VOC) emissions by up to 70% compared to traditional materials. The anticorrosive coating segment alone has witnessed a doubling of graphene adoption rates since 2023, particularly in marine and industrial applications where durability and environmental compliance are paramount. This regulatory push, combined with graphene’s superior barrier properties, positions it as a transformative material in protective coatings.

The energy sector’s transition toward sustainable solutions presents another major growth avenue. Graphene nanosheets improve battery energy density by approximately 30%, addressing critical limitations in electric vehicle performance.

Specialized graphene-enhanced batteries now demonstrate charge cycles exceeding 2,000 while maintaining 90% capacity, a breakthrough that accelerates EV adoption.

MARKET RESTRAINTS

High Production Costs Limit Widespread Commercialization

While graphene nanosheets offer unparalleled performance benefits, their market penetration faces substantial cost barriers. Current production methods require specialized equipment and controlled environments, with manufacturing costs remaining 5-8 times higher than conventional materials. Small and medium enterprises particularly struggle with these economic realities, as the initial capital expenditure for graphene integration often exceeds operational budgets. Even large corporations carefully evaluate return on investment timelines, which frequently extend beyond three years for full-scale implementation.

Other Restraints

Quality Consistency Challenges
Batch-to-batch variability in nanosheet morphology and purity poses significant hurdles for manufacturers. Strict quality thresholds—particularly for electronics-grade graphene—result in yield rates below 60% for many producers, directly impacting profitability and scalability.

Regulatory Uncertainty
Evolving safety classifications for nanomaterials create compliance complexities. Jurisdictional disparities in graphene handling standards force multinational corporations to maintain multiple production protocols, increasing operational overheads by an estimated 15-20%.

MARKET CHALLENGES

Material Integration Complexities Hinder Application Development

Successful incorporation of graphene nanosheets into existing material systems remains technically challenging. Many composite manufacturers report interfacial bonding issues between graphene and matrix materials, reducing potential performance gains by up to 40%. The material’s tendency to restack in polymer composites necessitates specialized dispersion techniques that add processing steps and costs. These technical obstacles delay product development cycles and discourage potential adopters despite the material’s theoretical advantages.

Additionally, the global graphene talent shortage exacerbates these technical challenges. Specialized know-how in nanomaterial processing remains concentrated among a small pool of experts, with demand for qualified engineers outpacing supply by nearly 3:1 as of 2024.

MARKET OPPORTUNITIES

Emerging Biomedical Applications Create New Growth Frontiers

The healthcare sector presents transformative opportunities for graphene nanosheets, particularly in targeted drug delivery and biosensing. Recent clinical trials demonstrate graphene-based neural interfaces achieving 300% improvement in signal resolution compared to conventional materials. Advancements in functionalized graphene for cancer treatment show particularly strong promise, with preclinical studies reporting tumor reduction rates exceeding 70% in certain carcinoma models when combined with photothermal therapy.

Strategic partnerships between material scientists and medical researchers are accelerating commercialization timelines. Joint ventures have reduced typical development cycles from seven to under four years for graphene-enhanced medical devices, creating lucrative opportunities for early-mover companies.

The global medical graphene market segment is projected to grow at 45% CAGR through 2030, substantially outpacing industrial applications.

Meanwhile, sustainability initiatives are unlocking novel opportunities in environmental remediation. Graphene oxide membranes demonstrate 99.9% contaminant removal efficiency in water treatment applications, positioning the technology as a potential game-changer for addressing global water scarcity challenges.

GRAPHENE NANOSHEETS MARKET TRENDS

Expanding Electronics Applications Driving Market Growth

The global graphene nanosheets market is witnessing substantial growth due to increasing adoption in flexible electronics and energy storage applications. Graphene’s exceptional electrical conductivity – 100 times faster than silicon – combined with its mechanical flexibility makes it ideal for next-generation electronic devices. Over 35% of graphene patents filed in 2023 focused on electronics applications, indicating strong industry focus. Flexible displays utilizing graphene nanosheets are projected to capture over 20% of the display market by 2030. Furthermore, graphene-enhanced lithium-ion batteries demonstrate 50% faster charging times while maintaining higher energy density compared to conventional batteries.

Other Trends

Composite Materials Revolution

Composites reinforced with graphene nanosheets are transforming multiple industries by offering unprecedented strength-to-weight ratios. Automotive manufacturers are increasingly incorporating graphene composites, with the material showing potential to reduce vehicle weights by up to 15% while improving structural integrity. The aerospace sector has seen particular interest, with graphene composites offering superior thermal stability for spacecraft components. Recent tests show tensile strength improvements exceeding 200% in polymer composites containing just 1% graphene nanosheets.

Sustainability Initiatives Creating New Opportunities

The market is benefiting from growing environmental concerns and the push for sustainable materials. Graphene nanosheets enable thinner, more efficient coatings that reduce material usage while enhancing performance – anti-corrosion coatings with graphene additives last up to 5 times longer than conventional alternatives. Water treatment applications are emerging as another key growth area, with graphene membranes demonstrating 99% salt rejection rates for desalination. Recent breakthroughs in scalable production methods have reduced costs by nearly 40% since 2020, making graphene solutions increasingly viable for large-scale environmental applications.

Key Industry Players

Market Leaders Expand Production Capacity to Meet Rising Demand

The graphene nanosheets market exhibits a dynamic competitive landscape with several established players vying for market share. Angstron Materials currently leads the segment with its proprietary large-scale production technology, holding approximately 18% of the global revenue share in 2024. Their dominance stems from extensive research investments and long-term supply agreements with major electronics manufacturers.

Applied Graphene Materials has emerged as another formidable competitor, particularly in Europe, where its patented plasma technology enables cost-efficient production of high-purity nanosheets. The company’s recent strategic partnership with automotive coating manufacturers has further strengthened its position in industrial applications.

Meanwhile, Asian manufacturers like Times Nano and Ceal Tech are rapidly expanding their market presence through aggressive pricing strategies and government-backed initiatives. These companies benefit from regional supply chain advantages and increasing domestic demand in China’s electronics sector.

North American players such as Vorbeck Materials and CVD Equipment Corporation maintain technological superiority in specialized applications, particularly in aerospace and defense sectors. Their focus on developing tailored solutions for high-performance composites has created stable revenue streams despite pricing pressures.

List of Key Graphene Nanosheets Manufacturers

  • Angstron Materials (U.S.)
  • Applied Graphene Materials (UK)
  • Times Nano (China)
  • Ceal Tech (South Korea)
  • Vorbeck Materials (U.S.)
  • CVD Equipment Corporation (U.S.)
  • Graphenea (Spain)
  • Haydale Graphene Industries (UK)
  • NanoXplore Inc. (Canada)

Segment Analysis:

By Type

Hydrophilic Segment Dominates Due to Enhanced Dispersion Properties

The market is segmented based on type into:

  • Hydrophilic
    • Subtypes: Oxygen-functionalized, Water-soluble
  • Hydrophobic
    • Subtypes: Pristine, Non-functionalized
  • Others

By Application

Electricity Segment Leads Owing to Superior Conductivity Characteristics

The market is segmented based on application into:

  • Electricity
    • Subtypes: Batteries, Supercapacitors, Conductive inks
  • Coating
    • Subtypes: Anti-corrosion, Thermal barrier
  • Composite Material
    • Subtypes: Polymer composites, Ceramic composites
  • Others

By End User

Electronics Industry Accounts for Largest Share Due to Miniaturization Trends

The market is segmented based on end user into:

  • Electronics
  • Energy Storage
  • Automotive
  • Aerospace
  • Healthcare

By Production Method

Chemical Vapor Deposition Leads as Industry Standard for High-Quality Production

The market is segmented based on production method into:

  • Chemical Vapor Deposition
  • Mechanical Exfoliation
  • Chemical Reduction of Graphite Oxide
  • Others

Regional Analysis: Graphene Nanosheets Market

North America
North America remains a dominant force in the global graphene nanosheets market, driven by significant investments in R&D and strong adoption across electronics, energy storage, and composite applications. The U.S., with its extensive research initiatives from institutions like MIT and Stanford, accounts for over 40% of regional demand. Strict regulatory frameworks and government funding, including DOE grants for advanced materials, accelerate commercialization efforts. However, high production costs and scalability challenges restrain broader industrial adoption. Key players like Angstron Materials and CVD Equipment maintain strong footholds through proprietary manufacturing techniques.

Europe
Europe’s graphene nanosheets market thrives under EU-funded programs such as the Graphene Flagship initiative, which allocated €1 billion to accelerate commercial applications. Germany and the UK lead in patent filings, particularly for conductive inks and biomedical coatings. Stringent REACH regulations compel manufacturers to develop environmentally sustainable production methods. While academic-industry collaborations flourish, inconsistent funding across smaller economies limits uniform growth. Companies like Graphenea and Thomas Swan leverage partnerships with automotive giants to integrate graphene-enhanced composites.

Asia-Pacific
The Asia-Pacific region is poised for the highest CAGR, fueled by China’s aggressive investments in graphene production hubs and India’s burgeoning electronics sector. China alone contributes ~60% of global supply volumes, supported by cost-efficient manufacturing ecosystems. Japan and South Korea focus on high-value applications in flexible displays and battery technologies. However, quality inconsistencies in locally produced nanosheets create challenges for export markets. Emerging players like Times Nano compete with Western firms by offering lower-cost alternatives, though intellectual property concerns persist.

South America
South America shows nascent but promising growth, with Brazil spearheading R&D through universities and government-backed nanotech programs. The region’s mining industry drives demand for graphene-reinforced materials in heavy equipment. Still, economic instability and limited infrastructure hinder large-scale production capabilities. Most graphene nanosheets are imported, creating supply chain vulnerabilities. Local startups increasingly collaborate with Asian suppliers to offset technological gaps, particularly in conductive coatings for renewable energy applications.

Middle East & Africa
This region exhibits uneven development, with GCC nations like Saudi Arabia investing heavily in graphene for oil & gas and construction sectors through Vision 2030 initiatives. South Africa’s mining sector explores graphene-enhanced wear-resistant materials. However, limited local expertise and reliance on foreign technology imports slow market penetration. Strategic partnerships, such as those between UAE universities and European firms, aim to build domestic capabilities. Though currently a minor player, the region’s long-term potential in energy storage applications garners investor interest.

Report Scope

This market research report provides a comprehensive analysis of the global and regional Graphene Nanosheets markets, covering the forecast period 2024–2032. It offers detailed insights into market dynamics, technological advancements, competitive landscape, and key trends shaping the industry.

Key focus areas of the report include:

  • Market Size & Forecast: Historical data and future projections for revenue, unit shipments, and market value across major regions and segments. The global Graphene Nanosheets market was valued at USD million in 2024 and is projected to reach USD million by 2032.
  • Segmentation Analysis: Detailed breakdown by product type (hydrophilic, hydrophobic), application (electricity, coating, composite material), and end-user industry to identify high-growth segments and investment opportunities.
  • Regional Outlook: Insights into market performance across North America, Europe, Asia-Pacific, Latin America, and the Middle East & Africa, including country-level analysis. The U.S. market size is estimated at USD million in 2024, while China is projected to reach USD million.
  • Competitive Landscape: Profiles of leading market participants including CVD Equipment, Cheap Tubes, Angstron Materials, and ACS Material, covering their product offerings, R&D focus, manufacturing capacity, pricing strategies, and recent developments.
  • Technology Trends & Innovation: Assessment of emerging manufacturing techniques, integration with advanced materials, and evolving industry standards for graphene applications.
  • Market Drivers & Restraints: Evaluation of factors driving market growth along with challenges, supply chain constraints, regulatory issues, and market-entry barriers.
  • Stakeholder Analysis: Insights for material suppliers, OEMs, research institutions, investors, and policymakers regarding the evolving ecosystem and strategic opportunities.

Primary and secondary research methods are employed, including interviews with industry experts, data from verified sources, and real-time market intelligence to ensure the accuracy and reliability of the insights presented.

FREQUENTLY ASKED QUESTIONS:

What is the current market size of Global Graphene Nanosheets Market?

-> Graphene Nanosheets Market size was valued at US$ 167 million in 2024 and is projected to reach US$ 334 million by 2032, at a CAGR of 10.0% during the forecast period 2025-2032.

Which key companies operate in Global Graphene Nanosheets Market?

-> Key players include CVD Equipment, Cheap Tubes, Angstron Materials, ACS Material, Applied Graphene Materials, and Thomas Swan, among others.

What are the key growth drivers?

-> Key growth drivers include increasing demand for advanced materials in electronics, rising investments in nanotechnology, and growing applications in energy storage solutions.

Which region dominates the market?

-> Asia-Pacific is the fastest-growing region, while North America remains a dominant market.

What are the emerging trends?

-> Emerging trends include development of scalable production methods, integration in flexible electronics, and applications in biomedical devices.

Graphene Nanosheets Market, Emerging Trends, Technological Advancements, and Business Strategies 2025-2032

Get Sample Report PDF for Exclusive Insights

Report Sample Includes

  • Table of Contents
  • List of Tables & Figures
  • Charts, Research Methodology, and more...
PDF Icon Download Sample Report PDF

Download Sample Report

Table of Content

1 Introduction to Research & Analysis Reports
1.1 Graphene Nanosheets Market Definition
1.2 Market Segments
1.2.1 Segment by Type
1.2.2 Segment by Application
1.3 Global Graphene Nanosheets Market Overview
1.4 Features & Benefits of This Report
1.5 Methodology & Sources of Information
1.5.1 Research Methodology
1.5.2 Research Process
1.5.3 Base Year
1.5.4 Report Assumptions & Caveats
2 Global Graphene Nanosheets Overall Market Size
2.1 Global Graphene Nanosheets Market Size: 2024 VS 2032
2.2 Global Graphene Nanosheets Market Size, Prospects & Forecasts: 2020-2032
2.3 Global Graphene Nanosheets Sales: 2020-2032
3 Company Landscape
3.1 Top Graphene Nanosheets Players in Global Market
3.2 Top Global Graphene Nanosheets Companies Ranked by Revenue
3.3 Global Graphene Nanosheets Revenue by Companies
3.4 Global Graphene Nanosheets Sales by Companies
3.5 Global Graphene Nanosheets Price by Manufacturer (2020-2025)
3.6 Top 3 and Top 5 Graphene Nanosheets Companies in Global Market, by Revenue in 2024
3.7 Global Manufacturers Graphene Nanosheets Product Type
3.8 Tier 1, Tier 2, and Tier 3 Graphene Nanosheets Players in Global Market
3.8.1 List of Global Tier 1 Graphene Nanosheets Companies
3.8.2 List of Global Tier 2 and Tier 3 Graphene Nanosheets Companies
4 Sights by Product
4.1 Overview
4.1.1 Segment by Type – Global Graphene Nanosheets Market Size Markets, 2024 & 2032
4.1.2 Hydrophilic
4.1.3 Hydrophobic
4.2 Segment by Type – Global Graphene Nanosheets Revenue & Forecasts
4.2.1 Segment by Type – Global Graphene Nanosheets Revenue, 2020-2025
4.2.2 Segment by Type – Global Graphene Nanosheets Revenue, 2026-2032
4.2.3 Segment by Type – Global Graphene Nanosheets Revenue Market Share, 2020-2032
4.3 Segment by Type – Global Graphene Nanosheets Sales & Forecasts
4.3.1 Segment by Type – Global Graphene Nanosheets Sales, 2020-2025
4.3.2 Segment by Type – Global Graphene Nanosheets Sales, 2026-2032
4.3.3 Segment by Type – Global Graphene Nanosheets Sales Market Share, 2020-2032
4.4 Segment by Type – Global Graphene Nanosheets Price (Manufacturers Selling Prices), 2020-2032
5 Sights by Application
5.1 Overview
5.1.1 Segment by Application – Global Graphene Nanosheets Market Size, 2024 & 2032
5.1.2 Electricity
5.1.3 Coating
5.1.4 Composite Material
5.2 Segment by Application – Global Graphene Nanosheets Revenue & Forecasts
5.2.1 Segment by Application – Global Graphene Nanosheets Revenue, 2020-2025
5.2.2 Segment by Application – Global Graphene Nanosheets Revenue, 2026-2032
5.2.3 Segment by Application – Global Graphene Nanosheets Revenue Market Share, 2020-2032
5.3 Segment by Application – Global Graphene Nanosheets Sales & Forecasts
5.3.1 Segment by Application – Global Graphene Nanosheets Sales, 2020-2025
5.3.2 Segment by Application – Global Graphene Nanosheets Sales, 2026-2032
5.3.3 Segment by Application – Global Graphene Nanosheets Sales Market Share, 2020-2032
5.4 Segment by Application – Global Graphene Nanosheets Price (Manufacturers Selling Prices), 2020-2032
6 Sights by Region
6.1 By Region – Global Graphene Nanosheets Market Size, 2024 & 2032
6.2 By Region – Global Graphene Nanosheets Revenue & Forecasts
6.2.1 By Region – Global Graphene Nanosheets Revenue, 2020-2025
6.2.2 By Region – Global Graphene Nanosheets Revenue, 2026-2032
6.2.3 By Region – Global Graphene Nanosheets Revenue Market Share, 2020-2032
6.3 By Region – Global Graphene Nanosheets Sales & Forecasts
6.3.1 By Region – Global Graphene Nanosheets Sales, 2020-2025
6.3.2 By Region – Global Graphene Nanosheets Sales, 2026-2032
6.3.3 By Region – Global Graphene Nanosheets Sales Market Share, 2020-2032
6.4 North America
6.4.1 By Country – North America Graphene Nanosheets Revenue, 2020-2032
6.4.2 By Country – North America Graphene Nanosheets Sales, 2020-2032
6.4.3 United States Graphene Nanosheets Market Size, 2020-2032
6.4.4 Canada Graphene Nanosheets Market Size, 2020-2032
6.4.5 Mexico Graphene Nanosheets Market Size, 2020-2032
6.5 Europe
6.5.1 By Country – Europe Graphene Nanosheets Revenue, 2020-2032
6.5.2 By Country – Europe Graphene Nanosheets Sales, 2020-2032
6.5.3 Germany Graphene Nanosheets Market Size, 2020-2032
6.5.4 France Graphene Nanosheets Market Size, 2020-2032
6.5.5 U.K. Graphene Nanosheets Market Size, 2020-2032
6.5.6 Italy Graphene Nanosheets Market Size, 2020-2032
6.5.7 Russia Graphene Nanosheets Market Size, 2020-2032
6.5.8 Nordic Countries Graphene Nanosheets Market Size, 2020-2032
6.5.9 Benelux Graphene Nanosheets Market Size, 2020-2032
6.6 Asia
6.6.1 By Region – Asia Graphene Nanosheets Revenue, 2020-2032
6.6.2 By Region – Asia Graphene Nanosheets Sales, 2020-2032
6.6.3 China Graphene Nanosheets Market Size, 2020-2032
6.6.4 Japan Graphene Nanosheets Market Size, 2020-2032
6.6.5 South Korea Graphene Nanosheets Market Size, 2020-2032
6.6.6 Southeast Asia Graphene Nanosheets Market Size, 2020-2032
6.6.7 India Graphene Nanosheets Market Size, 2020-2032
6.7 South America
6.7.1 By Country – South America Graphene Nanosheets Revenue, 2020-2032
6.7.2 By Country – South America Graphene Nanosheets Sales, 2020-2032
6.7.3 Brazil Graphene Nanosheets Market Size, 2020-2032
6.7.4 Argentina Graphene Nanosheets Market Size, 2020-2032
6.8 Middle East & Africa
6.8.1 By Country – Middle East & Africa Graphene Nanosheets Revenue, 2020-2032
6.8.2 By Country – Middle East & Africa Graphene Nanosheets Sales, 2020-2032
6.8.3 Turkey Graphene Nanosheets Market Size, 2020-2032
6.8.4 Israel Graphene Nanosheets Market Size, 2020-2032
6.8.5 Saudi Arabia Graphene Nanosheets Market Size, 2020-2032
6.8.6 UAE Graphene Nanosheets Market Size, 2020-2032
7 Manufacturers & Brands Profiles
7.1 CVD Equipment
7.1.1 CVD Equipment Company Summary
7.1.2 CVD Equipment Business Overview
7.1.3 CVD Equipment Graphene Nanosheets Major Product Offerings
7.1.4 CVD Equipment Graphene Nanosheets Sales and Revenue in Global (2020-2025)
7.1.5 CVD Equipment Key News & Latest Developments
7.2 Cheap Tubes
7.2.1 Cheap Tubes Company Summary
7.2.2 Cheap Tubes Business Overview
7.2.3 Cheap Tubes Graphene Nanosheets Major Product Offerings
7.2.4 Cheap Tubes Graphene Nanosheets Sales and Revenue in Global (2020-2025)
7.2.5 Cheap Tubes Key News & Latest Developments
7.3 Angstron Materials
7.3.1 Angstron Materials Company Summary
7.3.2 Angstron Materials Business Overview
7.3.3 Angstron Materials Graphene Nanosheets Major Product Offerings
7.3.4 Angstron Materials Graphene Nanosheets Sales and Revenue in Global (2020-2025)
7.3.5 Angstron Materials Key News & Latest Developments
7.4 Strem Catalog
7.4.1 Strem Catalog Company Summary
7.4.2 Strem Catalog Business Overview
7.4.3 Strem Catalog Graphene Nanosheets Major Product Offerings
7.4.4 Strem Catalog Graphene Nanosheets Sales and Revenue in Global (2020-2025)
7.4.5 Strem Catalog Key News & Latest Developments
7.5 ACS Material
7.5.1 ACS Material Company Summary
7.5.2 ACS Material Business Overview
7.5.3 ACS Material Graphene Nanosheets Major Product Offerings
7.5.4 ACS Material Graphene Nanosheets Sales and Revenue in Global (2020-2025)
7.5.5 ACS Material Key News & Latest Developments
7.6 Harper International
7.6.1 Harper International Company Summary
7.6.2 Harper International Business Overview
7.6.3 Harper International Graphene Nanosheets Major Product Offerings
7.6.4 Harper International Graphene Nanosheets Sales and Revenue in Global (2020-2025)
7.6.5 Harper International Key News & Latest Developments
7.7 Times Nano
7.7.1 Times Nano Company Summary
7.7.2 Times Nano Business Overview
7.7.3 Times Nano Graphene Nanosheets Major Product Offerings
7.7.4 Times Nano Graphene Nanosheets Sales and Revenue in Global (2020-2025)
7.7.5 Times Nano Key News & Latest Developments
7.8 Garmor
7.8.1 Garmor Company Summary
7.8.2 Garmor Business Overview
7.8.3 Garmor Graphene Nanosheets Major Product Offerings
7.8.4 Garmor Graphene Nanosheets Sales and Revenue in Global (2020-2025)
7.8.5 Garmor Key News & Latest Developments
7.9 Ceal Tech
7.9.1 Ceal Tech Company Summary
7.9.2 Ceal Tech Business Overview
7.9.3 Ceal Tech Graphene Nanosheets Major Product Offerings
7.9.4 Ceal Tech Graphene Nanosheets Sales and Revenue in Global (2020-2025)
7.9.5 Ceal Tech Key News & Latest Developments
7.10 Applied Graphene Materials
7.10.1 Applied Graphene Materials Company Summary
7.10.2 Applied Graphene Materials Business Overview
7.10.3 Applied Graphene Materials Graphene Nanosheets Major Product Offerings
7.10.4 Applied Graphene Materials Graphene Nanosheets Sales and Revenue in Global (2020-2025)
7.10.5 Applied Graphene Materials Key News & Latest Developments
7.11 Thomas Swan
7.11.1 Thomas Swan Company Summary
7.11.2 Thomas Swan Business Overview
7.11.3 Thomas Swan Graphene Nanosheets Major Product Offerings
7.11.4 Thomas Swan Graphene Nanosheets Sales and Revenue in Global (2020-2025)
7.11.5 Thomas Swan Key News & Latest Developments
7.12 Haydale Graphene Industries
7.12.1 Haydale Graphene Industries Company Summary
7.12.2 Haydale Graphene Industries Business Overview
7.12.3 Haydale Graphene Industries Graphene Nanosheets Major Product Offerings
7.12.4 Haydale Graphene Industries Graphene Nanosheets Sales and Revenue in Global (2020-2025)
7.12.5 Haydale Graphene Industries Key News & Latest Developments
7.13 Bluestone Global Tech
7.13.1 Bluestone Global Tech Company Summary
7.13.2 Bluestone Global Tech Business Overview
7.13.3 Bluestone Global Tech Graphene Nanosheets Major Product Offerings
7.13.4 Bluestone Global Tech Graphene Nanosheets Sales and Revenue in Global (2020-2025)
7.13.5 Bluestone Global Tech Key News & Latest Developments
7.14 Group NanoXplore
7.14.1 Group NanoXplore Company Summary
7.14.2 Group NanoXplore Business Overview
7.14.3 Group NanoXplore Graphene Nanosheets Major Product Offerings
7.14.4 Group NanoXplore Graphene Nanosheets Sales and Revenue in Global (2020-2025)
7.14.5 Group NanoXplore Key News & Latest Developments
7.15 Graphenea
7.15.1 Graphenea Company Summary
7.15.2 Graphenea Business Overview
7.15.3 Graphenea Graphene Nanosheets Major Product Offerings
7.15.4 Graphenea Graphene Nanosheets Sales and Revenue in Global (2020-2025)
7.15.5 Graphenea Key News & Latest Developments
7.16 Vorbeck Materials
7.16.1 Vorbeck Materials Company Summary
7.16.2 Vorbeck Materials Business Overview
7.16.3 Vorbeck Materials Graphene Nanosheets Major Product Offerings
7.16.4 Vorbeck Materials Graphene Nanosheets Sales and Revenue in Global (2020-2025)
7.16.5 Vorbeck Materials Key News & Latest Developments
7.17 BGT Materials Limited
7.17.1 BGT Materials Limited Company Summary
7.17.2 BGT Materials Limited Business Overview
7.17.3 BGT Materials Limited Graphene Nanosheets Major Product Offerings
7.17.4 BGT Materials Limited Graphene Nanosheets Sales and Revenue in Global (2020-2025)
7.17.5 BGT Materials Limited Key News & Latest Developments
8 Global Graphene Nanosheets Production Capacity, Analysis
8.1 Global Graphene Nanosheets Production Capacity, 2020-2032
8.2 Graphene Nanosheets Production Capacity of Key Manufacturers in Global Market
8.3 Global Graphene Nanosheets Production by Region
9 Key Market Trends, Opportunity, Drivers and Restraints
9.1 Market Opportunities & Trends
9.2 Market Drivers
9.3 Market Restraints
10 Graphene Nanosheets Supply Chain Analysis
10.1 Graphene Nanosheets Industry Value Chain
10.2 Graphene Nanosheets Upstream Market
10.3 Graphene Nanosheets Downstream and Clients
10.4 Marketing Channels Analysis
10.4.1 Marketing Channels
10.4.2 Graphene Nanosheets Distributors and Sales Agents in Global
11 Conclusion
12 Appendix
12.1 Note
12.2 Examples of Clients
12.3 DisclaimerList of Tables
Table 1. Key Players of Graphene Nanosheets in Global Market
Table 2. Top Graphene Nanosheets Players in Global Market, Ranking by Revenue (2024)
Table 3. Global Graphene Nanosheets Revenue by Companies, (US$, Mn), 2020-2025
Table 4. Global Graphene Nanosheets Revenue Share by Companies, 2020-2025
Table 5. Global Graphene Nanosheets Sales by Companies, (Units), 2020-2025
Table 6. Global Graphene Nanosheets Sales Share by Companies, 2020-2025
Table 7. Key Manufacturers Graphene Nanosheets Price (2020-2025) & (US$/Unit)
Table 8. Global Manufacturers Graphene Nanosheets Product Type
Table 9. List of Global Tier 1 Graphene Nanosheets Companies, Revenue (US$, Mn) in 2024 and Market Share
Table 10. List of Global Tier 2 and Tier 3 Graphene Nanosheets Companies, Revenue (US$, Mn) in 2024 and Market Share
Table 11. Segment by Type – Global Graphene Nanosheets Revenue, (US$, Mn), 2024 & 2032
Table 12. Segment by Type – Global Graphene Nanosheets Revenue (US$, Mn), 2020-2025
Table 13. Segment by Type – Global Graphene Nanosheets Revenue (US$, Mn), 2026-2032
Table 14. Segment by Type – Global Graphene Nanosheets Sales (Units), 2020-2025
Table 15. Segment by Type – Global Graphene Nanosheets Sales (Units), 2026-2032
Table 16. Segment by Application – Global Graphene Nanosheets Revenue, (US$, Mn), 2024 & 2032
Table 17. Segment by Application – Global Graphene Nanosheets Revenue, (US$, Mn), 2020-2025
Table 18. Segment by Application – Global Graphene Nanosheets Revenue, (US$, Mn), 2026-2032
Table 19. Segment by Application – Global Graphene Nanosheets Sales, (Units), 2020-2025
Table 20. Segment by Application – Global Graphene Nanosheets Sales, (Units), 2026-2032
Table 21. By Region – Global Graphene Nanosheets Revenue, (US$, Mn), 2025-2032
Table 22. By Region – Global Graphene Nanosheets Revenue, (US$, Mn), 2020-2025
Table 23. By Region – Global Graphene Nanosheets Revenue, (US$, Mn), 2026-2032
Table 24. By Region – Global Graphene Nanosheets Sales, (Units), 2020-2025
Table 25. By Region – Global Graphene Nanosheets Sales, (Units), 2026-2032
Table 26. By Country – North America Graphene Nanosheets Revenue, (US$, Mn), 2020-2025
Table 27. By Country – North America Graphene Nanosheets Revenue, (US$, Mn), 2026-2032
Table 28. By Country – North America Graphene Nanosheets Sales, (Units), 2020-2025
Table 29. By Country – North America Graphene Nanosheets Sales, (Units), 2026-2032
Table 30. By Country – Europe Graphene Nanosheets Revenue, (US$, Mn), 2020-2025
Table 31. By Country – Europe Graphene Nanosheets Revenue, (US$, Mn), 2026-2032
Table 32. By Country – Europe Graphene Nanosheets Sales, (Units), 2020-2025
Table 33. By Country – Europe Graphene Nanosheets Sales, (Units), 2026-2032
Table 34. By Region – Asia Graphene Nanosheets Revenue, (US$, Mn), 2020-2025
Table 35. By Region – Asia Graphene Nanosheets Revenue, (US$, Mn), 2026-2032
Table 36. By Region – Asia Graphene Nanosheets Sales, (Units), 2020-2025
Table 37. By Region – Asia Graphene Nanosheets Sales, (Units), 2026-2032
Table 38. By Country – South America Graphene Nanosheets Revenue, (US$, Mn), 2020-2025
Table 39. By Country – South America Graphene Nanosheets Revenue, (US$, Mn), 2026-2032
Table 40. By Country – South America Graphene Nanosheets Sales, (Units), 2020-2025
Table 41. By Country – South America Graphene Nanosheets Sales, (Units), 2026-2032
Table 42. By Country – Middle East & Africa Graphene Nanosheets Revenue, (US$, Mn), 2020-2025
Table 43. By Country – Middle East & Africa Graphene Nanosheets Revenue, (US$, Mn), 2026-2032
Table 44. By Country – Middle East & Africa Graphene Nanosheets Sales, (Units), 2020-2025
Table 45. By Country – Middle East & Africa Graphene Nanosheets Sales, (Units), 2026-2032
Table 46. CVD Equipment Company Summary
Table 47. CVD Equipment Graphene Nanosheets Product Offerings
Table 48. CVD Equipment Graphene Nanosheets Sales (Units), Revenue (US$, Mn) and Average Price (US$/Unit) & (2020-2025)
Table 49. CVD Equipment Key News & Latest Developments
Table 50. Cheap Tubes Company Summary
Table 51. Cheap Tubes Graphene Nanosheets Product Offerings
Table 52. Cheap Tubes Graphene Nanosheets Sales (Units), Revenue (US$, Mn) and Average Price (US$/Unit) & (2020-2025)
Table 53. Cheap Tubes Key News & Latest Developments
Table 54. Angstron Materials Company Summary
Table 55. Angstron Materials Graphene Nanosheets Product Offerings
Table 56. Angstron Materials Graphene Nanosheets Sales (Units), Revenue (US$, Mn) and Average Price (US$/Unit) & (2020-2025)
Table 57. Angstron Materials Key News & Latest Developments
Table 58. Strem Catalog Company Summary
Table 59. Strem Catalog Graphene Nanosheets Product Offerings
Table 60. Strem Catalog Graphene Nanosheets Sales (Units), Revenue (US$, Mn) and Average Price (US$/Unit) & (2020-2025)
Table 61. Strem Catalog Key News & Latest Developments
Table 62. ACS Material Company Summary
Table 63. ACS Material Graphene Nanosheets Product Offerings
Table 64. ACS Material Graphene Nanosheets Sales (Units), Revenue (US$, Mn) and Average Price (US$/Unit) & (2020-2025)
Table 65. ACS Material Key News & Latest Developments
Table 66. Harper International Company Summary
Table 67. Harper International Graphene Nanosheets Product Offerings
Table 68. Harper International Graphene Nanosheets Sales (Units), Revenue (US$, Mn) and Average Price (US$/Unit) & (2020-2025)
Table 69. Harper International Key News & Latest Developments
Table 70. Times Nano Company Summary
Table 71. Times Nano Graphene Nanosheets Product Offerings
Table 72. Times Nano Graphene Nanosheets Sales (Units), Revenue (US$, Mn) and Average Price (US$/Unit) & (2020-2025)
Table 73. Times Nano Key News & Latest Developments
Table 74. Garmor Company Summary
Table 75. Garmor Graphene Nanosheets Product Offerings
Table 76. Garmor Graphene Nanosheets Sales (Units), Revenue (US$, Mn) and Average Price (US$/Unit) & (2020-2025)
Table 77. Garmor Key News & Latest Developments
Table 78. Ceal Tech Company Summary
Table 79. Ceal Tech Graphene Nanosheets Product Offerings
Table 80. Ceal Tech Graphene Nanosheets Sales (Units), Revenue (US$, Mn) and Average Price (US$/Unit) & (2020-2025)
Table 81. Ceal Tech Key News & Latest Developments
Table 82. Applied Graphene Materials Company Summary
Table 83. Applied Graphene Materials Graphene Nanosheets Product Offerings
Table 84. Applied Graphene Materials Graphene Nanosheets Sales (Units), Revenue (US$, Mn) and Average Price (US$/Unit) & (2020-2025)
Table 85. Applied Graphene Materials Key News & Latest Developments
Table 86. Thomas Swan Company Summary
Table 87. Thomas Swan Graphene Nanosheets Product Offerings
Table 88. Thomas Swan Graphene Nanosheets Sales (Units), Revenue (US$, Mn) and Average Price (US$/Unit) & (2020-2025)
Table 89. Thomas Swan Key News & Latest Developments
Table 90. Haydale Graphene Industries Company Summary
Table 91. Haydale Graphene Industries Graphene Nanosheets Product Offerings
Table 92. Haydale Graphene Industries Graphene Nanosheets Sales (Units), Revenue (US$, Mn) and Average Price (US$/Unit) & (2020-2025)
Table 93. Haydale Graphene Industries Key News & Latest Developments
Table 94. Bluestone Global Tech Company Summary
Table 95. Bluestone Global Tech Graphene Nanosheets Product Offerings
Table 96. Bluestone Global Tech Graphene Nanosheets Sales (Units), Revenue (US$, Mn) and Average Price (US$/Unit) & (2020-2025)
Table 97. Bluestone Global Tech Key News & Latest Developments
Table 98. Group NanoXplore Company Summary
Table 99. Group NanoXplore Graphene Nanosheets Product Offerings
Table 100. Group NanoXplore Graphene Nanosheets Sales (Units), Revenue (US$, Mn) and Average Price (US$/Unit) & (2020-2025)
Table 101. Group NanoXplore Key News & Latest Developments
Table 102. Graphenea Company Summary
Table 103. Graphenea Graphene Nanosheets Product Offerings
Table 104. Graphenea Graphene Nanosheets Sales (Units), Revenue (US$, Mn) and Average Price (US$/Unit) & (2020-2025)
Table 105. Graphenea Key News & Latest Developments
Table 106. Vorbeck Materials Company Summary
Table 107. Vorbeck Materials Graphene Nanosheets Product Offerings
Table 108. Vorbeck Materials Graphene Nanosheets Sales (Units), Revenue (US$, Mn) and Average Price (US$/Unit) & (2020-2025)
Table 109. Vorbeck Materials Key News & Latest Developments
Table 110. BGT Materials Limited Company Summary
Table 111. BGT Materials Limited Graphene Nanosheets Product Offerings
Table 112. BGT Materials Limited Graphene Nanosheets Sales (Units), Revenue (US$, Mn) and Average Price (US$/Unit) & (2020-2025)
Table 113. BGT Materials Limited Key News & Latest Developments
Table 114. Graphene Nanosheets Capacity of Key Manufacturers in Global Market, 2023-2025 (Units)
Table 115. Global Graphene Nanosheets Capacity Market Share of Key Manufacturers, 2023-2025
Table 116. Global Graphene Nanosheets Production by Region, 2020-2025 (Units)
Table 117. Global Graphene Nanosheets Production by Region, 2026-2032 (Units)
Table 118. Graphene Nanosheets Market Opportunities & Trends in Global Market
Table 119. Graphene Nanosheets Market Drivers in Global Market
Table 120. Graphene Nanosheets Market Restraints in Global Market
Table 121. Graphene Nanosheets Raw Materials
Table 122. Graphene Nanosheets Raw Materials Suppliers in Global Market
Table 123. Typical Graphene Nanosheets Downstream
Table 124. Graphene Nanosheets Downstream Clients in Global Market
Table 125. Graphene Nanosheets Distributors and Sales Agents in Global Market

List of Figures
Figure 1. Graphene Nanosheets Product Picture
Figure 2. Graphene Nanosheets Segment by Type in 2024
Figure 3. Graphene Nanosheets Segment by Application in 2024
Figure 4. Global Graphene Nanosheets Market Overview: 2024
Figure 5. Key Caveats
Figure 6. Global Graphene Nanosheets Market Size: 2024 VS 2032 (US$, Mn)
Figure 7. Global Graphene Nanosheets Revenue: 2020-2032 (US$, Mn)
Figure 8. Graphene Nanosheets Sales in Global Market: 2020-2032 (Units)
Figure 9. The Top 3 and 5 Players Market Share by Graphene Nanosheets Revenue in 2024
Figure 10. Segment by Type – Global Graphene Nanosheets Revenue, (US$, Mn), 2024 & 2032
Figure 11. Segment by Type – Global Graphene Nanosheets Revenue Market Share, 2020-2032
Figure 12. Segment by Type – Global Graphene Nanosheets Sales Market Share, 2020-2032
Figure 13. Segment by Type – Global Graphene Nanosheets Price (US$/Unit), 2020-2032
Figure 14. Segment by Application – Global Graphene Nanosheets Revenue, (US$, Mn), 2024 & 2032
Figure 15. Segment by Application – Global Graphene Nanosheets Revenue Market Share, 2020-2032
Figure 16. Segment by Application – Global Graphene Nanosheets Sales Market Share, 2020-2032
Figure 17. Segment by Application -Global Graphene Nanosheets Price (US$/Unit), 2020-2032
Figure 18. By Region – Global Graphene Nanosheets Revenue, (US$, Mn), 2025 & 2032
Figure 19. By Region – Global Graphene Nanosheets Revenue Market Share, 2020 VS 2024 VS 2032
Figure 20. By Region – Global Graphene Nanosheets Revenue Market Share, 2020-2032
Figure 21. By Region – Global Graphene Nanosheets Sales Market Share, 2020-2032
Figure 22. By Country – North America Graphene Nanosheets Revenue Market Share, 2020-2032
Figure 23. By Country – North America Graphene Nanosheets Sales Market Share, 2020-2032
Figure 24. United States Graphene Nanosheets Revenue, (US$, Mn), 2020-2032
Figure 25. Canada Graphene Nanosheets Revenue, (US$, Mn), 2020-2032
Figure 26. Mexico Graphene Nanosheets Revenue, (US$, Mn), 2020-2032
Figure 27. By Country – Europe Graphene Nanosheets Revenue Market Share, 2020-2032
Figure 28. By Country – Europe Graphene Nanosheets Sales Market Share, 2020-2032
Figure 29. Germany Graphene Nanosheets Revenue, (US$, Mn), 2020-2032
Figure 30. France Graphene Nanosheets Revenue, (US$, Mn), 2020-2032
Figure 31. U.K. Graphene Nanosheets Revenue, (US$, Mn), 2020-2032
Figure 32. Italy Graphene Nanosheets Revenue, (US$, Mn), 2020-2032
Figure 33. Russia Graphene Nanosheets Revenue, (US$, Mn), 2020-2032
Figure 34. Nordic Countries Graphene Nanosheets Revenue, (US$, Mn), 2020-2032
Figure 35. Benelux Graphene Nanosheets Revenue, (US$, Mn), 2020-2032
Figure 36. By Region – Asia Graphene Nanosheets Revenue Market Share, 2020-2032
Figure 37. By Region – Asia Graphene Nanosheets Sales Market Share, 2020-2032
Figure 38. China Graphene Nanosheets Revenue, (US$, Mn), 2020-2032
Figure 39. Japan Graphene Nanosheets Revenue, (US$, Mn), 2020-2032
Figure 40. South Korea Graphene Nanosheets Revenue, (US$, Mn), 2020-2032
Figure 41. Southeast Asia Graphene Nanosheets Revenue, (US$, Mn), 2020-2032
Figure 42. India Graphene Nanosheets Revenue, (US$, Mn), 2020-2032
Figure 43. By Country – South America Graphene Nanosheets Revenue Market Share, 2020-2032
Figure 44. By Country – South America Graphene Nanosheets Sales, Market Share, 2020-2032
Figure 45. Brazil Graphene Nanosheets Revenue, (US$, Mn), 2020-2032
Figure 46. Argentina Graphene Nanosheets Revenue, (US$, Mn), 2020-2032
Figure 47. By Country – Middle East & Africa Graphene Nanosheets Revenue, Market Share, 2020-2032
Figure 48. By Country – Middle East & Africa Graphene Nanosheets Sales, Market Share, 2020-2032
Figure 49. Turkey Graphene Nanosheets Revenue, (US$, Mn), 2020-2032
Figure 50. Israel Graphene Nanosheets Revenue, (US$, Mn), 2020-2032
Figure 51. Saudi Arabia Graphene Nanosheets Revenue, (US$, Mn), 2020-2032
Figure 52. UAE Graphene Nanosheets Revenue, (US$, Mn), 2020-2032
Figure 53. Global Graphene Nanosheets Production Capacity (Units), 2020-2032
Figure 54. The Percentage of Production Graphene Nanosheets by Region, 2024 VS 2032
Figure 55. Graphene Nanosheets Industry Value Chain
Figure 56. Marketing Channels