Gold Etchant Market Trends, Business Strategies 2025-2032

Global Gold Etchant market size was estimated at USD 15 million in 2023 and is projected to reach USD 17.93 million by 2032, exhibiting a CAGR of 2.00% during the forecast period.

PDF Icon Download Sample Report PDF
  • Quick Dispatch

    All Orders

  • Secure Payment

    100% Secure Payment

Compare

$1,500.00$4,250.00

Clear

Gold Etchant Market Overview

Gold Etchants are etching solutions designed specifically for etching thin films of gold in the fabrication of semiconductor devices and thin film microelectronics. The solutions are based on potassium iodide and iodine (KI/I2) chemistry and do not contain cyanide. They are compatible with both positive and negative photoresist materials, giving controllable line definition.

This report provides a deep insight into the global Gold Etchant Market market covering all its essential aspects. This ranges from a macro overview of the market to micro details of the market size, competitive landscape, development trend, niche market, key market drivers and challenges, SWOT analysis, value chain analysis, etc.

The analysis helps the reader to shape the competition within the industries and strategies for the competitive environment to enhance the potential profit. Furthermore, it provides a simple framework for evaluating and accessing the position of the business organization. The report structure also focuses on the competitive landscape of the Global Gold Etchant Market Market, this report introduces in detail the market share, market performance, product situation, operation situation, etc. of the main players, which helps the readers in the industry to identify the main competitors and deeply understand the competition pattern of the market.
In a word, this report is a must-read for industry players, investors, researchers, consultants, business strategists, and all those who have any kind of stake or are planning to foray into the Gold Etchant Market market in any manner.

Gold Etchant Market Analysis:

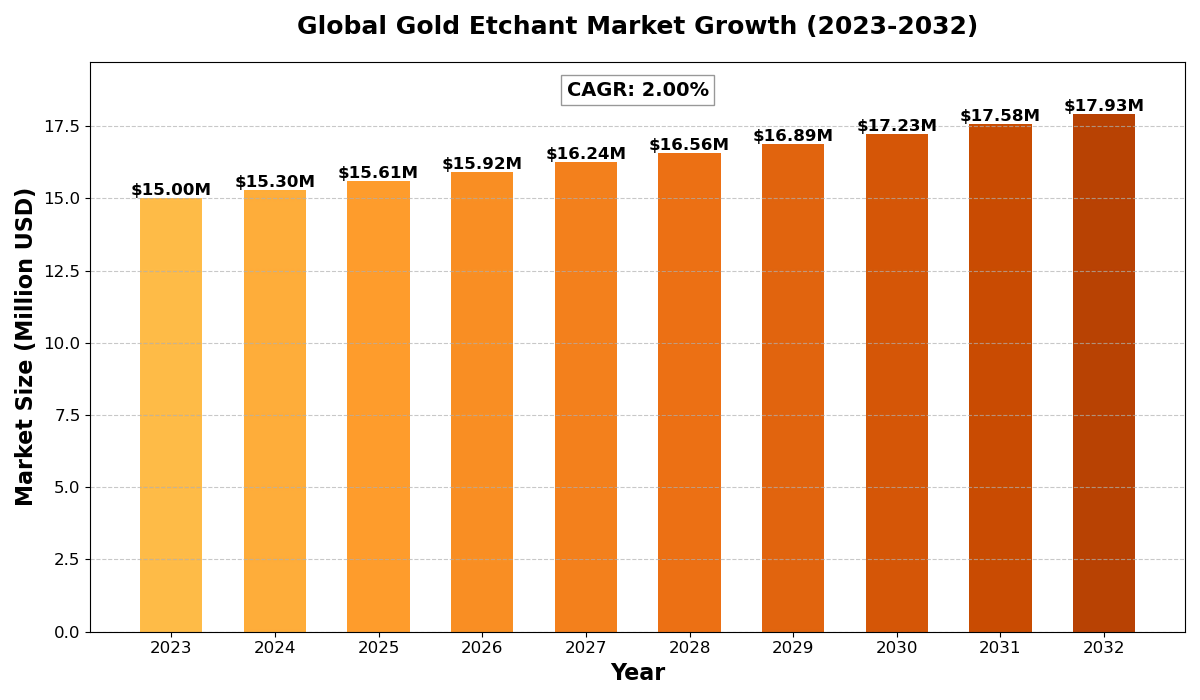
The global Gold Etchant market size was estimated at USD 15 million in 2023 and is projected to reach USD 17.93 million by 2032, exhibiting a CAGR of 2.00% during the forecast period.

North America Gold Etchant market size was estimated at USD 4.04 million in 2023, at a CAGR of 1.71% during the forecast period of 2025 through 2032.

Gold Etchant Key Market Trends  :

  1. Growing Demand in Semiconductor Manufacturing
    The increasing production of high-performance semiconductors and microchips is driving the need for precise gold etching solutions.

  2. Advancements in MEMS and Nanotechnology
    The rise of MEMS devices and nanoscale electronics is pushing innovation in highly selective and controlled gold etchants.

  3. Shift Toward Environmentally Friendly Etchants
    Researchers and manufacturers are developing eco-friendly, non-toxic etchants to reduce environmental impact and comply with regulations.

  4. Expansion in PCB Manufacturing
    The demand for high-density interconnect (HDI) PCBs in smartphones, wearables, and automotive electronics is increasing gold etchant usage.

  5. Increasing Use in Optoelectronics and Aerospace
    Gold etchants are gaining importance in the fabrication of optical devices, satellites, and defense electronics due to their high precision and reliability.

Gold Etchant Market Regional Analysis :

semi insight

  • North America:Strong demand driven by EVs, 5G infrastructure, and renewable energy, with the U.S. leading the market.
  • Europe:Growth fueled by automotive electrification, renewable energy, and strong regulatory support, with Germany as a key player.
  • Asia-Pacific:Dominates the market due to large-scale manufacturing in China and Japan, with growing demand from EVs, 5G, and semiconductors.
  • South America:Emerging market, driven by renewable energy and EV adoption, with Brazil leading growth.
  • Middle East & Africa:Gradual growth, mainly due to investments in renewable energy and EV infrastructure, with Saudi Arabia and UAE as key contributors.

Gold Etchant Market Segmentation :

The research report includes specific segments by region (country), manufacturers, Type, and Application. Market segmentation creates subsets of a market based on product type, end-user or application, Geographic, and other factors. By understanding the market segments, the decision-maker can leverage this targeting in the product, sales, and marketing strategies. Market segments can power your product development cycles by informing how you create product offerings for different segments.

Key Company

  • Transene
  • Kanto Chemical
  • Technic
  • NB Technologies
  • Chemleader
  • Solexir
  • Jiangyin Jianghua Microelectronics Materials
  • Runma Chemical
  • Zhejiang Shangneng Industrial

Market Segmentation (by Type)

  • Iodine Series
  • Nitric Acid

Market Segmentation (by Application)

  • Optoelectronics Industry
  • Microelectronic Circuits

Drivers

  • Rising Demand for High-Precision Electronics
    As semiconductor and PCB technologies advance, the need for precise and reliable gold etching processes is increasing.

  • Miniaturization of Electronic Devices
    Smaller and more powerful devices require ultra-fine etching capabilities, boosting the demand for high-purity gold etchants.

  • Expansion of the 5G and IoT Ecosystem
    The development of 5G networks and IoT devices is driving investments in high-performance circuit fabrication.

Restraints

  • High Costs of Gold and Specialized Etchants
    The fluctuating price of gold and the cost of specialized etching solutions can impact production expenses.

  • Stringent Environmental and Safety Regulations
    Regulations on chemical waste disposal and hazardous material handling pose challenges for manufacturers.

  • Complex Manufacturing and Handling Requirements
    The use of gold etchants requires precise handling and process control, increasing operational complexity.

Opportunities

  • Development of Sustainable and Non-Toxic Etchants
    Innovations in green chemistry are creating opportunities for safer and environmentally friendly etching solutions.

  • Growth in Advanced Packaging Technologies
    The rise of chiplet-based architectures and advanced semiconductor packaging is driving new applications for gold etchants.

  • Expanding Aerospace and Defense Electronics Sector
    Increased investment in aerospace and military-grade electronics is fueling demand for high-reliability gold etching solutions.

Challenges

  • Supply Chain Disruptions for Key Raw Materials
    Shortages and price fluctuations in gold and etching chemicals can impact market stability.

  • Competition from Alternative Etching Technologies
    Laser and plasma etching techniques are evolving, offering potential alternatives to chemical etchants.

  • Regulatory Compliance and Waste Disposal Costs
    Strict environmental guidelines add to the costs of manufacturing and disposing of gold etchants.

Key Benefits of This Market Research:

  • Industry drivers, restraints, and opportunities covered in the study
  • Neutral perspective on the market performance
  • Recent industry trends and developments
  • Competitive landscape & strategies of key players
  • Potential & niche segments and regions exhibiting promising growth covered
  • Historical, current, and projected market size, in terms of value
  • In-depth analysis of the Gold Etchant Market Market
  • Overview of the regional outlook of the Gold Etchant Market Market:

Key Reasons to Buy this Report:

  • Access to date statistics compiled by our researchers. These provide you with historical and forecast data, which is analyzed to tell you why your market is set to change
  • This enables you to anticipate market changes to remain ahead of your competitors
  • You will be able to copy data from the Excel spreadsheet straight into your marketing plans, business presentations, or other strategic documents
  • The concise analysis, clear graph, and table format will enable you to pinpoint the information you require quickly
  • Provision of market value data for each segment and sub-segment
  • Indicates the region and segment that is expected to witness the fastest growth as well as to dominate the market
  • Provides insight into the market through Value Chain
  • Market dynamics scenario, along with growth opportunities of the market in the years to come
  • 6-month post-sales analyst support

Customization of the Report
In case of any queries or customization requirements, please connect with our sales team, who will ensure that your requirements are met.

FAQs

Q: What are the key driving factors and opportunities in the gold etchant market?
A: The market is driven by increasing semiconductor demand, PCB manufacturing, and miniaturization trends. Opportunities exist in green etchant development and aerospace applications.


Q: Which region is projected to have the largest market share?
A: Asia-Pacific is expected to dominate due to strong semiconductor and electronics manufacturing hubs in China, Japan, and South Korea.


Q: Who are the top players in the global gold etchant market?
A: Key companies include Transene Company, Kanto Chemical, Mitsubishi Gas Chemical, Avantor, and Entegris, among others.


Q: What are the latest technological advancements in the industry?
A: Innovations include eco-friendly etchants, improved selectivity for fine-line etching, and automated process integration in semiconductor fabs.


Q: What is the current size of the global gold etchant market?
A: The market is projected to grow steadily from 2025 to 2032, driven by advancements in electronics, MEMS, and optoelectronics.

Gold Etchant Market Trends, Business Strategies 2025-2032

Get Sample Report PDF for Exclusive Insights

Report Sample Includes

  • Table of Contents
  • List of Tables & Figures
  • Charts, Research Methodology, and more...
PDF Icon Download Sample Report PDF

Download Sample Report

Table of Content

Table of Contents
1 Research Methodology and Statistical Scope
1.1 Market Definition and Statistical Scope of Gold Etchant
1.2 Key Market Segments
1.2.1 Gold Etchant Segment by Type
1.2.2 Gold Etchant Segment by Application
1.3 Methodology & Sources of Information
1.3.1 Research Methodology
1.3.2 Research Process
1.3.3 Market Breakdown and Data Triangulation
1.3.4 Base Year
1.3.5 Report Assumptions & Caveats
2 Gold Etchant Market Overview
2.1 Global Market Overview
2.1.1 Global Gold Etchant Market Size (M USD) Estimates and Forecasts (2019-2032)
2.1.2 Global Gold Etchant Sales Estimates and Forecasts (2019-2032)
2.2 Market Segment Executive Summary
2.3 Global Market Size by Region
3 Gold Etchant Market Competitive Landscape
3.1 Global Gold Etchant Sales by Manufacturers (2019-2025)
3.2 Global Gold Etchant Revenue Market Share by Manufacturers (2019-2025)
3.3 Gold Etchant Market Share by Company Type (Tier 1, Tier 2, and Tier 3)
3.4 Global Gold Etchant Average Price by Manufacturers (2019-2025)
3.5 Manufacturers Gold Etchant Sales Sites, Area Served, Product Type
3.6 Gold Etchant Market Competitive Situation and Trends
3.6.1 Gold Etchant Market Concentration Rate
3.6.2 Global 5 and 10 Largest Gold Etchant Players Market Share by Revenue
3.6.3 Mergers & Acquisitions, Expansion
4 Gold Etchant Industry Chain Analysis
4.1 Gold Etchant Industry Chain Analysis
4.2 Market Overview of Key Raw Materials
4.3 Midstream Market Analysis
4.4 Downstream Customer Analysis
5 The Development and Dynamics of Gold Etchant Market
5.1 Key Development Trends
5.2 Driving Factors
5.3 Market Challenges
5.4 Market Restraints
5.5 Industry News
5.5.1 New Product Developments
5.5.2 Mergers & Acquisitions
5.5.3 Expansions
5.5.4 Collaboration/Supply Contracts
5.6 Industry Policies
6 Gold Etchant Market Segmentation by Type
6.1 Evaluation Matrix of Segment Market Development Potential (Type)
6.2 Global Gold Etchant Sales Market Share by Type (2019-2025)
6.3 Global Gold Etchant Market Size Market Share by Type (2019-2025)
6.4 Global Gold Etchant Price by Type (2019-2025)
7 Gold Etchant Market Segmentation by Application
7.1 Evaluation Matrix of Segment Market Development Potential (Application)
7.2 Global Gold Etchant Market Sales by Application (2019-2025)
7.3 Global Gold Etchant Market Size (M USD) by Application (2019-2025)
7.4 Global Gold Etchant Sales Growth Rate by Application (2019-2025)
8 Gold Etchant Market Consumption by Region
8.1 Global Gold Etchant Sales by Region
8.1.1 Global Gold Etchant Sales by Region
8.1.2 Global Gold Etchant Sales Market Share by Region
8.2 North America
8.2.1 North America Gold Etchant Sales by Country
8.2.2 U.S.
8.2.3 Canada
8.2.4 Mexico
8.3 Europe
8.3.1 Europe Gold Etchant Sales by Country
8.3.2 Germany
8.3.3 France
8.3.4 U.K.
8.3.5 Italy
8.3.6 Russia
8.4 Asia Pacific
8.4.1 Asia Pacific Gold Etchant Sales by Region
8.4.2 China
8.4.3 Japan
8.4.4 South Korea
8.4.5 India
8.4.6 Southeast Asia
8.5 South America
8.5.1 South America Gold Etchant Sales by Country
8.5.2 Brazil
8.5.3 Argentina
8.5.4 Columbia
8.6 Middle East and Africa
8.6.1 Middle East and Africa Gold Etchant Sales by Region
8.6.2 Saudi Arabia
8.6.3 UAE
8.6.4 Egypt
8.6.5 Nigeria
8.6.6 South Africa
9 Gold Etchant Market Production by Region
9.1 Global Production of Gold Etchant by Region (2019-2025)
9.2 Global Gold Etchant Revenue Market Share by Region (2019-2025)
9.3 Global Gold Etchant Production, Revenue, Price and Gross Margin (2019-2025)
9.4 North America Gold Etchant Production
9.4.1 North America Gold Etchant Production Growth Rate (2019-2025)
9.4.2 North America Gold Etchant Production, Revenue, Price and Gross Margin (2019-2025)
9.5 Europe Gold Etchant Production
9.5.1 Europe Gold Etchant Production Growth Rate (2019-2025)
9.5.2 Europe Gold Etchant Production, Revenue, Price and Gross Margin (2019-2025)
9.6 Japan Gold Etchant Production (2019-2025)
9.6.1 Japan Gold Etchant Production Growth Rate (2019-2025)
9.6.2 Japan Gold Etchant Production, Revenue, Price and Gross Margin (2019-2025)
9.7 China Gold Etchant Production (2019-2025)
9.7.1 China Gold Etchant Production Growth Rate (2019-2025)
9.7.2 China Gold Etchant Production, Revenue, Price and Gross Margin (2019-2025)
10 Key Companies Profile
10.1 Transene
10.1.1 Transene Gold Etchant Basic Information
10.1.2 Transene Gold Etchant Product Overview
10.1.3 Transene Gold Etchant Product Market Performance
10.1.4 Transene Business Overview
10.1.5 Transene Gold Etchant SWOT Analysis
10.1.6 Transene Recent Developments
10.2 Kanto Chemical
10.2.1 Kanto Chemical Gold Etchant Basic Information
10.2.2 Kanto Chemical Gold Etchant Product Overview
10.2.3 Kanto Chemical Gold Etchant Product Market Performance
10.2.4 Kanto Chemical Business Overview
10.2.5 Kanto Chemical Gold Etchant SWOT Analysis
10.2.6 Kanto Chemical Recent Developments
10.3 Technic
10.3.1 Technic Gold Etchant Basic Information
10.3.2 Technic Gold Etchant Product Overview
10.3.3 Technic Gold Etchant Product Market Performance
10.3.4 Technic Gold Etchant SWOT Analysis
10.3.5 Technic Business Overview
10.3.6 Technic Recent Developments
10.4 NB Technologies
10.4.1 NB Technologies Gold Etchant Basic Information
10.4.2 NB Technologies Gold Etchant Product Overview
10.4.3 NB Technologies Gold Etchant Product Market Performance
10.4.4 NB Technologies Business Overview
10.4.5 NB Technologies Recent Developments
10.5 Chemleader
10.5.1 Chemleader Gold Etchant Basic Information
10.5.2 Chemleader Gold Etchant Product Overview
10.5.3 Chemleader Gold Etchant Product Market Performance
10.5.4 Chemleader Business Overview
10.5.5 Chemleader Recent Developments
10.6 Solexir
10.6.1 Solexir Gold Etchant Basic Information
10.6.2 Solexir Gold Etchant Product Overview
10.6.3 Solexir Gold Etchant Product Market Performance
10.6.4 Solexir Business Overview
10.6.5 Solexir Recent Developments
10.7 Jiangyin Jianghua Microelectronics Materials
10.7.1 Jiangyin Jianghua Microelectronics Materials Gold Etchant Basic Information
10.7.2 Jiangyin Jianghua Microelectronics Materials Gold Etchant Product Overview
10.7.3 Jiangyin Jianghua Microelectronics Materials Gold Etchant Product Market Performance
10.7.4 Jiangyin Jianghua Microelectronics Materials Business Overview
10.7.5 Jiangyin Jianghua Microelectronics Materials Recent Developments
10.8 Runma Chemical
10.8.1 Runma Chemical Gold Etchant Basic Information
10.8.2 Runma Chemical Gold Etchant Product Overview
10.8.3 Runma Chemical Gold Etchant Product Market Performance
10.8.4 Runma Chemical Business Overview
10.8.5 Runma Chemical Recent Developments
10.9 Zhejiang Shangneng Industrial
10.9.1 Zhejiang Shangneng Industrial Gold Etchant Basic Information
10.9.2 Zhejiang Shangneng Industrial Gold Etchant Product Overview
10.9.3 Zhejiang Shangneng Industrial Gold Etchant Product Market Performance
10.9.4 Zhejiang Shangneng Industrial Business Overview
10.9.5 Zhejiang Shangneng Industrial Recent Developments
11 Gold Etchant Market Forecast by Region
11.1 Global Gold Etchant Market Size Forecast
11.2 Global Gold Etchant Market Forecast by Region
11.2.1 North America Market Size Forecast by Country
11.2.2 Europe Gold Etchant Market Size Forecast by Country
11.2.3 Asia Pacific Gold Etchant Market Size Forecast by Region
11.2.4 South America Gold Etchant Market Size Forecast by Country
11.2.5 Middle East and Africa Forecasted Consumption of Gold Etchant by Country
12 Forecast Market by Type and by Application (2025-2032)
12.1 Global Gold Etchant Market Forecast by Type (2025-2032)
12.1.1 Global Forecasted Sales of Gold Etchant by Type (2025-2032)
12.1.2 Global Gold Etchant Market Size Forecast by Type (2025-2032)
12.1.3 Global Forecasted Price of Gold Etchant by Type (2025-2032)
12.2 Global Gold Etchant Market Forecast by Application (2025-2032)
12.2.1 Global Gold Etchant Sales (K Units) Forecast by Application
12.2.2 Global Gold Etchant Market Size (M USD) Forecast by Application (2025-2032)
13 Conclusion and Key FindingsList of Tables
Table 1. Introduction of the Type
Table 2. Introduction of the Application
Table 3. Market Size (M USD) Segment Executive Summary
Table 4. Gold Etchant Market Size Comparison by Region (M USD)
Table 5. Global Gold Etchant Sales (K Units) by Manufacturers (2019-2025)
Table 6. Global Gold Etchant Sales Market Share by Manufacturers (2019-2025)
Table 7. Global Gold Etchant Revenue (M USD) by Manufacturers (2019-2025)
Table 8. Global Gold Etchant Revenue Share by Manufacturers (2019-2025)
Table 9. Company Type (Tier 1, Tier 2, and Tier 3) & (based on the Revenue in Gold Etchant as of 2022)
Table 10. Global Market Gold Etchant Average Price (USD/Unit) of Key Manufacturers (2019-2025)
Table 11. Manufacturers Gold Etchant Sales Sites and Area Served
Table 12. Manufacturers Gold Etchant Product Type
Table 13. Global Gold Etchant Manufacturers Market Concentration Ratio (CR5 and HHI)
Table 14. Mergers & Acquisitions, Expansion Plans
Table 15. Industry Chain Map of Gold Etchant
Table 16. Market Overview of Key Raw Materials
Table 17. Midstream Market Analysis
Table 18. Downstream Customer Analysis
Table 19. Key Development Trends
Table 20. Driving Factors
Table 21. Gold Etchant Market Challenges
Table 22. Global Gold Etchant Sales by Type (K Units)
Table 23. Global Gold Etchant Market Size by Type (M USD)
Table 24. Global Gold Etchant Sales (K Units) by Type (2019-2025)
Table 25. Global Gold Etchant Sales Market Share by Type (2019-2025)
Table 26. Global Gold Etchant Market Size (M USD) by Type (2019-2025)
Table 27. Global Gold Etchant Market Size Share by Type (2019-2025)
Table 28. Global Gold Etchant Price (USD/Unit) by Type (2019-2025)
Table 29. Global Gold Etchant Sales (K Units) by Application
Table 30. Global Gold Etchant Market Size by Application
Table 31. Global Gold Etchant Sales by Application (2019-2025) & (K Units)
Table 32. Global Gold Etchant Sales Market Share by Application (2019-2025)
Table 33. Global Gold Etchant Sales by Application (2019-2025) & (M USD)
Table 34. Global Gold Etchant Market Share by Application (2019-2025)
Table 35. Global Gold Etchant Sales Growth Rate by Application (2019-2025)
Table 36. Global Gold Etchant Sales by Region (2019-2025) & (K Units)
Table 37. Global Gold Etchant Sales Market Share by Region (2019-2025)
Table 38. North America Gold Etchant Sales by Country (2019-2025) & (K Units)
Table 39. Europe Gold Etchant Sales by Country (2019-2025) & (K Units)
Table 40. Asia Pacific Gold Etchant Sales by Region (2019-2025) & (K Units)
Table 41. South America Gold Etchant Sales by Country (2019-2025) & (K Units)
Table 42. Middle East and Africa Gold Etchant Sales by Region (2019-2025) & (K Units)
Table 43. Global Gold Etchant Production (K Units) by Region (2019-2025)
Table 44. Global Gold Etchant Revenue (US$ Million) by Region (2019-2025)
Table 45. Global Gold Etchant Revenue Market Share by Region (2019-2025)
Table 46. Global Gold Etchant Production (K Units), Revenue (US$ Million), Price (USD/Unit) and Gross Margin (2019-2025)
Table 47. North America Gold Etchant Production (K Units), Revenue (US$ Million), Price (USD/Unit) and Gross Margin (2019-2025)
Table 48. Europe Gold Etchant Production (K Units), Revenue (US$ Million), Price (USD/Unit) and Gross Margin (2019-2025)
Table 49. Japan Gold Etchant Production (K Units), Revenue (US$ Million), Price (USD/Unit) and Gross Margin (2019-2025)
Table 50. China Gold Etchant Production (K Units), Revenue (US$ Million), Price (USD/Unit) and Gross Margin (2019-2025)
Table 51. Transene Gold Etchant Basic Information
Table 52. Transene Gold Etchant Product Overview
Table 53. Transene Gold Etchant Sales (K Units), Revenue (M USD), Price (USD/Unit) and Gross Margin (2019-2025)
Table 54. Transene Business Overview
Table 55. Transene Gold Etchant SWOT Analysis
Table 56. Transene Recent Developments
Table 57. Kanto Chemical Gold Etchant Basic Information
Table 58. Kanto Chemical Gold Etchant Product Overview
Table 59. Kanto Chemical Gold Etchant Sales (K Units), Revenue (M USD), Price (USD/Unit) and Gross Margin (2019-2025)
Table 60. Kanto Chemical Business Overview
Table 61. Kanto Chemical Gold Etchant SWOT Analysis
Table 62. Kanto Chemical Recent Developments
Table 63. Technic Gold Etchant Basic Information
Table 64. Technic Gold Etchant Product Overview
Table 65. Technic Gold Etchant Sales (K Units), Revenue (M USD), Price (USD/Unit) and Gross Margin (2019-2025)
Table 66. Technic Gold Etchant SWOT Analysis
Table 67. Technic Business Overview
Table 68. Technic Recent Developments
Table 69. NB Technologies Gold Etchant Basic Information
Table 70. NB Technologies Gold Etchant Product Overview
Table 71. NB Technologies Gold Etchant Sales (K Units), Revenue (M USD), Price (USD/Unit) and Gross Margin (2019-2025)
Table 72. NB Technologies Business Overview
Table 73. NB Technologies Recent Developments
Table 74. Chemleader Gold Etchant Basic Information
Table 75. Chemleader Gold Etchant Product Overview
Table 76. Chemleader Gold Etchant Sales (K Units), Revenue (M USD), Price (USD/Unit) and Gross Margin (2019-2025)
Table 77. Chemleader Business Overview
Table 78. Chemleader Recent Developments
Table 79. Solexir Gold Etchant Basic Information
Table 80. Solexir Gold Etchant Product Overview
Table 81. Solexir Gold Etchant Sales (K Units), Revenue (M USD), Price (USD/Unit) and Gross Margin (2019-2025)
Table 82. Solexir Business Overview
Table 83. Solexir Recent Developments
Table 84. Jiangyin Jianghua Microelectronics Materials Gold Etchant Basic Information
Table 85. Jiangyin Jianghua Microelectronics Materials Gold Etchant Product Overview
Table 86. Jiangyin Jianghua Microelectronics Materials Gold Etchant Sales (K Units), Revenue (M USD), Price (USD/Unit) and Gross Margin (2019-2025)
Table 87. Jiangyin Jianghua Microelectronics Materials Business Overview
Table 88. Jiangyin Jianghua Microelectronics Materials Recent Developments
Table 89. Runma Chemical Gold Etchant Basic Information
Table 90. Runma Chemical Gold Etchant Product Overview
Table 91. Runma Chemical Gold Etchant Sales (K Units), Revenue (M USD), Price (USD/Unit) and Gross Margin (2019-2025)
Table 92. Runma Chemical Business Overview
Table 93. Runma Chemical Recent Developments
Table 94. Zhejiang Shangneng Industrial Gold Etchant Basic Information
Table 95. Zhejiang Shangneng Industrial Gold Etchant Product Overview
Table 96. Zhejiang Shangneng Industrial Gold Etchant Sales (K Units), Revenue (M USD), Price (USD/Unit) and Gross Margin (2019-2025)
Table 97. Zhejiang Shangneng Industrial Business Overview
Table 98. Zhejiang Shangneng Industrial Recent Developments
Table 99. Global Gold Etchant Sales Forecast by Region (2025-2032) & (K Units)
Table 100. Global Gold Etchant Market Size Forecast by Region (2025-2032) & (M USD)
Table 101. North America Gold Etchant Sales Forecast by Country (2025-2032) & (K Units)
Table 102. North America Gold Etchant Market Size Forecast by Country (2025-2032) & (M USD)
Table 103. Europe Gold Etchant Sales Forecast by Country (2025-2032) & (K Units)
Table 104. Europe Gold Etchant Market Size Forecast by Country (2025-2032) & (M USD)
Table 105. Asia Pacific Gold Etchant Sales Forecast by Region (2025-2032) & (K Units)
Table 106. Asia Pacific Gold Etchant Market Size Forecast by Region (2025-2032) & (M USD)
Table 107. South America Gold Etchant Sales Forecast by Country (2025-2032) & (K Units)
Table 108. South America Gold Etchant Market Size Forecast by Country (2025-2032) & (M USD)
Table 109. Middle East and Africa Gold Etchant Consumption Forecast by Country (2025-2032) & (Units)
Table 110. Middle East and Africa Gold Etchant Market Size Forecast by Country (2025-2032) & (M USD)
Table 111. Global Gold Etchant Sales Forecast by Type (2025-2032) & (K Units)
Table 112. Global Gold Etchant Market Size Forecast by Type (2025-2032) & (M USD)
Table 113. Global Gold Etchant Price Forecast by Type (2025-2032) & (USD/Unit)
Table 114. Global Gold Etchant Sales (K Units) Forecast by Application (2025-2032)
Table 115. Global Gold Etchant Market Size Forecast by Application (2025-2032) & (M USD)
List of Figures
Figure 1. Product Picture of Gold Etchant
Figure 2. Data Triangulation
Figure 3. Key Caveats
Figure 4. Global Gold Etchant Market Size (M USD), 2019-2032
Figure 5. Global Gold Etchant Market Size (M USD) (2019-2032)
Figure 6. Global Gold Etchant Sales (K Units) & (2019-2032)
Figure 7. Evaluation Matrix of Segment Market Development Potential (Type)
Figure 8. Evaluation Matrix of Segment Market Development Potential (Application)
Figure 9. Evaluation Matrix of Regional Market Development Potential
Figure 10. Gold Etchant Market Size by Country (M USD)
Figure 11. Gold Etchant Sales Share by Manufacturers in 2023
Figure 12. Global Gold Etchant Revenue Share by Manufacturers in 2023
Figure 13. Gold Etchant Market Share by Company Type (Tier 1, Tier 2 and Tier 3): 2023
Figure 14. Global Market Gold Etchant Average Price (USD/Unit) of Key Manufacturers in 2023
Figure 15. The Global 5 and 10 Largest Players: Market Share by Gold Etchant Revenue in 2023
Figure 16. Evaluation Matrix of Segment Market Development Potential (Type)
Figure 17. Global Gold Etchant Market Share by Type
Figure 18. Sales Market Share of Gold Etchant by Type (2019-2025)
Figure 19. Sales Market Share of Gold Etchant by Type in 2023
Figure 20. Market Size Share of Gold Etchant by Type (2019-2025)
Figure 21. Market Size Market Share of Gold Etchant by Type in 2023
Figure 22. Evaluation Matrix of Segment Market Development Potential (Application)
Figure 23. Global Gold Etchant Market Share by Application
Figure 24. Global Gold Etchant Sales Market Share by Application (2019-2025)
Figure 25. Global Gold Etchant Sales Market Share by Application in 2023
Figure 26. Global Gold Etchant Market Share by Application (2019-2025)
Figure 27. Global Gold Etchant Market Share by Application in 2023
Figure 28. Global Gold Etchant Sales Growth Rate by Application (2019-2025)
Figure 29. Global Gold Etchant Sales Market Share by Region (2019-2025)
Figure 30. North America Gold Etchant Sales and Growth Rate (2019-2025) & (K Units)
Figure 31. North America Gold Etchant Sales Market Share by Country in 2023
Figure 32. U.S. Gold Etchant Sales and Growth Rate (2019-2025) & (K Units)
Figure 33. Canada Gold Etchant Sales (K Units) and Growth Rate (2019-2025)
Figure 34. Mexico Gold Etchant Sales (Units) and Growth Rate (2019-2025)
Figure 35. Europe Gold Etchant Sales and Growth Rate (2019-2025) & (K Units)
Figure 36. Europe Gold Etchant Sales Market Share by Country in 2023
Figure 37. Germany Gold Etchant Sales and Growth Rate (2019-2025) & (K Units)
Figure 38. France Gold Etchant Sales and Growth Rate (2019-2025) & (K Units)
Figure 39. U.K. Gold Etchant Sales and Growth Rate (2019-2025) & (K Units)
Figure 40. Italy Gold Etchant Sales and Growth Rate (2019-2025) & (K Units)
Figure 41. Russia Gold Etchant Sales and Growth Rate (2019-2025) & (K Units)
Figure 42. Asia Pacific Gold Etchant Sales and Growth Rate (K Units)
Figure 43. Asia Pacific Gold Etchant Sales Market Share by Region in 2023
Figure 44. China Gold Etchant Sales and Growth Rate (2019-2025) & (K Units)
Figure 45. Japan Gold Etchant Sales and Growth Rate (2019-2025) & (K Units)
Figure 46. South Korea Gold Etchant Sales and Growth Rate (2019-2025) & (K Units)
Figure 47. India Gold Etchant Sales and Growth Rate (2019-2025) & (K Units)
Figure 48. Southeast Asia Gold Etchant Sales and Growth Rate (2019-2025) & (K Units)
Figure 49. South America Gold Etchant Sales and Growth Rate (K Units)
Figure 50. South America Gold Etchant Sales Market Share by Country in 2023
Figure 51. Brazil Gold Etchant Sales and Growth Rate (2019-2025) & (K Units)
Figure 52. Argentina Gold Etchant Sales and Growth Rate (2019-2025) & (K Units)
Figure 53. Columbia Gold Etchant Sales and Growth Rate (2019-2025) & (K Units)
Figure 54. Middle East and Africa Gold Etchant Sales and Growth Rate (K Units)
Figure 55. Middle East and Africa Gold Etchant Sales Market Share by Region in 2023
Figure 56. Saudi Arabia Gold Etchant Sales and Growth Rate (2019-2025) & (K Units)
Figure 57. UAE Gold Etchant Sales and Growth Rate (2019-2025) & (K Units)
Figure 58. Egypt Gold Etchant Sales and Growth Rate (2019-2025) & (K Units)
Figure 59. Nigeria Gold Etchant Sales and Growth Rate (2019-2025) & (K Units)
Figure 60. South Africa Gold Etchant Sales and Growth Rate (2019-2025) & (K Units)
Figure 61. Global Gold Etchant Production Market Share by Region (2019-2025)
Figure 62. North America Gold Etchant Production (K Units) Growth Rate (2019-2025)
Figure 63. Europe Gold Etchant Production (K Units) Growth Rate (2019-2025)
Figure 64. Japan Gold Etchant Production (K Units) Growth Rate (2019-2025)
Figure 65. China Gold Etchant Production (K Units) Growth Rate (2019-2025)
Figure 66. Global Gold Etchant Sales Forecast by Volume (2019-2032) & (K Units)
Figure 67. Global Gold Etchant Market Size Forecast by Value (2019-2032) & (M USD)
Figure 68. Global Gold Etchant Sales Market Share Forecast by Type (2025-2032)
Figure 69. Global Gold Etchant Market Share Forecast by Type (2025-2032)
Figure 70. Global Gold Etchant Sales Forecast by Application (2025-2032)
Figure 71. Global Gold Etchant Market Share Forecast by Application (2025-2032)