Global SPI NOR Flash for Cars Market, Size, Trends, Business Strategies 2025-2032

The Global SPI NOR Flash for Cars Market size was estimated at USD 596 million in 2023 and is projected to reach USD 1549.49 million by 2032, exhibiting a CAGR of 11.20% during the forecast period.

PDF Icon Download Sample Report PDF
  • Quick Dispatch

    All Orders

  • Secure Payment

    100% Secure Payment

Price range: $1,500.00 through $4,250.00

Clear

SPI NOR Flash for Cars Market Overview

NOR is a non-volatile storage technology meaning that it doesn’t require power to retain data. NOR flash memory is characterized by fast random access times, which typically allow it to read relatively small amounts of data from any address quickly. Serial NOR Flash typically uses the Serial Peripheral Interface (SPI) protocol to interface with the memory controller. To achieve higher throughput, dual SPI and quad SPI interfaces are available.

This report provides a deep insight into the global SPI NOR Flash for Cars market covering all its essential aspects. This ranges from a macro overview of the market to micro details of the market size, competitive landscape, development trend, niche market, key market drivers and challenges, SWOT analysis, value chain analysis, etc.

The analysis helps the reader to shape the competition within the industries and strategies for the competitive environment to enhance the potential profit. Furthermore, it provides a simple framework for evaluating and accessing the position of the business organization. The report structure also focuses on the competitive landscape of the Global SPI NOR Flash for Cars Market, this report introduces in detail the market share, market performance, product situation, operation situation, etc. of the main players, which helps the readers in the industry to identify the main competitors and deeply understand the competition pattern of the market.
In a word, this report is a must-read for industry players, investors, researchers, consultants, business strategists, and all those who have any kind of stake or are planning to foray into the SPI NOR Flash for Cars market in any manner.

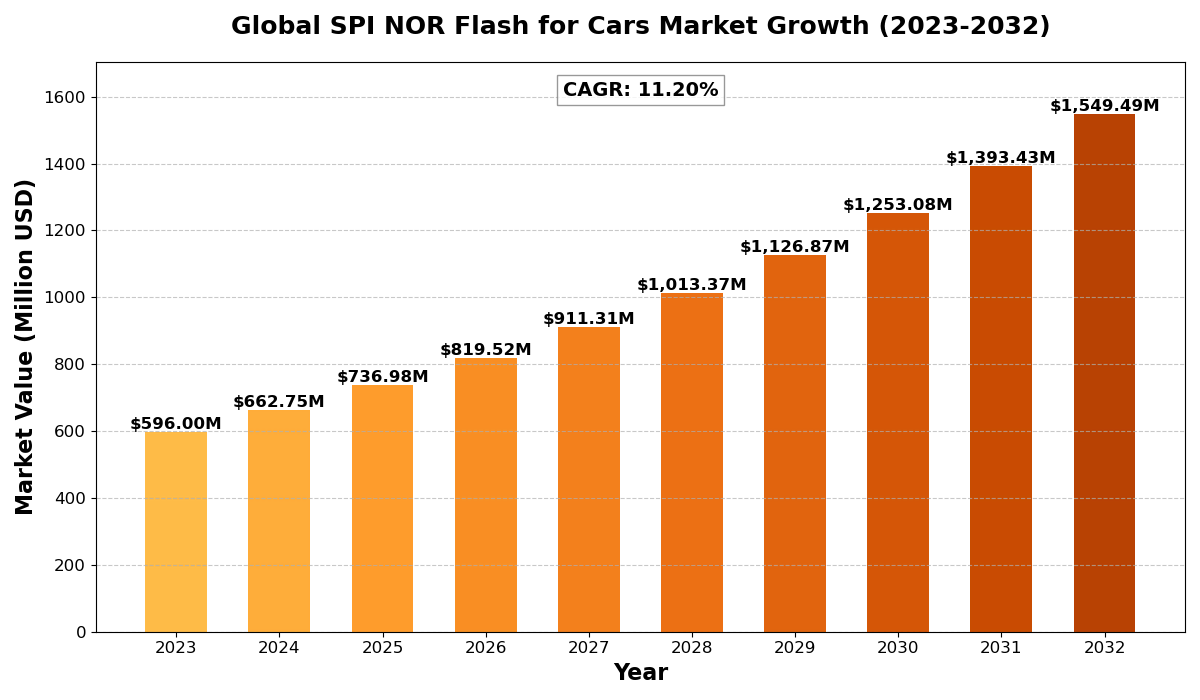
SPI NOR Flash for Cars Market Analysis:

The Global SPI NOR Flash for Cars Market size was estimated at USD 596 million in 2023 and is projected to reach USD 1549.49 million by 2032, exhibiting a CAGR of 11.20% during the forecast period.

North America SPI NOR Flash for Cars market size was estimated at USD 186.55 million in 2023, at a CAGR of 9.60% during the forecast period of 2025 through 2032.

SPI NOR Flash for Cars Key Market Trends  :

  1. Growing Demand for ADAS
    Advanced Driver Assistance Systems (ADAS) are rapidly gaining popularity in the automotive industry, driving the need for high-performance SPI NOR Flash memory for real-time data processing and storage.

  2. Shift to Electrification and Connectivity
    With the rise of electric vehicles (EVs) and connected car technologies, SPI NOR Flash plays a crucial role in supporting infotainment systems, vehicle cameras, and Internet of Things (IoT) applications.

  3. Increase in Autonomous Vehicles
    As autonomous vehicle technology continues to evolve, there is an increasing reliance on SPI NOR Flash for storing data related to sensors, cameras, and control systems critical for autonomous driving.

  4. Technological Advancements in Flash Memory
    Innovations like dual SPI and quad SPI interfaces are enhancing memory throughput, providing faster and more efficient data access for automotive applications.

  5. Focus on Safety and Security
    Automotive manufacturers are prioritizing data security, leading to higher demand for reliable, secure SPI NOR Flash for use in safety-critical applications like ADAS and instrument panels.

SPI NOR Flash for Cars Market Regional Analysis :

semi insight

  • North America:

    Strong demand driven by EVs, 5G infrastructure, and renewable energy, with the U.S. leading the market.

  • Europe:

    Growth fueled by automotive electrification, renewable energy, and strong regulatory support, with Germany as a key player.

  • Asia-Pacific:

    Dominates the market due to large-scale manufacturing in China and Japan, with growing demand from EVs, 5G, and semiconductors.

  • South America:

    Emerging market, driven by renewable energy and EV adoption, with Brazil leading growth.

  • Middle East & Africa:

    Gradual growth, mainly due to investments in renewable energy and EV infrastructure, with Saudi Arabia and UAE as key contributors.

SPI NOR Flash for Cars Market Segmentation :

The research report includes specific segments by region (country), manufacturers, Type, and Application. Market segmentation creates subsets of a market based on product type, end-user or application, Geographic, and other factors. By understanding the market segments, the decision-maker can leverage this targeting in the product, sales, and marketing strategies. Market segments can power your product development cycles by informing how you create product offerings for different segments.
Key Company

  • Infineon
  • Macronix
  • Micron
  • Winbond
  • GigaDevice Semiconductor (Beijing) Inc.
  • esmt
  • Integrated Silicon Solution Inc.

Market Segmentation (by Type)

  • 3.3V
  • 1.8V
  • Others

Market Segmentation (by Application)

  • ADAS
  • Instrument Panel
  • Vehicle Camera
  • Infotainment System
  • Internet of Vehicles
  • Others

Market Drivers

  1. Rising Demand for Advanced Driver Assistance Systems (ADAS):
    The rapid growth of ADAS technology in modern vehicles is a major driver for SPI NOR Flash, which is used in storing and processing large amounts of real-time data needed for vehicle safety systems.

  2. Growing Adoption of Electric and Connected Vehicles:
    The rise in electric and connected vehicles has led to increased demand for memory solutions like SPI NOR Flash, which support infotainment, camera systems, and vehicle networking.

  3. Technological Advancements in Memory Solutions:
    Advancements in dual SPI and quad SPI interfaces offer higher throughput, enabling faster data retrieval and storage capabilities essential for complex automotive systems.


Market Restraints

  1. High Production Costs:
    The production of SPI NOR Flash memory involves sophisticated manufacturing processes, which can result in high costs, potentially limiting adoption among price-sensitive automotive manufacturers.

  2. Competition from Other Memory Technologies:
    Alternatives such as NAND Flash and DRAM are also competing for market share in automotive applications, posing a challenge to the widespread adoption of SPI NOR Flash.

  3. Limited Storage Capacity:
    While SPI NOR Flash is known for its fast access times, it has relatively lower storage capacities compared to other memory technologies, which may limit its use in certain high-capacity applications.


Market Opportunities

  1. Increasing Use of Automotive Electronics:
    With vehicles becoming more electronic, there is a growing demand for reliable memory solutions like SPI NOR Flash to support various applications, creating a significant market opportunity.

  2. Growth in Autonomous Vehicle Technology:
    As autonomous vehicles gain traction, the demand for SPI NOR Flash will rise due to its importance in sensor data storage and real-time processing for autonomous systems.

  3. Expansion of the Global Automotive Market:
    The expansion of the automotive industry, particularly in emerging markets, presents an opportunity for SPI NOR Flash manufacturers to tap into new customer bases and regions.


Market Challenges

  1. Rapid Technological Changes:
    The fast pace of technological advancements in the automotive and electronics industries presents a challenge for SPI NOR Flash manufacturers to keep up with evolving consumer demands.

  2. Supply Chain Disruptions:
    Global supply chain issues, particularly in semiconductor production, can affect the availability and cost of SPI NOR Flash components, posing challenges for the automotive industry.

  3. Regulatory Compliance:
    The automotive industry is highly regulated, and meeting various standards and certifications for safety, security, and performance can be a complex challenge for SPI NOR Flash suppliers.

Key Benefits of This Market Research:

  • Industry drivers, restraints, and opportunities covered in the study
  • Neutral perspective on the market performance
  • Recent industry trends and developments
  • Competitive landscape & strategies of key players
  • Potential & niche segments and regions exhibiting promising growth covered
  • Historical, current, and projected market size, in terms of value
  • In-depth analysis of the SPI NOR Flash for Cars Market
  • Overview of the regional outlook of the SPI NOR Flash for Cars Market:

Key Reasons to Buy this Report:

  • Access to date statistics compiled by our researchers. These provide you with historical and forecast data, which is analyzed to tell you why your market is set to change
  • This enables you to anticipate market changes to remain ahead of your competitors
  • You will be able to copy data from the Excel spreadsheet straight into your marketing plans, business presentations, or other strategic documents
  • The concise analysis, clear graph, and table format will enable you to pinpoint the information you require quickly
  • Provision of market value data for each segment and sub-segment
  • Indicates the region and segment that is expected to witness the fastest growth as well as to dominate the market
  • Provides insight into the market through Value Chain
  • Market dynamics scenario, along with growth opportunities of the market in the years to come
  • 6-month post-sales analyst support

Customization of the Report
In case of any queries or customization requirements, please connect with our sales team, who will ensure that your requirements are met.


FAQs


Q: What are the key driving factors and opportunities in the SPI NOR Flash for Cars market?
A: Key drivers include the increasing adoption of ADAS, the growth of connected and electric vehicles, and technological advancements in memory solutions. Opportunities are in expanding automotive electronics, autonomous vehicles, and global market growth.


Q: Which region is projected to have the largest market share?
A: North America is projected to have a significant market share, driven by the growing adoption of automotive technologies like ADAS and vehicle connectivity.


Q: Who are the top players in the global SPI NOR Flash for Cars market?
A: Key players include Infineon, Macronix, Micron, Winbond, and GigaDevice Semiconductor (Beijing) Inc.


Q: What are the latest technological advancements in the SPI NOR Flash for Cars industry?
A: Advancements like dual SPI and quad SPI interfaces are improving data throughput, allowing faster access to critical data for automotive systems.


Q: What is the current size of the global SPI NOR Flash for Cars market?
A: The global market size was estimated at USD 596 million in 2023 and is projected to reach USD 1549.49 million by 2032, exhibiting a CAGR of 11.20% during the forecast period.

Global SPI NOR Flash for Cars Market, Size, Trends, Business Strategies 2025-2032

Get Sample Report PDF for Exclusive Insights

Report Sample Includes

  • Table of Contents
  • List of Tables & Figures
  • Charts, Research Methodology, and more...
PDF Icon Download Sample Report PDF

Download Sample Report

Table of Content

Table of Contents
1 Research Methodology and Statistical Scope
1.1 Market Definition and Statistical Scope of SPI NOR Flash for Cars
1.2 Key Market Segments
1.2.1 SPI NOR Flash for Cars Segment by Type
1.2.2 SPI NOR Flash for Cars Segment by Application
1.3 Methodology & Sources of Information
1.3.1 Research Methodology
1.3.2 Research Process
1.3.3 Market Breakdown and Data Triangulation
1.3.4 Base Year
1.3.5 Report Assumptions & Caveats
2 SPI NOR Flash for Cars Market Overview
2.1 Global Market Overview
2.1.1 Global SPI NOR Flash for Cars Market Size (M USD) Estimates and Forecasts (2019-2032)
2.1.2 Global SPI NOR Flash for Cars Sales Estimates and Forecasts (2019-2032)
2.2 Market Segment Executive Summary
2.3 Global Market Size by Region
3 SPI NOR Flash for Cars Market Competitive Landscape
3.1 Global SPI NOR Flash for Cars Sales by Manufacturers (2019-2025)
3.2 Global SPI NOR Flash for Cars Revenue Market Share by Manufacturers (2019-2025)
3.3 SPI NOR Flash for Cars Market Share by Company Type (Tier 1, Tier 2, and Tier 3)
3.4 Global SPI NOR Flash for Cars Average Price by Manufacturers (2019-2025)
3.5 Manufacturers SPI NOR Flash for Cars Sales Sites, Area Served, Product Type
3.6 SPI NOR Flash for Cars Market Competitive Situation and Trends
3.6.1 SPI NOR Flash for Cars Market Concentration Rate
3.6.2 Global 5 and 10 Largest SPI NOR Flash for Cars Players Market Share by Revenue
3.6.3 Mergers & Acquisitions, Expansion
4 SPI NOR Flash for Cars Industry Chain Analysis
4.1 SPI NOR Flash for Cars Industry Chain Analysis
4.2 Market Overview of Key Raw Materials
4.3 Midstream Market Analysis
4.4 Downstream Customer Analysis
5 The Development and Dynamics of SPI NOR Flash for Cars Market
5.1 Key Development Trends
5.2 Driving Factors
5.3 Market Challenges
5.4 Market Restraints
5.5 Industry News
5.5.1 New Product Developments
5.5.2 Mergers & Acquisitions
5.5.3 Expansions
5.5.4 Collaboration/Supply Contracts
5.6 Industry Policies
6 SPI NOR Flash for Cars Market Segmentation by Type
6.1 Evaluation Matrix of Segment Market Development Potential (Type)
6.2 Global SPI NOR Flash for Cars Sales Market Share by Type (2019-2025)
6.3 Global SPI NOR Flash for Cars Market Size Market Share by Type (2019-2025)
6.4 Global SPI NOR Flash for Cars Price by Type (2019-2025)
7 SPI NOR Flash for Cars Market Segmentation by Application
7.1 Evaluation Matrix of Segment Market Development Potential (Application)
7.2 Global SPI NOR Flash for Cars Market Sales by Application (2019-2025)
7.3 Global SPI NOR Flash for Cars Market Size (M USD) by Application (2019-2025)
7.4 Global SPI NOR Flash for Cars Sales Growth Rate by Application (2019-2025)
8 SPI NOR Flash for Cars Market Consumption by Region
8.1 Global SPI NOR Flash for Cars Sales by Region
8.1.1 Global SPI NOR Flash for Cars Sales by Region
8.1.2 Global SPI NOR Flash for Cars Sales Market Share by Region
8.2 North America
8.2.1 North America SPI NOR Flash for Cars Sales by Country
8.2.2 U.S.
8.2.3 Canada
8.2.4 Mexico
8.3 Europe
8.3.1 Europe SPI NOR Flash for Cars Sales by Country
8.3.2 Germany
8.3.3 France
8.3.4 U.K.
8.3.5 Italy
8.3.6 Russia
8.4 Asia Pacific
8.4.1 Asia Pacific SPI NOR Flash for Cars Sales by Region
8.4.2 China
8.4.3 Japan
8.4.4 South Korea
8.4.5 India
8.4.6 Southeast Asia
8.5 South America
8.5.1 South America SPI NOR Flash for Cars Sales by Country
8.5.2 Brazil
8.5.3 Argentina
8.5.4 Columbia
8.6 Middle East and Africa
8.6.1 Middle East and Africa SPI NOR Flash for Cars Sales by Region
8.6.2 Saudi Arabia
8.6.3 UAE
8.6.4 Egypt
8.6.5 Nigeria
8.6.6 South Africa
9 SPI NOR Flash for Cars Market Production by Region
9.1 Global Production of SPI NOR Flash for Cars by Region (2019-2025)
9.2 Global SPI NOR Flash for Cars Revenue Market Share by Region (2019-2025)
9.3 Global SPI NOR Flash for Cars Production, Revenue, Price and Gross Margin (2019-2025)
9.4 North America SPI NOR Flash for Cars Production
9.4.1 North America SPI NOR Flash for Cars Production Growth Rate (2019-2025)
9.4.2 North America SPI NOR Flash for Cars Production, Revenue, Price and Gross Margin (2019-2025)
9.5 Europe SPI NOR Flash for Cars Production
9.5.1 Europe SPI NOR Flash for Cars Production Growth Rate (2019-2025)
9.5.2 Europe SPI NOR Flash for Cars Production, Revenue, Price and Gross Margin (2019-2025)
9.6 Japan SPI NOR Flash for Cars Production (2019-2025)
9.6.1 Japan SPI NOR Flash for Cars Production Growth Rate (2019-2025)
9.6.2 Japan SPI NOR Flash for Cars Production, Revenue, Price and Gross Margin (2019-2025)
9.7 China SPI NOR Flash for Cars Production (2019-2025)
9.7.1 China SPI NOR Flash for Cars Production Growth Rate (2019-2025)
9.7.2 China SPI NOR Flash for Cars Production, Revenue, Price and Gross Margin (2019-2025)
10 Key Companies Profile
10.1 Infineon
10.1.1 Infineon SPI NOR Flash for Cars Basic Information
10.1.2 Infineon SPI NOR Flash for Cars Product Overview
10.1.3 Infineon SPI NOR Flash for Cars Product Market Performance
10.1.4 Infineon Business Overview
10.1.5 Infineon SPI NOR Flash for Cars SWOT Analysis
10.1.6 Infineon Recent Developments
10.2 Macronix
10.2.1 Macronix SPI NOR Flash for Cars Basic Information
10.2.2 Macronix SPI NOR Flash for Cars Product Overview
10.2.3 Macronix SPI NOR Flash for Cars Product Market Performance
10.2.4 Macronix Business Overview
10.2.5 Macronix SPI NOR Flash for Cars SWOT Analysis
10.2.6 Macronix Recent Developments
10.3 Micron
10.3.1 Micron SPI NOR Flash for Cars Basic Information
10.3.2 Micron SPI NOR Flash for Cars Product Overview
10.3.3 Micron SPI NOR Flash for Cars Product Market Performance
10.3.4 Micron SPI NOR Flash for Cars SWOT Analysis
10.3.5 Micron Business Overview
10.3.6 Micron Recent Developments
10.4 Winbond
10.4.1 Winbond SPI NOR Flash for Cars Basic Information
10.4.2 Winbond SPI NOR Flash for Cars Product Overview
10.4.3 Winbond SPI NOR Flash for Cars Product Market Performance
10.4.4 Winbond Business Overview
10.4.5 Winbond Recent Developments
10.5 GigaDevice Semiconductor (Beijing) Inc.
10.5.1 GigaDevice Semiconductor (Beijing) Inc. SPI NOR Flash for Cars Basic Information
10.5.2 GigaDevice Semiconductor (Beijing) Inc. SPI NOR Flash for Cars Product Overview
10.5.3 GigaDevice Semiconductor (Beijing) Inc. SPI NOR Flash for Cars Product Market Performance
10.5.4 GigaDevice Semiconductor (Beijing) Inc. Business Overview
10.5.5 GigaDevice Semiconductor (Beijing) Inc. Recent Developments
10.6 esmt
10.6.1 esmt SPI NOR Flash for Cars Basic Information
10.6.2 esmt SPI NOR Flash for Cars Product Overview
10.6.3 esmt SPI NOR Flash for Cars Product Market Performance
10.6.4 esmt Business Overview
10.6.5 esmt Recent Developments
10.7 Integrated Silicon Solution Inc.
10.7.1 Integrated Silicon Solution Inc. SPI NOR Flash for Cars Basic Information
10.7.2 Integrated Silicon Solution Inc. SPI NOR Flash for Cars Product Overview
10.7.3 Integrated Silicon Solution Inc. SPI NOR Flash for Cars Product Market Performance
10.7.4 Integrated Silicon Solution Inc. Business Overview
10.7.5 Integrated Silicon Solution Inc. Recent Developments
11 SPI NOR Flash for Cars Market Forecast by Region
11.1 Global SPI NOR Flash for Cars Market Size Forecast
11.2 Global SPI NOR Flash for Cars Market Forecast by Region
11.2.1 North America Market Size Forecast by Country
11.2.2 Europe SPI NOR Flash for Cars Market Size Forecast by Country
11.2.3 Asia Pacific SPI NOR Flash for Cars Market Size Forecast by Region
11.2.4 South America SPI NOR Flash for Cars Market Size Forecast by Country
11.2.5 Middle East and Africa Forecasted Consumption of SPI NOR Flash for Cars by Country
12 Forecast Market by Type and by Application (2025-2032)
12.1 Global SPI NOR Flash for Cars Market Forecast by Type (2025-2032)
12.1.1 Global Forecasted Sales of SPI NOR Flash for Cars by Type (2025-2032)
12.1.2 Global SPI NOR Flash for Cars Market Size Forecast by Type (2025-2032)
12.1.3 Global Forecasted Price of SPI NOR Flash for Cars by Type (2025-2032)
12.2 Global SPI NOR Flash for Cars Market Forecast by Application (2025-2032)
12.2.1 Global SPI NOR Flash for Cars Sales (K Units) Forecast by Application
12.2.2 Global SPI NOR Flash for Cars Market Size (M USD) Forecast by Application (2025-2032)
13 Conclusion and Key FindingsList of Tables
Table 1. Introduction of the Type
Table 2. Introduction of the Application
Table 3. Market Size (M USD) Segment Executive Summary
Table 4. SPI NOR Flash for Cars Market Size Comparison by Region (M USD)
Table 5. Global SPI NOR Flash for Cars Sales (K Units) by Manufacturers (2019-2025)
Table 6. Global SPI NOR Flash for Cars Sales Market Share by Manufacturers (2019-2025)
Table 7. Global SPI NOR Flash for Cars Revenue (M USD) by Manufacturers (2019-2025)
Table 8. Global SPI NOR Flash for Cars Revenue Share by Manufacturers (2019-2025)
Table 9. Company Type (Tier 1, Tier 2, and Tier 3) & (based on the Revenue in SPI NOR Flash for Cars as of 2022)
Table 10. Global Market SPI NOR Flash for Cars Average Price (USD/Unit) of Key Manufacturers (2019-2025)
Table 11. Manufacturers SPI NOR Flash for Cars Sales Sites and Area Served
Table 12. Manufacturers SPI NOR Flash for Cars Product Type
Table 13. Global SPI NOR Flash for Cars Manufacturers Market Concentration Ratio (CR5 and HHI)
Table 14. Mergers & Acquisitions, Expansion Plans
Table 15. Industry Chain Map of SPI NOR Flash for Cars
Table 16. Market Overview of Key Raw Materials
Table 17. Midstream Market Analysis
Table 18. Downstream Customer Analysis
Table 19. Key Development Trends
Table 20. Driving Factors
Table 21. SPI NOR Flash for Cars Market Challenges
Table 22. Global SPI NOR Flash for Cars Sales by Type (K Units)
Table 23. Global SPI NOR Flash for Cars Market Size by Type (M USD)
Table 24. Global SPI NOR Flash for Cars Sales (K Units) by Type (2019-2025)
Table 25. Global SPI NOR Flash for Cars Sales Market Share by Type (2019-2025)
Table 26. Global SPI NOR Flash for Cars Market Size (M USD) by Type (2019-2025)
Table 27. Global SPI NOR Flash for Cars Market Size Share by Type (2019-2025)
Table 28. Global SPI NOR Flash for Cars Price (USD/Unit) by Type (2019-2025)
Table 29. Global SPI NOR Flash for Cars Sales (K Units) by Application
Table 30. Global SPI NOR Flash for Cars Market Size by Application
Table 31. Global SPI NOR Flash for Cars Sales by Application (2019-2025) & (K Units)
Table 32. Global SPI NOR Flash for Cars Sales Market Share by Application (2019-2025)
Table 33. Global SPI NOR Flash for Cars Sales by Application (2019-2025) & (M USD)
Table 34. Global SPI NOR Flash for Cars Market Share by Application (2019-2025)
Table 35. Global SPI NOR Flash for Cars Sales Growth Rate by Application (2019-2025)
Table 36. Global SPI NOR Flash for Cars Sales by Region (2019-2025) & (K Units)
Table 37. Global SPI NOR Flash for Cars Sales Market Share by Region (2019-2025)
Table 38. North America SPI NOR Flash for Cars Sales by Country (2019-2025) & (K Units)
Table 39. Europe SPI NOR Flash for Cars Sales by Country (2019-2025) & (K Units)
Table 40. Asia Pacific SPI NOR Flash for Cars Sales by Region (2019-2025) & (K Units)
Table 41. South America SPI NOR Flash for Cars Sales by Country (2019-2025) & (K Units)
Table 42. Middle East and Africa SPI NOR Flash for Cars Sales by Region (2019-2025) & (K Units)
Table 43. Global SPI NOR Flash for Cars Production (K Units) by Region (2019-2025)
Table 44. Global SPI NOR Flash for Cars Revenue (US$ Million) by Region (2019-2025)
Table 45. Global SPI NOR Flash for Cars Revenue Market Share by Region (2019-2025)
Table 46. Global SPI NOR Flash for Cars Production (K Units), Revenue (US$ Million), Price (USD/Unit) and Gross Margin (2019-2025)
Table 47. North America SPI NOR Flash for Cars Production (K Units), Revenue (US$ Million), Price (USD/Unit) and Gross Margin (2019-2025)
Table 48. Europe SPI NOR Flash for Cars Production (K Units), Revenue (US$ Million), Price (USD/Unit) and Gross Margin (2019-2025)
Table 49. Japan SPI NOR Flash for Cars Production (K Units), Revenue (US$ Million), Price (USD/Unit) and Gross Margin (2019-2025)
Table 50. China SPI NOR Flash for Cars Production (K Units), Revenue (US$ Million), Price (USD/Unit) and Gross Margin (2019-2025)
Table 51. Infineon SPI NOR Flash for Cars Basic Information
Table 52. Infineon SPI NOR Flash for Cars Product Overview
Table 53. Infineon SPI NOR Flash for Cars Sales (K Units), Revenue (M USD), Price (USD/Unit) and Gross Margin (2019-2025)
Table 54. Infineon Business Overview
Table 55. Infineon SPI NOR Flash for Cars SWOT Analysis
Table 56. Infineon Recent Developments
Table 57. Macronix SPI NOR Flash for Cars Basic Information
Table 58. Macronix SPI NOR Flash for Cars Product Overview
Table 59. Macronix SPI NOR Flash for Cars Sales (K Units), Revenue (M USD), Price (USD/Unit) and Gross Margin (2019-2025)
Table 60. Macronix Business Overview
Table 61. Macronix SPI NOR Flash for Cars SWOT Analysis
Table 62. Macronix Recent Developments
Table 63. Micron SPI NOR Flash for Cars Basic Information
Table 64. Micron SPI NOR Flash for Cars Product Overview
Table 65. Micron SPI NOR Flash for Cars Sales (K Units), Revenue (M USD), Price (USD/Unit) and Gross Margin (2019-2025)
Table 66. Micron SPI NOR Flash for Cars SWOT Analysis
Table 67. Micron Business Overview
Table 68. Micron Recent Developments
Table 69. Winbond SPI NOR Flash for Cars Basic Information
Table 70. Winbond SPI NOR Flash for Cars Product Overview
Table 71. Winbond SPI NOR Flash for Cars Sales (K Units), Revenue (M USD), Price (USD/Unit) and Gross Margin (2019-2025)
Table 72. Winbond Business Overview
Table 73. Winbond Recent Developments
Table 74. GigaDevice Semiconductor (Beijing) Inc. SPI NOR Flash for Cars Basic Information
Table 75. GigaDevice Semiconductor (Beijing) Inc. SPI NOR Flash for Cars Product Overview
Table 76. GigaDevice Semiconductor (Beijing) Inc. SPI NOR Flash for Cars Sales (K Units), Revenue (M USD), Price (USD/Unit) and Gross Margin (2019-2025)
Table 77. GigaDevice Semiconductor (Beijing) Inc. Business Overview
Table 78. GigaDevice Semiconductor (Beijing) Inc. Recent Developments
Table 79. esmt SPI NOR Flash for Cars Basic Information
Table 80. esmt SPI NOR Flash for Cars Product Overview
Table 81. esmt SPI NOR Flash for Cars Sales (K Units), Revenue (M USD), Price (USD/Unit) and Gross Margin (2019-2025)
Table 82. esmt Business Overview
Table 83. esmt Recent Developments
Table 84. Integrated Silicon Solution Inc. SPI NOR Flash for Cars Basic Information
Table 85. Integrated Silicon Solution Inc. SPI NOR Flash for Cars Product Overview
Table 86. Integrated Silicon Solution Inc. SPI NOR Flash for Cars Sales (K Units), Revenue (M USD), Price (USD/Unit) and Gross Margin (2019-2025)
Table 87. Integrated Silicon Solution Inc. Business Overview
Table 88. Integrated Silicon Solution Inc. Recent Developments
Table 89. Global SPI NOR Flash for Cars Sales Forecast by Region (2025-2032) & (K Units)
Table 90. Global SPI NOR Flash for Cars Market Size Forecast by Region (2025-2032) & (M USD)
Table 91. North America SPI NOR Flash for Cars Sales Forecast by Country (2025-2032) & (K Units)
Table 92. North America SPI NOR Flash for Cars Market Size Forecast by Country (2025-2032) & (M USD)
Table 93. Europe SPI NOR Flash for Cars Sales Forecast by Country (2025-2032) & (K Units)
Table 94. Europe SPI NOR Flash for Cars Market Size Forecast by Country (2025-2032) & (M USD)
Table 95. Asia Pacific SPI NOR Flash for Cars Sales Forecast by Region (2025-2032) & (K Units)
Table 96. Asia Pacific SPI NOR Flash for Cars Market Size Forecast by Region (2025-2032) & (M USD)
Table 97. South America SPI NOR Flash for Cars Sales Forecast by Country (2025-2032) & (K Units)
Table 98. South America SPI NOR Flash for Cars Market Size Forecast by Country (2025-2032) & (M USD)
Table 99. Middle East and Africa SPI NOR Flash for Cars Consumption Forecast by Country (2025-2032) & (Units)
Table 100. Middle East and Africa SPI NOR Flash for Cars Market Size Forecast by Country (2025-2032) & (M USD)
Table 101. Global SPI NOR Flash for Cars Sales Forecast by Type (2025-2032) & (K Units)
Table 102. Global SPI NOR Flash for Cars Market Size Forecast by Type (2025-2032) & (M USD)
Table 103. Global SPI NOR Flash for Cars Price Forecast by Type (2025-2032) & (USD/Unit)
Table 104. Global SPI NOR Flash for Cars Sales (K Units) Forecast by Application (2025-2032)
Table 105. Global SPI NOR Flash for Cars Market Size Forecast by Application (2025-2032) & (M USD)
List of Figures
Figure 1. Product Picture of SPI NOR Flash for Cars
Figure 2. Data Triangulation
Figure 3. Key Caveats
Figure 4. Global SPI NOR Flash for Cars Market Size (M USD), 2019-2032
Figure 5. Global SPI NOR Flash for Cars Market Size (M USD) (2019-2032)
Figure 6. Global SPI NOR Flash for Cars Sales (K Units) & (2019-2032)
Figure 7. Evaluation Matrix of Segment Market Development Potential (Type)
Figure 8. Evaluation Matrix of Segment Market Development Potential (Application)
Figure 9. Evaluation Matrix of Regional Market Development Potential
Figure 10. SPI NOR Flash for Cars Market Size by Country (M USD)
Figure 11. SPI NOR Flash for Cars Sales Share by Manufacturers in 2023
Figure 12. Global SPI NOR Flash for Cars Revenue Share by Manufacturers in 2023
Figure 13. SPI NOR Flash for Cars Market Share by Company Type (Tier 1, Tier 2 and Tier 3): 2023
Figure 14. Global Market SPI NOR Flash for Cars Average Price (USD/Unit) of Key Manufacturers in 2023
Figure 15. The Global 5 and 10 Largest Players: Market Share by SPI NOR Flash for Cars Revenue in 2023
Figure 16. Evaluation Matrix of Segment Market Development Potential (Type)
Figure 17. Global SPI NOR Flash for Cars Market Share by Type
Figure 18. Sales Market Share of SPI NOR Flash for Cars by Type (2019-2025)
Figure 19. Sales Market Share of SPI NOR Flash for Cars by Type in 2023
Figure 20. Market Size Share of SPI NOR Flash for Cars by Type (2019-2025)
Figure 21. Market Size Market Share of SPI NOR Flash for Cars by Type in 2023
Figure 22. Evaluation Matrix of Segment Market Development Potential (Application)
Figure 23. Global SPI NOR Flash for Cars Market Share by Application
Figure 24. Global SPI NOR Flash for Cars Sales Market Share by Application (2019-2025)
Figure 25. Global SPI NOR Flash for Cars Sales Market Share by Application in 2023
Figure 26. Global SPI NOR Flash for Cars Market Share by Application (2019-2025)
Figure 27. Global SPI NOR Flash for Cars Market Share by Application in 2023
Figure 28. Global SPI NOR Flash for Cars Sales Growth Rate by Application (2019-2025)
Figure 29. Global SPI NOR Flash for Cars Sales Market Share by Region (2019-2025)
Figure 30. North America SPI NOR Flash for Cars Sales and Growth Rate (2019-2025) & (K Units)
Figure 31. North America SPI NOR Flash for Cars Sales Market Share by Country in 2023
Figure 32. U.S. SPI NOR Flash for Cars Sales and Growth Rate (2019-2025) & (K Units)
Figure 33. Canada SPI NOR Flash for Cars Sales (K Units) and Growth Rate (2019-2025)
Figure 34. Mexico SPI NOR Flash for Cars Sales (Units) and Growth Rate (2019-2025)
Figure 35. Europe SPI NOR Flash for Cars Sales and Growth Rate (2019-2025) & (K Units)
Figure 36. Europe SPI NOR Flash for Cars Sales Market Share by Country in 2023
Figure 37. Germany SPI NOR Flash for Cars Sales and Growth Rate (2019-2025) & (K Units)
Figure 38. France SPI NOR Flash for Cars Sales and Growth Rate (2019-2025) & (K Units)
Figure 39. U.K. SPI NOR Flash for Cars Sales and Growth Rate (2019-2025) & (K Units)
Figure 40. Italy SPI NOR Flash for Cars Sales and Growth Rate (2019-2025) & (K Units)
Figure 41. Russia SPI NOR Flash for Cars Sales and Growth Rate (2019-2025) & (K Units)
Figure 42. Asia Pacific SPI NOR Flash for Cars Sales and Growth Rate (K Units)
Figure 43. Asia Pacific SPI NOR Flash for Cars Sales Market Share by Region in 2023
Figure 44. China SPI NOR Flash for Cars Sales and Growth Rate (2019-2025) & (K Units)
Figure 45. Japan SPI NOR Flash for Cars Sales and Growth Rate (2019-2025) & (K Units)
Figure 46. South Korea SPI NOR Flash for Cars Sales and Growth Rate (2019-2025) & (K Units)
Figure 47. India SPI NOR Flash for Cars Sales and Growth Rate (2019-2025) & (K Units)
Figure 48. Southeast Asia SPI NOR Flash for Cars Sales and Growth Rate (2019-2025) & (K Units)
Figure 49. South America SPI NOR Flash for Cars Sales and Growth Rate (K Units)
Figure 50. South America SPI NOR Flash for Cars Sales Market Share by Country in 2023
Figure 51. Brazil SPI NOR Flash for Cars Sales and Growth Rate (2019-2025) & (K Units)
Figure 52. Argentina SPI NOR Flash for Cars Sales and Growth Rate (2019-2025) & (K Units)
Figure 53. Columbia SPI NOR Flash for Cars Sales and Growth Rate (2019-2025) & (K Units)
Figure 54. Middle East and Africa SPI NOR Flash for Cars Sales and Growth Rate (K Units)
Figure 55. Middle East and Africa SPI NOR Flash for Cars Sales Market Share by Region in 2023
Figure 56. Saudi Arabia SPI NOR Flash for Cars Sales and Growth Rate (2019-2025) & (K Units)
Figure 57. UAE SPI NOR Flash for Cars Sales and Growth Rate (2019-2025) & (K Units)
Figure 58. Egypt SPI NOR Flash for Cars Sales and Growth Rate (2019-2025) & (K Units)
Figure 59. Nigeria SPI NOR Flash for Cars Sales and Growth Rate (2019-2025) & (K Units)
Figure 60. South Africa SPI NOR Flash for Cars Sales and Growth Rate (2019-2025) & (K Units)
Figure 61. Global SPI NOR Flash for Cars Production Market Share by Region (2019-2025)
Figure 62. North America SPI NOR Flash for Cars Production (K Units) Growth Rate (2019-2025)
Figure 63. Europe SPI NOR Flash for Cars Production (K Units) Growth Rate (2019-2025)
Figure 64. Japan SPI NOR Flash for Cars Production (K Units) Growth Rate (2019-2025)
Figure 65. China SPI NOR Flash for Cars Production (K Units) Growth Rate (2019-2025)
Figure 66. Global SPI NOR Flash for Cars Sales Forecast by Volume (2019-2032) & (K Units)
Figure 67. Global SPI NOR Flash for Cars Market Size Forecast by Value (2019-2032) & (M USD)
Figure 68. Global SPI NOR Flash for Cars Sales Market Share Forecast by Type (2025-2032)
Figure 69. Global SPI NOR Flash for Cars Market Share Forecast by Type (2025-2032)
Figure 70. Global SPI NOR Flash for Cars Sales Forecast by Application (2025-2032)
Figure 71. Global SPI NOR Flash for Cars Market Share Forecast by Application (2025-2032)