Global Power Supply Unit (PSU) Market Research Report 2025(Status and Outlook)

Power Supply Unit (PSU) Market size was valued at US$ 12.47 billion in 2024 and is projected to reach US$ 21.38 billion by 2032, at a CAGR of 6.3% during the forecast period 2025-2032

PDF Icon Download Sample Report PDF
  • Quick Dispatch

    All Orders

  • Secure Payment

    100% Secure Payment

Compare

$1,500.00$4,250.00

Clear

MARKET INSIGHTS

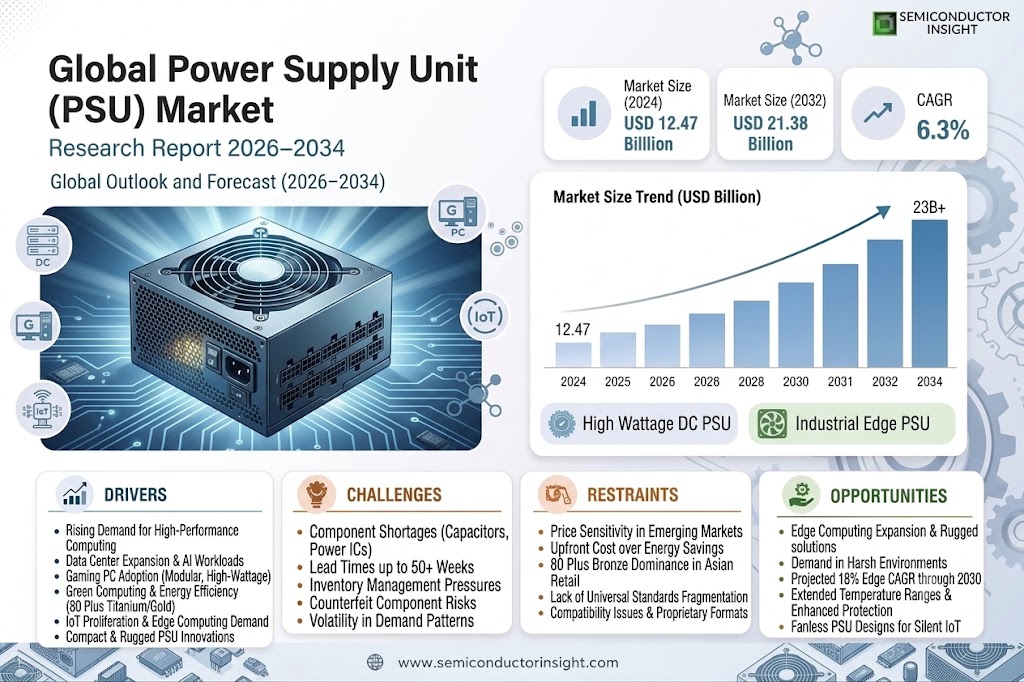
The global Power Supply Unit (PSU) Market size was valued at US$ 12.47 billion in 2024 and is projected to reach US$ 21.38 billion by 2032, at a CAGR of 6.3% during the forecast period 2025-2032. This growth is driven by increasing demand for energy-efficient computing solutions and expansion of data centers worldwide.

A Power Supply Unit (PSU) is a critical hardware component that converts alternating current (AC) to direct current (DC) while regulating voltage for computer systems. Modern PSUs feature modular designs, 80 PLUS certification for energy efficiency, and advanced thermal management systems. The market offers two primary variants: AC power supplies (for general computing applications) and DC power supplies (specialized for industrial equipment and telecom infrastructure).

Key growth drivers include the rapid expansion of cloud computing infrastructure and increasing adoption of high-performance computing solutions. However, the market faces challenges from alternative power solutions and supply chain disruptions affecting semiconductor availability. Recent technological advancements focus on improving energy efficiency – with leading manufacturers like Corsair and Seasonic introducing PSUs achieving 94% conversion efficiency under Titanium certification standards. The competitive landscape features established players including Thermaltake, FSP Group, and Cooler Master, who collectively hold over 45% of the global market share through continuous product innovation and strategic partnerships with OEMs.

MARKET DYNAMICS

MARKET DRIVERS

Rising Demand for High-Performance Computing to Accelerate PSU Market Growth

The global PSU market is experiencing strong growth driven by the exponential demand for high-performance computing across industries. Data center expansions, growing AI workloads, and increasing gaming PC adoption are creating unprecedented demand for efficient, high-wattage power supplies. The data center PSU segment alone is projected to grow at nearly 15% annually, focusing on 80 Plus Titanium efficiency standards. Meanwhile, the gaming PC segment continues driving innovation in modular and compact PSU designs with capacities exceeding 1200W.

Green Computing Initiatives Push Adoption of Energy-Efficient PSUs

Environmental regulations and corporate sustainability goals are accelerating the transition to energy-efficient power supplies. Manufacturers are investing heavily in developing PSUs with 90%+ efficiency ratings to meet stringent global energy standards. The shift is particularly evident in Europe and North America, where regulations mandate minimum 80 Plus Gold efficiency for commercial computing equipment. This transition presents significant revenue opportunities, with premium efficiency PSUs commanding 30-45% higher price points than standard models.

Proliferation of IoT Devices Creates New Demand for Compact PSUs

The explosive growth of IoT applications across smart homes, industrial automation, and edge computing is driving demand for small-form-factor power supplies. The industrial PSU segment is projected to grow at 12.8% CAGR, driven by increased automation and machine-to-machine communication. Recent innovations include fanless PSU designs for silent operation and ruggedized units capable of operating in extreme temperatures. For instance, leading manufacturers have introduced IP67-rated PSUs for outdoor IoT applications, expanding market potential.

MARKET CHALLENGES

Component Shortages and Supply Chain Disruptions Constrain Production

The PSU industry continues facing significant supply chain challenges, particularly for critical components like capacitors and power ICs. Lead times for certain semiconductor components have extended to 50+ weeks, forcing manufacturers to redesign products or accept lower margins. The situation is particularly acute for high-wattage PSUs requiring premium components, with some vendors reporting 20-30% production shortfalls.

Other Challenges

Inventory Management Pressures
Volatile demand patterns have made inventory planning extraordinarily difficult, with many manufacturers struggling to balance component stockpiles against fluctuating orders. The situation is exacerbated by the long life cycles of PSU components, requiring careful management of obsolete parts.

Counterfeit Component Risks
The tight supply environment has increased incidents of counterfeit electronic components entering the supply chain. This poses significant quality and reliability risks, particularly for mission-critical applications where PSU failure could have severe consequences.

MARKET RESTRAINTS

Price Sensitivity in Emerging Markets Limits Premium PSU Adoption

While developed markets embrace high-efficiency PSUs, price sensitivity in emerging economies continues restraining premium segment growth. In price-conscious markets, consumers often prioritize upfront cost over long-term energy savings, creating challenges for manufacturers attempting to recoup R&D investments. The situation is particularly evident in the Asian retail sector, where 80 Plus Bronze units still dominate despite wider availability of more efficient models.

Standardization Challenges Hinder Market Consolidation

The lack of universal standards for certain PSU form factors and connectors creates compatibility issues that slow market growth. While ATX has become dominant in desktop computing, specialized applications continue using proprietary formats. This fragmentation increases development costs and limits economies of scale, particularly in industrial and embedded applications where customization is frequently required.

MARKET OPPORTUNITIES

Edge Computing Expansion Opens New Markets for Rugged PSUs

The rapid deployment of edge computing infrastructure presents significant opportunities for PSU manufacturers specializing in ruggedized, reliable power solutions. As computing moves closer to data sources, demand grows for PSUs capable of operating in harsh environments with minimal maintenance. This market segment is particularly attractive, with projected CAGR of 18% through 2030. Leading manufacturers are already introducing new product lines featuring extended temperature ranges and enhanced protection against power fluctuations.

Integration of Smart Monitoring Features Creates Value-Added Opportunities

The incorporation of IoT connectivity and predictive maintenance capabilities into PSU designs represents a growing revenue stream. Smart PSUs capable of monitoring load conditions, predicting failures, and optimizing power delivery are gaining traction in data center and industrial applications. These advanced units typically command 50-75% premium over conventional models while delivering significant operational savings through improved reliability and energy management.

POWER SUPPLY UNIT (PSU) MARKET TRENDS

Rising Demand for High-Efficiency Power Supplies

The global Power Supply Unit (PSU) market is witnessing a significant shift toward high-efficiency, low-power consumption solutions, driven by increasing energy regulations and consumer demand for sustainable technology. With the growing emphasis on 80 PLUS certification standards, manufacturers are prioritizing units with higher efficiency ratings, such as Titanium and Platinum, which offer over 90% efficiency under typical loads. Furthermore, advancements in semiconductor technologies, including gallium nitride (GaN) and silicon carbide (SiC), are enabling compact, lightweight power supplies with superior thermal management and reduced energy wastage. These innovations are particularly crucial for data centers and high-performance computing applications, where energy costs and heat dissipation are major concerns.

Other Trends

Modular and Semi-Modular PSU Adoption

The growing preference for modular and semi-modular power supplies is reshaping the market, especially among PC enthusiasts and system builders. Unlike traditional PSUs, modular variants allow users to detach unnecessary cables, improving airflow and reducing clutter in custom-built systems. This trend aligns with the increasing popularity of small-form-factor (SFF) PCs and gaming rigs, where cable management is critical for thermal performance and aesthetics. Additionally, the rise of RGB customization in high-end builds has spurred demand for PSUs with integrated lighting and digital monitoring features.

Expansion of AI and Data Center Applications

Artificial Intelligence (AI) workloads and hyperscale data centers are fueling demand for robust, scalable power supply solutions. As enterprises deploy more AI-driven infrastructure, the need for stable, high-wattage PSUs capable of sustaining continuous heavy loads has surged. The data center PSU market alone is projected to grow significantly, driven by cloud computing expansion and the rollout of 5G networks. Innovations such as digital power management and redundant power supply (RPS) configurations are becoming standard in enterprise environments, ensuring reliability and uptime for mission-critical operations. Furthermore, edge computing deployments are creating opportunities for compact, high-efficiency PSUs designed for distributed IT architectures.

COMPETITIVE LANDSCAPE

Key Industry Players

Leading PSU Manufacturers Focus on Efficiency and Innovation to Capture Market Share

The global power supply unit (PSU) market features a diverse competitive landscape with both established electronics giants and specialized power solution providers vying for dominance. Seasonic and Corsair currently lead the premium segment, capturing nearly 28% of the high-wattage PSU market combined as of Q2 2024. Their success stems from patented modular designs and 80 PLUS Titanium certified products that achieve up to 96% energy efficiency.

The mid-range segment shows particularly fierce competition, with Cooler Master and Thermaltake leveraging strong distribution networks across Asia-Pacific and Europe. Both companies have recently expanded their product lines to address the growing demand for SFX-L form factors in compact gaming PCs.

Meanwhile, Taiwanese manufacturer FSP continues to dominate the OEM supply market, providing power solutions for 30% of major desktop brands. Their vertically integrated production capabilities allow competitive pricing while maintaining 80 PLUS Gold efficiency standards.

The competitive landscape continues to evolve with strategic movements from key players:

  • SilverStone Technology recently acquired a German power electronics firm to enhance their R&D capabilities
  • Antec partnered with NVIDIA to develop ATX 3.0 compatible power supplies ahead of competitors
  • XFX committed $120M to expand production capacity for their high-performance PSU line

List of Key Power Supply Unit Manufacturers Profiled

Segment Analysis:

By Type

AC Power Supply Segment Leads the Market Owing to Widespread Adoption in Industrial Applications

The market is segmented based on type into:

  • AC Power Supply
  • DC Power Supply

By Application

PC Computers Segment Dominates Due to Increasing Demand for Gaming and High-Performance PCs

The market is segmented based on application into:

  • PC Computers
  • Mobile Devices
  • Industrial Equipment
  • Telecommunications
  • Others

By Power Rating

300W-500W Segment Holds Major Share for Mid-Range Computing Needs

The market is segmented based on power rating into:

  • Below 300W
  • 300W-500W
  • 500W-800W
  • Above 800W

By Form Factor

ATX Segment Dominates Compatibility With Standard Desktop Configurations

The market is segmented based on form factor into:

  • ATX
  • SFX
  • TFX
  • Flex ATX
  • Others

Regional Analysis: Global Power Supply Unit (PSU) Market

North America
The North American PSU market is characterized by high technological adoption and stringent energy efficiency standards. The region’s mature PC gaming industry and data center expansion are key growth drivers, with the U.S. accounting for over 60% of regional demand. 80 PLUS certification requirements have pushed manufacturers toward modular, high-efficiency (90%+) units. However, market saturation in desktop PC segments has led vendors to focus on premium gaming PSUs and server-grade solutions. The Canadian market shows steady growth, fueled by increasing investments in hyperscale data centers.

Europe
Europe’s PSU market is shaped by the EU Ecodesign Directive and energy labeling regulations, driving innovation in low-power consumption units. Germany and France lead in industrial and commercial applications, while the UK gaming sector sustains demand for high-wattage modular PSUs. The region has seen a 12% CAGR in server PSU demand, with increased cloud computing investments. A significant trend is the shift toward fanless and silent PSUs in residential and office environments. Eastern Europe presents emerging opportunities as PC component manufacturing expands to countries like Poland and Hungary.

Asia-Pacific
As the largest and fastest-growing PSU market, Asia-Pacific benefits from concentrated electronics manufacturing in China, Taiwan, and South Korea. China’s DIY PC culture and esports boom have created a $2.1 billion PSU segment, while India shows the highest growth potential (18% YoY) due to increasing PC penetration. Japan maintains demand for high-reliability industrial PSUs, and Southeast Asian countries prioritize cost-effective solutions. The region faces challenges with counterfeit products but leads in OEM production, supplying 75% of global PSU units. Recent developments include GaN (Gallium Nitride) technology adoption among premium brands.

South America
Market growth in South America is constrained by economic instability but shows pockets of opportunity in Brazil and Chile. The Brazilian gaming market, valued at $1.3 billion, drives demand for entry-level to mid-range PSUs. Argentina’s import restrictions have encouraged local assembly operations, though component quality remains inconsistent. A key trend is the growing second-hand PSU market, accounting for nearly 30% of transactions. Internet cafe expansions in Colombia and Peru provide steady commercial demand, while voltage stability issues necessitate robust surge protection features in consumer units.

Middle East & Africa
This emerging market is bifurcated between high-end demand in GCC countries and price-sensitive segments across Africa. The UAE and Saudi Arabia show strong preference for branded 80 PLUS Gold/Platinum units, aligned with data center expansions. In contrast, African markets prioritize durability under unstable power conditions, making hybrid ATX units popular. South Africa leads in regional distribution, while North African countries see growing OEM partnerships. Challenges include counterfeit imports and low consumer awareness about efficiency ratings, though infrastructure development projects promise long-term growth.

Report Scope

This market research report provides a comprehensive analysis of the Global and regional Power Supply Unit (PSU) markets, covering the forecast period 2025–2032. It offers detailed insights into market dynamics, technological advancements, competitive landscape, and key trends shaping the industry.

Key focus areas of the report include:

  • Market Size & Forecast: Historical data and future projections for revenue, unit shipments, and market value across major regions and segments. The Global PSU market was valued at USD 35.2 billion in 2023 and is projected to reach USD 48.7 billion by 2030, growing at a CAGR of 4.8%.
  • Segmentation Analysis: Detailed breakdown by product type (AC/DC), technology (modular/non-modular), application (PCs/mobile devices), and end-user industry to identify high-growth segments and investment opportunities.
  • Regional Outlook: Insights into market performance across North America, Europe, Asia-Pacific, Latin America, and the Middle East & Africa, including country-level analysis. Asia-Pacific dominates with over 42% market share in 2023.
  • Competitive Landscape: Profiles of leading market participants including Corsair, Cooler Master, Seasonic, Thermaltake, and 14 other key players, covering their product portfolios, R&D investments, and recent M&A activities.
  • Technology Trends & Innovation: Assessment of emerging technologies including 80+ Platinum efficiency standards, digital PSUs, and AI-powered power management solutions.
  • Market Drivers & Restraints: Evaluation of growth drivers (gaming PC demand, data center expansion) and challenges (supply chain disruptions, raw material price volatility).
  • Stakeholder Analysis: Strategic insights for PSU manufacturers, OEMs, component suppliers, and investors regarding market opportunities and competitive strategies.

The report employs primary and secondary research methodologies, including interviews with industry leaders, analysis of financial reports, and validation through market intelligence platforms to ensure data accuracy.

FREQUENTLY ASKED QUESTIONS:

What is the current market size of Global Power Supply Unit (PSU) Market?

-> Power Supply Unit (PSU) Market size was valued at US$ 12.47 billion in 2024 and is projected to reach US$ 21.38 billion by 2032, at a CAGR of 6.3% during the forecast period 2025-2032.

Which key companies operate in Global PSU Market?

-> Key players include Corsair, Cooler Master, Seasonic, Thermaltake, FSP, Antec, and SilverStone Technology, among others.

What are the key growth drivers?

-> Key growth drivers include rising gaming PC demand, data center expansion, and increasing adoption of high-efficiency PSUs.

Which region dominates the market?

-> Asia-Pacific holds the largest market share (42%), driven by strong manufacturing presence in China and Taiwan.

What are the emerging trends?

-> Emerging trends include digital PSUs with monitoring capabilities, higher efficiency standards (80+ Titanium), and modular cable designs.

Global Power Supply Unit (PSU) Market Research Report 2025(Status and Outlook)

Get Sample Report PDF for Exclusive Insights

Report Sample Includes

  • Table of Contents
  • List of Tables & Figures
  • Charts, Research Methodology, and more...
PDF Icon Download Sample Report PDF

Download Sample Report

Table of Content

Table of Contents
1 Research Methodology and Statistical Scope
1.1 Market Definition and Statistical Scope of Power Supply Unit (PSU)
1.2 Key Market Segments
1.2.1 Power Supply Unit (PSU) Segment by Type
1.2.2 Power Supply Unit (PSU) Segment by Application
1.3 Methodology & Sources of Information
1.3.1 Research Methodology
1.3.2 Research Process
1.3.3 Market Breakdown and Data Triangulation
1.3.4 Base Year
1.3.5 Report Assumptions & Caveats
2 Power Supply Unit (PSU) Market Overview
2.1 Global Market Overview
2.1.1 Global Power Supply Unit (PSU) Market Size (M USD) Estimates and Forecasts (2019-2032)
2.1.2 Global Power Supply Unit (PSU) Sales Estimates and Forecasts (2019-2032)
2.2 Market Segment Executive Summary
2.3 Global Market Size by Region
3 Power Supply Unit (PSU) Market Competitive Landscape
3.1 Global Power Supply Unit (PSU) Sales by Manufacturers (2019-2025)
3.2 Global Power Supply Unit (PSU) Revenue Market Share by Manufacturers (2019-2025)
3.3 Power Supply Unit (PSU) Market Share by Company Type (Tier 1, Tier 2, and Tier 3)
3.4 Global Power Supply Unit (PSU) Average Price by Manufacturers (2019-2025)
3.5 Manufacturers Power Supply Unit (PSU) Sales Sites, Area Served, Product Type
3.6 Power Supply Unit (PSU) Market Competitive Situation and Trends
3.6.1 Power Supply Unit (PSU) Market Concentration Rate
3.6.2 Global 5 and 10 Largest Power Supply Unit (PSU) Players Market Share by Revenue
3.6.3 Mergers & Acquisitions, Expansion
4 Power Supply Unit (PSU) Industry Chain Analysis
4.1 Power Supply Unit (PSU) Industry Chain Analysis
4.2 Market Overview of Key Raw Materials
4.3 Midstream Market Analysis
4.4 Downstream Customer Analysis
5 The Development and Dynamics of Power Supply Unit (PSU) Market
5.1 Key Development Trends
5.2 Driving Factors
5.3 Market Challenges
5.4 Market Restraints
5.5 Industry News
5.5.1 New Product Developments
5.5.2 Mergers & Acquisitions
5.5.3 Expansions
5.5.4 Collaboration/Supply Contracts
5.6 Industry Policies
6 Power Supply Unit (PSU) Market Segmentation by Type
6.1 Evaluation Matrix of Segment Market Development Potential (Type)
6.2 Global Power Supply Unit (PSU) Sales Market Share by Type (2019-2025)
6.3 Global Power Supply Unit (PSU) Market Size Market Share by Type (2019-2025)
6.4 Global Power Supply Unit (PSU) Price by Type (2019-2025)
7 Power Supply Unit (PSU) Market Segmentation by Application
7.1 Evaluation Matrix of Segment Market Development Potential (Application)
7.2 Global Power Supply Unit (PSU) Market Sales by Application (2019-2025)
7.3 Global Power Supply Unit (PSU) Market Size (M USD) by Application (2019-2025)
7.4 Global Power Supply Unit (PSU) Sales Growth Rate by Application (2019-2025)
8 Power Supply Unit (PSU) Market Segmentation by Region
8.1 Global Power Supply Unit (PSU) Sales by Region
8.1.1 Global Power Supply Unit (PSU) Sales by Region
8.1.2 Global Power Supply Unit (PSU) Sales Market Share by Region
8.2 North America
8.2.1 North America Power Supply Unit (PSU) Sales by Country
8.2.2 U.S.
8.2.3 Canada
8.2.4 Mexico
8.3 Europe
8.3.1 Europe Power Supply Unit (PSU) Sales by Country
8.3.2 Germany
8.3.3 France
8.3.4 U.K.
8.3.5 Italy
8.3.6 Russia
8.4 Asia Pacific
8.4.1 Asia Pacific Power Supply Unit (PSU) Sales by Region
8.4.2 China
8.4.3 Japan
8.4.4 South Korea
8.4.5 India
8.4.6 Southeast Asia
8.5 South America
8.5.1 South America Power Supply Unit (PSU) Sales by Country
8.5.2 Brazil
8.5.3 Argentina
8.5.4 Columbia
8.6 Middle East and Africa
8.6.1 Middle East and Africa Power Supply Unit (PSU) Sales by Region
8.6.2 Saudi Arabia
8.6.3 UAE
8.6.4 Egypt
8.6.5 Nigeria
8.6.6 South Africa
9 Key Companies Profile
9.1 New Japan Radio
9.1.1 New Japan Radio Power Supply Unit (PSU) Basic Information
9.1.2 New Japan Radio Power Supply Unit (PSU) Product Overview
9.1.3 New Japan Radio Power Supply Unit (PSU) Product Market Performance
9.1.4 New Japan Radio Business Overview
9.1.5 New Japan Radio Power Supply Unit (PSU) SWOT Analysis
9.1.6 New Japan Radio Recent Developments
9.2 Antec
9.2.1 Antec Power Supply Unit (PSU) Basic Information
9.2.2 Antec Power Supply Unit (PSU) Product Overview
9.2.3 Antec Power Supply Unit (PSU) Product Market Performance
9.2.4 Antec Business Overview
9.2.5 Antec Power Supply Unit (PSU) SWOT Analysis
9.2.6 Antec Recent Developments
9.3 Cooler Master
9.3.1 Cooler Master Power Supply Unit (PSU) Basic Information
9.3.2 Cooler Master Power Supply Unit (PSU) Product Overview
9.3.3 Cooler Master Power Supply Unit (PSU) Product Market Performance
9.3.4 Cooler Master Power Supply Unit (PSU) SWOT Analysis
9.3.5 Cooler Master Business Overview
9.3.6 Cooler Master Recent Developments
9.4 Corsair
9.4.1 Corsair Power Supply Unit (PSU) Basic Information
9.4.2 Corsair Power Supply Unit (PSU) Product Overview
9.4.3 Corsair Power Supply Unit (PSU) Product Market Performance
9.4.4 Corsair Business Overview
9.4.5 Corsair Recent Developments
9.5 Cougar Gaming
9.5.1 Cougar Gaming Power Supply Unit (PSU) Basic Information
9.5.2 Cougar Gaming Power Supply Unit (PSU) Product Overview
9.5.3 Cougar Gaming Power Supply Unit (PSU) Product Market Performance
9.5.4 Cougar Gaming Business Overview
9.5.5 Cougar Gaming Recent Developments
9.6 FSP
9.6.1 FSP Power Supply Unit (PSU) Basic Information
9.6.2 FSP Power Supply Unit (PSU) Product Overview
9.6.3 FSP Power Supply Unit (PSU) Product Market Performance
9.6.4 FSP Business Overview
9.6.5 FSP Recent Developments
9.7 Gigabyte
9.7.1 Gigabyte Power Supply Unit (PSU) Basic Information
9.7.2 Gigabyte Power Supply Unit (PSU) Product Overview
9.7.3 Gigabyte Power Supply Unit (PSU) Product Market Performance
9.7.4 Gigabyte Business Overview
9.7.5 Gigabyte Recent Developments
9.8 SilverStone Technology
9.8.1 SilverStone Technology Power Supply Unit (PSU) Basic Information
9.8.2 SilverStone Technology Power Supply Unit (PSU) Product Overview
9.8.3 SilverStone Technology Power Supply Unit (PSU) Product Market Performance
9.8.4 SilverStone Technology Business Overview
9.8.5 SilverStone Technology Recent Developments
9.9 Seasonic
9.9.1 Seasonic Power Supply Unit (PSU) Basic Information
9.9.2 Seasonic Power Supply Unit (PSU) Product Overview
9.9.3 Seasonic Power Supply Unit (PSU) Product Market Performance
9.9.4 Seasonic Business Overview
9.9.5 Seasonic Recent Developments
9.10 Thermaltake
9.10.1 Thermaltake Power Supply Unit (PSU) Basic Information
9.10.2 Thermaltake Power Supply Unit (PSU) Product Overview
9.10.3 Thermaltake Power Supply Unit (PSU) Product Market Performance
9.10.4 Thermaltake Business Overview
9.10.5 Thermaltake Recent Developments
9.11 XFX
9.11.1 XFX Power Supply Unit (PSU) Basic Information
9.11.2 XFX Power Supply Unit (PSU) Product Overview
9.11.3 XFX Power Supply Unit (PSU) Product Market Performance
9.11.4 XFX Business Overview
9.11.5 XFX Recent Developments
9.12 Seventeam
9.12.1 Seventeam Power Supply Unit (PSU) Basic Information
9.12.2 Seventeam Power Supply Unit (PSU) Product Overview
9.12.3 Seventeam Power Supply Unit (PSU) Product Market Performance
9.12.4 Seventeam Business Overview
9.12.5 Seventeam Recent Developments
9.13 LIAN LI
9.13.1 LIAN LI Power Supply Unit (PSU) Basic Information
9.13.2 LIAN LI Power Supply Unit (PSU) Product Overview
9.13.3 LIAN LI Power Supply Unit (PSU) Product Market Performance
9.13.4 LIAN LI Business Overview
9.13.5 LIAN LI Recent Developments
9.14 Zalman Tech
9.14.1 Zalman Tech Power Supply Unit (PSU) Basic Information
9.14.2 Zalman Tech Power Supply Unit (PSU) Product Overview
9.14.3 Zalman Tech Power Supply Unit (PSU) Product Market Performance
9.14.4 Zalman Tech Business Overview
9.14.5 Zalman Tech Recent Developments
10 Power Supply Unit (PSU) Market Forecast by Region
10.1 Global Power Supply Unit (PSU) Market Size Forecast
10.2 Global Power Supply Unit (PSU) Market Forecast by Region
10.2.1 North America Market Size Forecast by Country
10.2.2 Europe Power Supply Unit (PSU) Market Size Forecast by Country
10.2.3 Asia Pacific Power Supply Unit (PSU) Market Size Forecast by Region
10.2.4 South America Power Supply Unit (PSU) Market Size Forecast by Country
10.2.5 Middle East and Africa Forecasted Consumption of Power Supply Unit (PSU) by Country
11 Forecast Market by Type and by Application (2025-2032)
11.1 Global Power Supply Unit (PSU) Market Forecast by Type (2025-2032)
11.1.1 Global Forecasted Sales of Power Supply Unit (PSU) by Type (2025-2032)
11.1.2 Global Power Supply Unit (PSU) Market Size Forecast by Type (2025-2032)
11.1.3 Global Forecasted Price of Power Supply Unit (PSU) by Type (2025-2032)
11.2 Global Power Supply Unit (PSU) Market Forecast by Application (2025-2032)
11.2.1 Global Power Supply Unit (PSU) Sales (K Units) Forecast by Application
11.2.2 Global Power Supply Unit (PSU) Market Size (M USD) Forecast by Application (2025-2032)
12 Conclusion and Key FindingsList of Tables
Table 1. Introduction of the Type
Table 2. Introduction of the Application
Table 3. Market Size (M USD) Segment Executive Summary
Table 4. Power Supply Unit (PSU) Market Size Comparison by Region (M USD)
Table 5. Global Power Supply Unit (PSU) Sales (K Units) by Manufacturers (2019-2025)
Table 6. Global Power Supply Unit (PSU) Sales Market Share by Manufacturers (2019-2025)
Table 7. Global Power Supply Unit (PSU) Revenue (M USD) by Manufacturers (2019-2025)
Table 8. Global Power Supply Unit (PSU) Revenue Share by Manufacturers (2019-2025)
Table 9. Company Type (Tier 1, Tier 2, and Tier 3) & (based on the Revenue in Power Supply Unit (PSU) as of 2022)
Table 10. Global Market Power Supply Unit (PSU) Average Price (USD/Unit) of Key Manufacturers (2019-2025)
Table 11. Manufacturers Power Supply Unit (PSU) Sales Sites and Area Served
Table 12. Manufacturers Power Supply Unit (PSU) Product Type
Table 13. Global Power Supply Unit (PSU) Manufacturers Market Concentration Ratio (CR5 and HHI)
Table 14. Mergers & Acquisitions, Expansion Plans
Table 15. Industry Chain Map of Power Supply Unit (PSU)
Table 16. Market Overview of Key Raw Materials
Table 17. Midstream Market Analysis
Table 18. Downstream Customer Analysis
Table 19. Key Development Trends
Table 20. Driving Factors
Table 21. Power Supply Unit (PSU) Market Challenges
Table 22. Global Power Supply Unit (PSU) Sales by Type (K Units)
Table 23. Global Power Supply Unit (PSU) Market Size by Type (M USD)
Table 24. Global Power Supply Unit (PSU) Sales (K Units) by Type (2019-2025)
Table 25. Global Power Supply Unit (PSU) Sales Market Share by Type (2019-2025)
Table 26. Global Power Supply Unit (PSU) Market Size (M USD) by Type (2019-2025)
Table 27. Global Power Supply Unit (PSU) Market Size Share by Type (2019-2025)
Table 28. Global Power Supply Unit (PSU) Price (USD/Unit) by Type (2019-2025)
Table 29. Global Power Supply Unit (PSU) Sales (K Units) by Application
Table 30. Global Power Supply Unit (PSU) Market Size by Application
Table 31. Global Power Supply Unit (PSU) Sales by Application (2019-2025) & (K Units)
Table 32. Global Power Supply Unit (PSU) Sales Market Share by Application (2019-2025)
Table 33. Global Power Supply Unit (PSU) Sales by Application (2019-2025) & (M USD)
Table 34. Global Power Supply Unit (PSU) Market Share by Application (2019-2025)
Table 35. Global Power Supply Unit (PSU) Sales Growth Rate by Application (2019-2025)
Table 36. Global Power Supply Unit (PSU) Sales by Region (2019-2025) & (K Units)
Table 37. Global Power Supply Unit (PSU) Sales Market Share by Region (2019-2025)
Table 38. North America Power Supply Unit (PSU) Sales by Country (2019-2025) & (K Units)
Table 39. Europe Power Supply Unit (PSU) Sales by Country (2019-2025) & (K Units)
Table 40. Asia Pacific Power Supply Unit (PSU) Sales by Region (2019-2025) & (K Units)
Table 41. South America Power Supply Unit (PSU) Sales by Country (2019-2025) & (K Units)
Table 42. Middle East and Africa Power Supply Unit (PSU) Sales by Region (2019-2025) & (K Units)
Table 43. New Japan Radio Power Supply Unit (PSU) Basic Information
Table 44. New Japan Radio Power Supply Unit (PSU) Product Overview
Table 45. New Japan Radio Power Supply Unit (PSU) Sales (K Units), Revenue (M USD), Price (USD/Unit) and Gross Margin (2019-2025)
Table 46. New Japan Radio Business Overview
Table 47. New Japan Radio Power Supply Unit (PSU) SWOT Analysis
Table 48. New Japan Radio Recent Developments
Table 49. Antec Power Supply Unit (PSU) Basic Information
Table 50. Antec Power Supply Unit (PSU) Product Overview
Table 51. Antec Power Supply Unit (PSU) Sales (K Units), Revenue (M USD), Price (USD/Unit) and Gross Margin (2019-2025)
Table 52. Antec Business Overview
Table 53. Antec Power Supply Unit (PSU) SWOT Analysis
Table 54. Antec Recent Developments
Table 55. Cooler Master Power Supply Unit (PSU) Basic Information
Table 56. Cooler Master Power Supply Unit (PSU) Product Overview
Table 57. Cooler Master Power Supply Unit (PSU) Sales (K Units), Revenue (M USD), Price (USD/Unit) and Gross Margin (2019-2025)
Table 58. Cooler Master Power Supply Unit (PSU) SWOT Analysis
Table 59. Cooler Master Business Overview
Table 60. Cooler Master Recent Developments
Table 61. Corsair Power Supply Unit (PSU) Basic Information
Table 62. Corsair Power Supply Unit (PSU) Product Overview
Table 63. Corsair Power Supply Unit (PSU) Sales (K Units), Revenue (M USD), Price (USD/Unit) and Gross Margin (2019-2025)
Table 64. Corsair Business Overview
Table 65. Corsair Recent Developments
Table 66. Cougar Gaming Power Supply Unit (PSU) Basic Information
Table 67. Cougar Gaming Power Supply Unit (PSU) Product Overview
Table 68. Cougar Gaming Power Supply Unit (PSU) Sales (K Units), Revenue (M USD), Price (USD/Unit) and Gross Margin (2019-2025)
Table 69. Cougar Gaming Business Overview
Table 70. Cougar Gaming Recent Developments
Table 71. FSP Power Supply Unit (PSU) Basic Information
Table 72. FSP Power Supply Unit (PSU) Product Overview
Table 73. FSP Power Supply Unit (PSU) Sales (K Units), Revenue (M USD), Price (USD/Unit) and Gross Margin (2019-2025)
Table 74. FSP Business Overview
Table 75. FSP Recent Developments
Table 76. Gigabyte Power Supply Unit (PSU) Basic Information
Table 77. Gigabyte Power Supply Unit (PSU) Product Overview
Table 78. Gigabyte Power Supply Unit (PSU) Sales (K Units), Revenue (M USD), Price (USD/Unit) and Gross Margin (2019-2025)
Table 79. Gigabyte Business Overview
Table 80. Gigabyte Recent Developments
Table 81. SilverStone Technology Power Supply Unit (PSU) Basic Information
Table 82. SilverStone Technology Power Supply Unit (PSU) Product Overview
Table 83. SilverStone Technology Power Supply Unit (PSU) Sales (K Units), Revenue (M USD), Price (USD/Unit) and Gross Margin (2019-2025)
Table 84. SilverStone Technology Business Overview
Table 85. SilverStone Technology Recent Developments
Table 86. Seasonic Power Supply Unit (PSU) Basic Information
Table 87. Seasonic Power Supply Unit (PSU) Product Overview
Table 88. Seasonic Power Supply Unit (PSU) Sales (K Units), Revenue (M USD), Price (USD/Unit) and Gross Margin (2019-2025)
Table 89. Seasonic Business Overview
Table 90. Seasonic Recent Developments
Table 91. Thermaltake Power Supply Unit (PSU) Basic Information
Table 92. Thermaltake Power Supply Unit (PSU) Product Overview
Table 93. Thermaltake Power Supply Unit (PSU) Sales (K Units), Revenue (M USD), Price (USD/Unit) and Gross Margin (2019-2025)
Table 94. Thermaltake Business Overview
Table 95. Thermaltake Recent Developments
Table 96. XFX Power Supply Unit (PSU) Basic Information
Table 97. XFX Power Supply Unit (PSU) Product Overview
Table 98. XFX Power Supply Unit (PSU) Sales (K Units), Revenue (M USD), Price (USD/Unit) and Gross Margin (2019-2025)
Table 99. XFX Business Overview
Table 100. XFX Recent Developments
Table 101. Seventeam Power Supply Unit (PSU) Basic Information
Table 102. Seventeam Power Supply Unit (PSU) Product Overview
Table 103. Seventeam Power Supply Unit (PSU) Sales (K Units), Revenue (M USD), Price (USD/Unit) and Gross Margin (2019-2025)
Table 104. Seventeam Business Overview
Table 105. Seventeam Recent Developments
Table 106. LIAN LI Power Supply Unit (PSU) Basic Information
Table 107. LIAN LI Power Supply Unit (PSU) Product Overview
Table 108. LIAN LI Power Supply Unit (PSU) Sales (K Units), Revenue (M USD), Price (USD/Unit) and Gross Margin (2019-2025)
Table 109. LIAN LI Business Overview
Table 110. LIAN LI Recent Developments
Table 111. Zalman Tech Power Supply Unit (PSU) Basic Information
Table 112. Zalman Tech Power Supply Unit (PSU) Product Overview
Table 113. Zalman Tech Power Supply Unit (PSU) Sales (K Units), Revenue (M USD), Price (USD/Unit) and Gross Margin (2019-2025)
Table 114. Zalman Tech Business Overview
Table 115. Zalman Tech Recent Developments
Table 116. Global Power Supply Unit (PSU) Sales Forecast by Region (2025-2032) & (K Units)
Table 117. Global Power Supply Unit (PSU) Market Size Forecast by Region (2025-2032) & (M USD)
Table 118. North America Power Supply Unit (PSU) Sales Forecast by Country (2025-2032) & (K Units)
Table 119. North America Power Supply Unit (PSU) Market Size Forecast by Country (2025-2032) & (M USD)
Table 120. Europe Power Supply Unit (PSU) Sales Forecast by Country (2025-2032) & (K Units)
Table 121. Europe Power Supply Unit (PSU) Market Size Forecast by Country (2025-2032) & (M USD)
Table 122. Asia Pacific Power Supply Unit (PSU) Sales Forecast by Region (2025-2032) & (K Units)
Table 123. Asia Pacific Power Supply Unit (PSU) Market Size Forecast by Region (2025-2032) & (M USD)
Table 124. South America Power Supply Unit (PSU) Sales Forecast by Country (2025-2032) & (K Units)
Table 125. South America Power Supply Unit (PSU) Market Size Forecast by Country (2025-2032) & (M USD)
Table 126. Middle East and Africa Power Supply Unit (PSU) Consumption Forecast by Country (2025-2032) & (Units)
Table 127. Middle East and Africa Power Supply Unit (PSU) Market Size Forecast by Country (2025-2032) & (M USD)
Table 128. Global Power Supply Unit (PSU) Sales Forecast by Type (2025-2032) & (K Units)
Table 129. Global Power Supply Unit (PSU) Market Size Forecast by Type (2025-2032) & (M USD)
Table 130. Global Power Supply Unit (PSU) Price Forecast by Type (2025-2032) & (USD/Unit)
Table 131. Global Power Supply Unit (PSU) Sales (K Units) Forecast by Application (2025-2032)
Table 132. Global Power Supply Unit (PSU) Market Size Forecast by Application (2025-2032) & (M USD)
List of Figures
Figure 1. Product Picture of Power Supply Unit (PSU)
Figure 2. Data Triangulation
Figure 3. Key Caveats
Figure 4. Global Power Supply Unit (PSU) Market Size (M USD), 2019-2032
Figure 5. Global Power Supply Unit (PSU) Market Size (M USD) (2019-2032)
Figure 6. Global Power Supply Unit (PSU) Sales (K Units) & (2019-2032)
Figure 7. Evaluation Matrix of Segment Market Development Potential (Type)
Figure 8. Evaluation Matrix of Segment Market Development Potential (Application)
Figure 9. Evaluation Matrix of Regional Market Development Potential
Figure 10. Power Supply Unit (PSU) Market Size by Country (M USD)
Figure 11. Power Supply Unit (PSU) Sales Share by Manufacturers in 2023
Figure 12. Global Power Supply Unit (PSU) Revenue Share by Manufacturers in 2023
Figure 13. Power Supply Unit (PSU) Market Share by Company Type (Tier 1, Tier 2 and Tier 3): 2023
Figure 14. Global Market Power Supply Unit (PSU) Average Price (USD/Unit) of Key Manufacturers in 2023
Figure 15. The Global 5 and 10 Largest Players: Market Share by Power Supply Unit (PSU) Revenue in 2023
Figure 16. Evaluation Matrix of Segment Market Development Potential (Type)
Figure 17. Global Power Supply Unit (PSU) Market Share by Type
Figure 18. Sales Market Share of Power Supply Unit (PSU) by Type (2019-2025)
Figure 19. Sales Market Share of Power Supply Unit (PSU) by Type in 2023
Figure 20. Market Size Share of Power Supply Unit (PSU) by Type (2019-2025)
Figure 21. Market Size Market Share of Power Supply Unit (PSU) by Type in 2023
Figure 22. Evaluation Matrix of Segment Market Development Potential (Application)
Figure 23. Global Power Supply Unit (PSU) Market Share by Application
Figure 24. Global Power Supply Unit (PSU) Sales Market Share by Application (2019-2025)
Figure 25. Global Power Supply Unit (PSU) Sales Market Share by Application in 2023
Figure 26. Global Power Supply Unit (PSU) Market Share by Application (2019-2025)
Figure 27. Global Power Supply Unit (PSU) Market Share by Application in 2023
Figure 28. Global Power Supply Unit (PSU) Sales Growth Rate by Application (2019-2025)
Figure 29. Global Power Supply Unit (PSU) Sales Market Share by Region (2019-2025)
Figure 30. North America Power Supply Unit (PSU) Sales and Growth Rate (2019-2025) & (K Units)
Figure 31. North America Power Supply Unit (PSU) Sales Market Share by Country in 2023
Figure 32. U.S. Power Supply Unit (PSU) Sales and Growth Rate (2019-2025) & (K Units)
Figure 33. Canada Power Supply Unit (PSU) Sales (K Units) and Growth Rate (2019-2025)
Figure 34. Mexico Power Supply Unit (PSU) Sales (Units) and Growth Rate (2019-2025)
Figure 35. Europe Power Supply Unit (PSU) Sales and Growth Rate (2019-2025) & (K Units)
Figure 36. Europe Power Supply Unit (PSU) Sales Market Share by Country in 2023
Figure 37. Germany Power Supply Unit (PSU) Sales and Growth Rate (2019-2025) & (K Units)
Figure 38. France Power Supply Unit (PSU) Sales and Growth Rate (2019-2025) & (K Units)
Figure 39. U.K. Power Supply Unit (PSU) Sales and Growth Rate (2019-2025) & (K Units)
Figure 40. Italy Power Supply Unit (PSU) Sales and Growth Rate (2019-2025) & (K Units)
Figure 41. Russia Power Supply Unit (PSU) Sales and Growth Rate (2019-2025) & (K Units)
Figure 42. Asia Pacific Power Supply Unit (PSU) Sales and Growth Rate (K Units)
Figure 43. Asia Pacific Power Supply Unit (PSU) Sales Market Share by Region in 2023
Figure 44. China Power Supply Unit (PSU) Sales and Growth Rate (2019-2025) & (K Units)
Figure 45. Japan Power Supply Unit (PSU) Sales and Growth Rate (2019-2025) & (K Units)
Figure 46. South Korea Power Supply Unit (PSU) Sales and Growth Rate (2019-2025) & (K Units)
Figure 47. India Power Supply Unit (PSU) Sales and Growth Rate (2019-2025) & (K Units)
Figure 48. Southeast Asia Power Supply Unit (PSU) Sales and Growth Rate (2019-2025) & (K Units)
Figure 49. South America Power Supply Unit (PSU) Sales and Growth Rate (K Units)
Figure 50. South America Power Supply Unit (PSU) Sales Market Share by Country in 2023
Figure 51. Brazil Power Supply Unit (PSU) Sales and Growth Rate (2019-2025) & (K Units)
Figure 52. Argentina Power Supply Unit (PSU) Sales and Growth Rate (2019-2025) & (K Units)
Figure 53. Columbia Power Supply Unit (PSU) Sales and Growth Rate (2019-2025) & (K Units)
Figure 54. Middle East and Africa Power Supply Unit (PSU) Sales and Growth Rate (K Units)
Figure 55. Middle East and Africa Power Supply Unit (PSU) Sales Market Share by Region in 2023
Figure 56. Saudi Arabia Power Supply Unit (PSU) Sales and Growth Rate (2019-2025) & (K Units)
Figure 57. UAE Power Supply Unit (PSU) Sales and Growth Rate (2019-2025) & (K Units)
Figure 58. Egypt Power Supply Unit (PSU) Sales and Growth Rate (2019-2025) & (K Units)
Figure 59. Nigeria Power Supply Unit (PSU) Sales and Growth Rate (2019-2025) & (K Units)
Figure 60. South Africa Power Supply Unit (PSU) Sales and Growth Rate (2019-2025) & (K Units)
Figure 61. Global Power Supply Unit (PSU) Sales Forecast by Volume (2019-2032) & (K Units)
Figure 62. Global Power Supply Unit (PSU) Market Size Forecast by Value (2019-2032) & (M USD)
Figure 63. Global Power Supply Unit (PSU) Sales Market Share Forecast by Type (2025-2032)
Figure 64. Global Power Supply Unit (PSU) Market Share Forecast by Type (2025-2032)
Figure 65. Global Power Supply Unit (PSU) Sales Forecast by Application (2025-2032)
Figure 66. Global Power Supply Unit (PSU) Market Share Forecast by Application (2025-2032)