Photonic Crystals Market Overview
Photonic crystals are periodic dielectric structures that are designed to form the energy band structure for photons, which either allows or forbids the propagation of electromagnetic waves of certain frequency ranges, making them ideal for light-harvesting applications. Photonic crystals are attractive optical materials for controlling and manipulating light flow. One dimensional photonic crystals are already in widespread use, in the form of thin-film optics, with applications from low and high reflection coatings on lenses and mirrors to colour changing paints and inks. Two-dimensional photonic crystals are mainly commercialized with photonic crystal fibers. At present, two-dimensional photonic crystals are the most commonly used photonic crystal products, and the report data also mainly shows photonic crystal fibers.
This report provides a deep insight into the global Photonic Crystals market covering all its essential aspects. This ranges from a macro overview of the market to micro details of the market size, competitive landscape, development trend, niche market, key market drivers and challenges, SWOT analysis, value chain analysis, etc.
The analysis helps the reader to shape the competition within the industries and strategies for the competitive environment to enhance the potential profit. Furthermore, it provides a simple framework for evaluating and accessing the position of the business organization. The report structure also focuses on the competitive landscape of the Global Photonic Crystals Market, this report introduces in detail the market share, market performance, product situation, operation situation, etc. of the main players, which helps the readers in the industry to identify the main competitors and deeply understand the competition pattern of the market.
In a word, this report is a must-read for industry players, investors, researchers, consultants, business strategists, and all those who have any kind of stake or are planning to foray into the Photonic Crystals market in any manner.
Photonic Crystals Market Analysis:
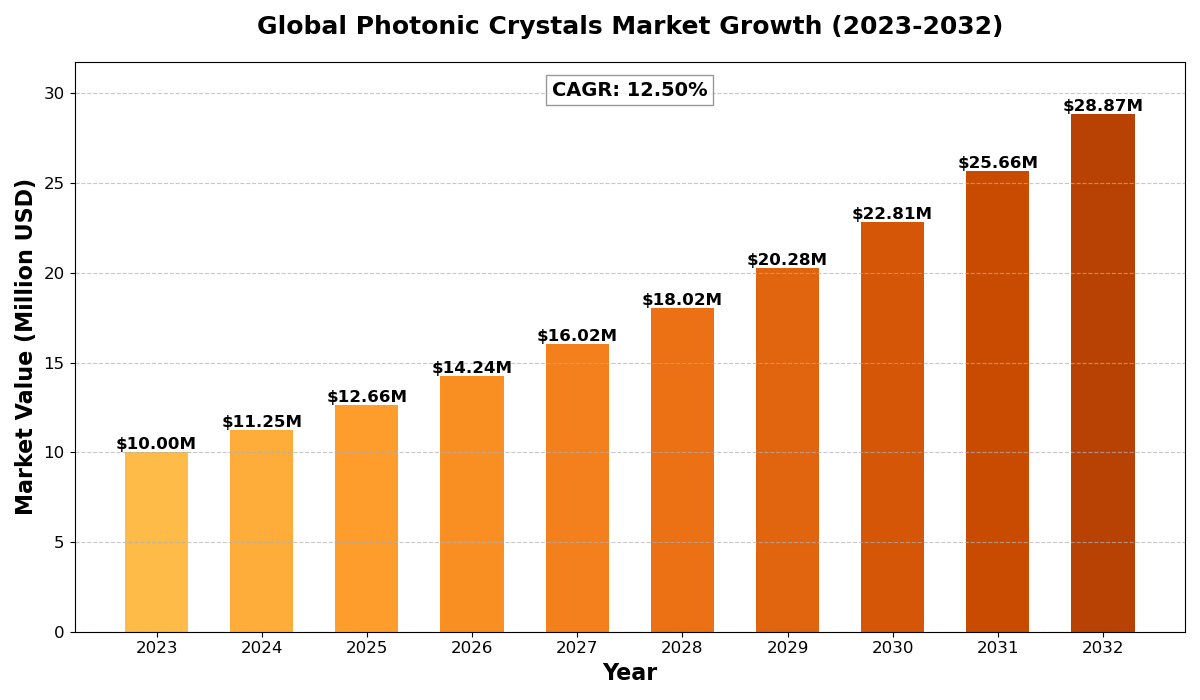
The Global Photonic Crystals Market size was estimated at USD 10 million in 2023 and is projected to reach USD 28.87 million by 2032, exhibiting a CAGR of 12.50% during the forecast period.
North America Photonic Crystals market size was estimated at USD 3.19 million in 2023, at a CAGR of 10.71% during the forecast period of 2025 through 2032.
Photonic Crystals Key Market Trends :
Increase in Two-Dimensional Photonic Crystals
Two-dimensional photonic crystals are becoming more popular, especially in fiber optics and communication systems, due to their enhanced performance in controlling light propagation and better efficiency.Rising Adoption of Photonic Crystals in Medical Applications
With advancements in medical diagnostics and treatments, photonic crystals are increasingly being used for laser-based medical equipment, enhancing precision and efficiency.Growing Use in Communication Systems
The demand for high-speed communication networks, particularly 5G, has accelerated the adoption of photonic crystals in optical fibers, improving data transmission rates and network reliability.Technological Advances in Photonic Crystal Design
Innovations in manufacturing processes and material science are enabling more complex and efficient photonic crystal structures, boosting their potential applications across industries.Sustainability and Light-Harvesting Technologies
As sustainability becomes a greater priority, photonic crystals are being explored for light-harvesting applications in renewable energy systems, such as solar cells and energy-efficient lighting.
Photonic Crystals Market Regional Analysis :

North America:
Strong demand driven by EVs, 5G infrastructure, and renewable energy, with the U.S. leading the market.
Europe:
Growth fueled by automotive electrification, renewable energy, and strong regulatory support, with Germany as a key player.
Asia-Pacific:
Dominates the market due to large-scale manufacturing in China and Japan, with growing demand from EVs, 5G, and semiconductors.
South America:
Emerging market, driven by renewable energy and EV adoption, with Brazil leading growth.
Middle East & Africa:
Gradual growth, mainly due to investments in renewable energy and EV infrastructure, with Saudi Arabia and UAE as key contributors.
Photonic Crystals Market Segmentation :
The research report includes specific segments by region (country), manufacturers, Type, and Application. Market segmentation creates subsets of a market based on product type, end-user or application, Geographic, and other factors. By understanding the market segments, the decision-maker can leverage this targeting in the product, sales, and marketing strategies. Market segments can power your product development cycles by informing how you create product offerings for different segments.
Key Company
- NKT Photonics A/S
- Yangtze Optical Electronic
- iXblue Photonics
- Shanghai Precilasers
- GLOphotonics SAS
- Kongtum Science & Technology
- IRFlex Corporation
Market Segmentation (by Type)
- One-Dimensional Photonic Crystal
- Two-Dimensional Photonic Crystals
Market Segmentation (by Application)
- Fiber-optic Laser
- Communication Systems
- Medical & Life Science
- Aerospace & Defense
Market Drivers
Technological Advancements in Photonic Crystal Manufacturing
Enhanced manufacturing techniques for photonic crystals are making them more affordable and accessible, fueling market growth. These advances allow for the creation of more complex and efficient structures that are ideal for various applications.Increasing Demand for High-Speed Communication
The growing global demand for faster communication networks, such as 5G, is driving the need for photonic crystal-based optical fibers to ensure improved data transmission and network performance.Rising Applications in Medical and Life Sciences
Photonic crystals are being integrated into medical devices and diagnostic tools, especially in fiber-optic-based systems, offering enhanced accuracy and performance in treatments and procedures.
Market Restraints
High Initial Investment
The high cost of developing and manufacturing photonic crystal products can hinder their widespread adoption, especially in small to medium-sized businesses with limited budgets.Complex Design and Fabrication Processes
The intricate design and fabrication processes involved in creating photonic crystals may slow down production and introduce challenges in scaling up their use for mass-market applications.Limited Awareness in Emerging Markets
While photonic crystals have vast potential, the technology is still relatively unknown in many emerging markets, limiting its adoption outside of established regions like North America and Europe.
Market Opportunities
Integration into Renewable Energy Systems
As global efforts to transition to renewable energy sources increase, photonic crystals offer potential applications in solar energy systems, boosting their market presence in the green technology sector.Growth in Fiber-optic Communication
The rapid expansion of fiber-optic networks presents a major growth opportunity for photonic crystal fibers, which offer significant advantages in terms of data transmission rates and reliability.Medical and Life Science Innovations
The increasing need for advanced medical treatments and diagnostic tools presents an opportunity for photonic crystals to become a key component in developing cutting-edge medical devices and technologies.
Market Challenges
Competition from Alternative Technologies
The photonic crystals market faces competition from other emerging technologies in communication, sensing, and energy applications, which could slow the adoption of photonic crystals.Regulatory and Standardization Issues
The lack of standardized manufacturing processes and regulations for photonic crystals may pose challenges in ensuring product consistency and compliance, especially in industries like aerospace and medical applications.Complexity in Mass Production
The sophisticated nature of photonic crystals makes it difficult to scale production for large-scale commercial applications, which can limit market growth in the long term.
Key Benefits of This Market Research:
- Industry drivers, restraints, and opportunities covered in the study
- Neutral perspective on the market performance
- Recent industry trends and developments
- Competitive landscape & strategies of key players
- Potential & niche segments and regions exhibiting promising growth covered
- Historical, current, and projected market size, in terms of value
- In-depth analysis of the Photonic Crystals Market
- Overview of the regional outlook of the Photonic Crystals Market:
Key Reasons to Buy this Report:
- Access to date statistics compiled by our researchers. These provide you with historical and forecast data, which is analyzed to tell you why your market is set to change
- This enables you to anticipate market changes to remain ahead of your competitors
- You will be able to copy data from the Excel spreadsheet straight into your marketing plans, business presentations, or other strategic documents
- The concise analysis, clear graph, and table format will enable you to pinpoint the information you require quickly
- Provision of market value data for each segment and sub-segment
- Indicates the region and segment that is expected to witness the fastest growth as well as to dominate the market
- Provides insight into the market through Value Chain
- Market dynamics scenario, along with growth opportunities of the market in the years to come
- 6-month post-sales analyst support
Customization of the Report
In case of any queries or customization requirements, please connect with our sales team, who will ensure that your requirements are met.
FAQs
Q: What are the key driving factors and opportunities in the Photonic Crystals market?
A: The key driving factors include technological advancements, increasing demand for high-speed communication systems, and rising applications in medical devices. Opportunities lie in integrating photonic crystals into renewable energy systems and expanding their use in fiber-optic communication.
Q: Which region is projected to have the largest market share?
A: North America is projected to have the largest market share, driven by strong demand for photonic crystals in communication systems, medical applications, and ongoing technological innovations in the region.
Q: Who are the top players in the global Photonic Crystals market?
A: The top players include NKT Photonics A/S, Yangtze Optical Electronic, iXblue Photonics, Shanghai Precilasers, and GLOphotonics SAS, among others, leading the market with innovative solutions and products.
Q: What are the latest technological advancements in the Photonic Crystals industry?
A: The latest advancements include improvements in photonic crystal fiber design, new manufacturing techniques for increased efficiency, and the development of multi-dimensional photonic crystals for a wider range of applications.
Q: What is the current size of the global Photonic Crystals market?
A: The global Photonic Crystals market was valued at USD 10 million in 2023 and is expected to reach USD 28.87 million by 2032, growing at a CAGR of 12.50% during the forecast period.
Get Sample Report PDF for Exclusive Insights
Report Sample Includes
- Table of Contents
- List of Tables & Figures
- Charts, Research Methodology, and more...

